More Related Content
Similar to Montgomery county msi and avg dom
Similar to Montgomery county msi and avg dom (16)
More from Prudential Fox & Roach, Realtors
More from Prudential Fox & Roach, Realtors (20)
Montgomery county msi and avg dom
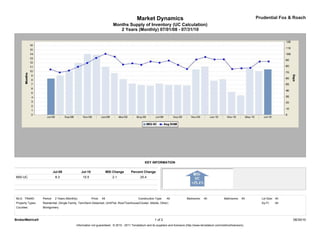
- 1. Market Dynamics Prudential Fox & Roach
Months Supply of Inventory (UC Calculation)
2 Years (Monthly) 07/01/08 - 07/31/10
KEY INFORMATION
Jul-08 Jul-10 MSI Change Percent Change
MSI-UC 8.3 10.5 2.1 25.4
MLS: TReND Period: 2 Years (Monthly) Price: All Construction Type: All Bedrooms: All Bathrooms: All Lot Size: All
Property Types: Residential: (Single Family, Twin/Semi-Detached, Unit/Flat, Row/Townhouse/Cluster, Mobile, Other) Sq Ft: All
Counties: Montgomery
BrokerMetrics® 1 of 2 08/30/10
Information not guaranteed. © 2010 - 2011 Terradatum and its suppliers and licensors (http://www.terradatum.com/metrics/licensors).
- 2. Market Dynamics Prudential Fox & Roach
Months Supply of Inventory (UC Calculation)
2 Years (Monthly) 07/01/08 - 07/31/10
Time # For Sale Last # Under
Period MSI NAR MSI Day of Month Contract # Sold
Jul-10 10.5 10.4 5,650 540 543
Jun-10 10.1 4.9 5,560 553 1,125
May-10 10.6 6.7 5,429 513 814
Apr-10 4.5 6.9 5,212 1,160 750
Mar-10 5.3 8.7 5,014 953 578
Feb-10 8.2 12.8 4,670 568 365
Jan-10 7.8 12.2 4,566 584 374
Dec-09 11.1 8.2 4,412 396 536
Nov-09 10.5 5.6 4,890 467 877
Oct-09 6.7 6.4 5,028 746 783
Sep-09 6.9 7.1 5,227 760 734
Aug-09 6.9 6.4 5,252 764 818
Jul-09 7.2 6.4 5,427 755 852
Jun-09 6.7 6.3 5,474 816 873
May-09 6.9 8.6 5,550 809 647
Apr-09 7.2 10.8 5,534 770 512
Mar-09 8.2 11.6 5,365 655 462
Feb-09 9.6 13.9 5,091 531 366
Jan-09 11.1 15.9 4,915 444 310
Dec-08 13.8 9.9 4,952 359 498
Nov-08 14.0 11.1 5,372 383 484
Oct-08 11.9 9.1 5,598 469 617
Sep-08 10.0 8.8 5,706 571 645
Aug-08 9.1 7.1 5,648 624 794
Jul-08 8.3 6.9 5,773 692 837
BrokerMetrics® 2 of 2 08/30/10
Information not guaranteed. © 2010 - 2011 Terradatum and its suppliers and licensors (http://www.terradatum.com/metrics/licensors).