Chester County Sold Median Price
•
0 likes•25 views

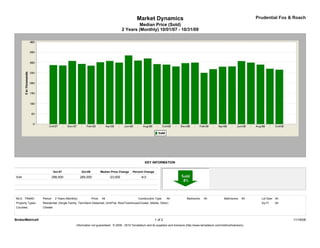
The document analyzes housing market trends in a particular region over a two year period from October 2007 to October 2009. It shows that during this period, the median price for homes sold decreased from $288,000 to $265,000, a drop of 8%. The number of new property listings also declined, while the number of homes under contract and sold each month remained relatively steady between 400-500 despite the declining market.

Recommended
Recommended
More Related Content
What's hot
What's hot (14)
Similar to Chester County Sold Median Price
Similar to Chester County Sold Median Price (17)
More from Prudential Fox & Roach, Realtors
More from Prudential Fox & Roach, Realtors (20)
Recently uploaded
Recently uploaded (20)
Chester County Sold Median Price
- 1. Market Dynamics Prudential Fox & Roach Median Price (Sold) 2 Years (Monthly) 10/01/07 - 10/31/09 KEY INFORMATION Oct-07 Oct-09 Median Price Change Percent Change Sold 288,000 265,000 -23,000 -8.0 MLS: TReND Period: 2 Years (Monthly) Price: All Construction Type: All Bedrooms: All Bathrooms: All Lot Size: All Property Types: Residential: (Single Family, Twin/Semi-Detached, Unit/Flat, Row/Townhouse/Cluster, Mobile, Other) Sq Ft: All Counties: Chester BrokerMetrics® 1 of 2 11/16/09 Information not guaranteed. © 2009 - 2010 Terradatum and its suppliers and licensors (http://www.terradatum.com/metrics/licensors).
- 2. Market Dynamics Prudential Fox & Roach Median Price (Sold) 2 Years (Monthly) 10/01/07 - 10/31/09 FOR SALE UNDER CONTRACT SOLD EXPIRED NEW LISTINGS Time Period Median $ # Properties Median $ # Properties Median $ # Properties Median $ # Properties Median $ # Properties Oct-09 360,000 4,552 285,000 462 265,000 463 379,900 444 319,000 728 Sep-09 355,000 4,773 270,000 483 269,900 429 348,945 466 319,500 797 Aug-09 350,250 4,846 285,900 449 290,000 506 360,000 421 304,882 798 Jul-09 359,900 4,942 285,000 472 300,000 510 372,494 422 314,950 830 Jun-09 359,900 5,093 304,450 526 307,500 530 365,000 455 324,900 905 May-09 364,900 5,082 325,000 511 281,500 367 394,900 383 349,900 972 Apr-09 359,900 4,901 290,000 419 280,000 317 350,000 372 329,900 1,009 Mar-09 359,000 4,653 299,900 414 268,000 297 344,500 347 339,000 937 Feb-09 354,900 4,363 264,450 320 250,000 238 377,192 327 329,900 751 Jan-09 359,900 4,346 299,900 289 300,000 226 389,000 445 348,900 705 Dec-08 359,900 4,327 299,000 239 297,500 282 370,990 447 334,950 406 Nov-08 359,900 4,600 298,750 245 281,120 300 386,397 434 317,858 518 Oct-08 363,392 4,798 275,000 284 290,000 336 382,804 432 335,000 720 Sep-08 365,000 4,933 300,000 355 292,575 418 370,995 500 349,900 905 Aug-08 364,900 4,869 309,950 364 320,000 522 369,900 477 325,000 702 Jul-08 365,000 5,179 314,700 484 310,000 551 389,900 528 345,000 886 Jun-08 366,684 5,240 317,000 459 335,000 579 385,000 488 349,500 953 May-08 369,900 5,240 339,900 513 299,950 458 379,900 440 349,900 1,113 Apr-08 369,900 5,179 319,899 552 308,000 452 395,175 500 359,900 1,195 Mar-08 364,900 4,871 300,000 475 301,700 361 357,052 412 350,000 1,148 Feb-08 365,000 4,523 329,900 418 285,000 293 388,900 382 349,900 904 Jan-08 365,000 4,482 299,900 379 293,500 264 375,000 484 359,900 981 Dec-07 368,500 4,231 309,900 214 308,245 336 387,000 516 319,898 375 Nov-07 369,900 4,638 289,900 324 286,000 379 386,750 458 339,900 639 Oct-07 365,000 4,930 285,000 369 288,000 425 369,900 562 336,500 991 BrokerMetrics® 2 of 2 11/16/09 Information not guaranteed. © 2009 - 2010 Terradatum and its suppliers and licensors (http://www.terradatum.com/metrics/licensors).