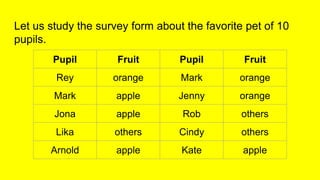
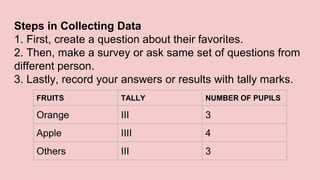
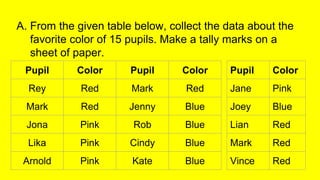
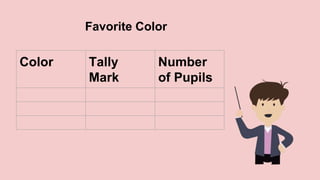
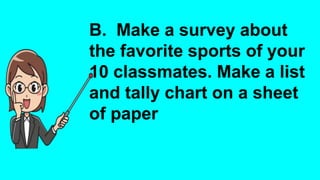
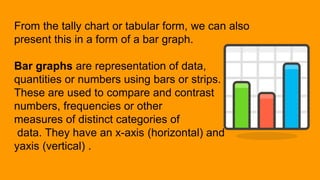
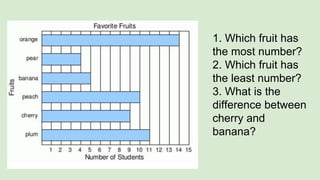
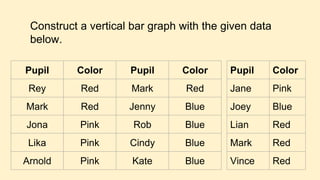
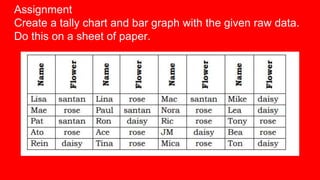
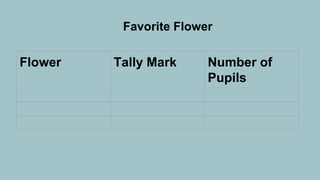
SlideShare a Scribd company logo
1 of 24
Math 4-Q4 Week 5
Collects data on two variables using any source. M4SP-IVg-1.4
Organizes data in tabular form and presents them in a single/double
horizontal or vertical bar graph. M4SP-IVg-2.4
Let’s Recall!
A children’s swimming pool is 13 m long, 9 m wide, and 3
m deep. How many cubic meters of water can it hold?
1. What is asked in the problem?
2. What are the given facts?
3. What formula are you going to use?
4. Write the number sentence.
5. Solve
Let’s Discover!
Let us study the survey form about the favorite pet of 10
pupils.
Pupil Fruit Pupil Fruit
Rey orange Mark orange
Mark apple Jenny orange
Jona apple Rob others
Lika others Cindy others
Arnold apple Kate apple
1. How many pupils
love to eat orange?
Let us count.
2. How many pupils
like apples?
3. How many pupils
like other fruits?
Steps in Collecting Data
1. First, create a question about their favorites.
2. Then, make a survey or ask same set of questions from
different person.
3. Lastly, record your answers or results with tally marks.
FRUITS TALLY NUMBER OF PUPILS
Orange III 3
Apple IIII 4
Others III 3
What do you call the list of fruits made by the pupils?
It is called data. The data gathered is what we called
collection of data.
How can we get information?
By conducting a survey, by asking same set of questions to
different persons and by recording their answers.
Let’s Apply!
A. From the given table below, collect the data about the
favorite color of 15 pupils. Make a tally marks on a
sheet of paper.
Pupil Color Pupil Color
Rey Red Mark Red
Mark Red Jenny Blue
Jona Pink Rob Blue
Lika Pink Cindy Blue
Arnold Pink Kate Blue
Pupil Color
Jane Pink
Joey Blue
Lian Red
Mark Red
Vince Red
Favorite Color
Color Tally
Mark
Number
of Pupils
B. Make a survey about
the favorite sports of your
10 classmates. Make a list
and tally chart on a sheet
of paper
Let’s Explore !
From the tally chart or tabular form, we can also
present this in a form of a bar graph.
Bar graphs are representation of data,
quantities or numbers using bars or strips.
These are used to compare and contrast
numbers, frequencies or other
measures of distinct categories of
data. They have an x-axis (horizontal) and
yaxis (vertical) .
Kinds of Bar Graph
1. Vertical bar graph.
A graph that visually displays data using vertical bars
going up from the bottom, whose lengths are proportional
to quantities they represent. It can be used when one axis
cannot have a numerical scale.
1. What is the title of the bar graph?
2. What information is placed along the horizontal axis?
3. How about on vertical axis?
2. Horizontal bar graphs
Represent the data horizontally. It is a graph whose bars
are drawn horizontally. The data categories are shown on
the vertical axis and the data values are shown on the
horizontal axis. This is an example of horizontal bar graph
1. Which fruit has
the most number?
2. Which fruit has
the least number?
3. What is the
difference between
cherry and
banana?
Let’s Apply!
Construct a vertical bar graph with the given data
below.
Pupil Color Pupil Color
Rey Red Mark Red
Mark Red Jenny Blue
Jona Pink Rob Blue
Lika Pink Cindy Blue
Arnold Pink Kate Blue
Pupil Color
Jane Pink
Joey Blue
Lian Red
Mark Red
Vince Red
Let’s Answer!
Assignment
Create a tally chart and bar graph with the given raw data.
Do this on a sheet of paper.
Favorite Flower
Flower Tally Mark Number of
Pupils

More Related Content

Similar to _Math 4-Q4 Week 5.pptx Steps in Collecting Data

Chapter 4 Problem 31. For problem three in chapter four, a teac.docx
Chapter 4 Problem 31. For problem three in chapter four,   a teac.docxChapter 4 Problem 31. For problem three in chapter four,   a teac.docx
Chapter 4 Problem 31. For problem three in chapter four, a teac.docx
robertad6
 
Grade 2 PPT_Math_Q4_W7.pptx
Grade 2 PPT_Math_Q4_W7.pptxGrade 2 PPT_Math_Q4_W7.pptx
Grade 2 PPT_Math_Q4_W7.pptx
RonaPacibe
 
1.AdvantagesandDisadvantagesofDotPlotsHistogramsandBoxPlotsLesson.pptx
1.AdvantagesandDisadvantagesofDotPlotsHistogramsandBoxPlotsLesson.pptx1.AdvantagesandDisadvantagesofDotPlotsHistogramsandBoxPlotsLesson.pptx
1.AdvantagesandDisadvantagesofDotPlotsHistogramsandBoxPlotsLesson.pptx
AayzazAhmad
 
Mathematics teachers-guide-q-12
Mathematics teachers-guide-q-12Mathematics teachers-guide-q-12
Mathematics teachers-guide-q-12
EDITHA HONRADEZ
 
Class Census
Class CensusClass Census
Class Census
alneale
 
Class Census
Class  CensusClass  Census
Class Census
alneale
 
Class Census
Class CensusClass Census
Class Census
alneale
 
How many-feet-problem-grade-2
How many-feet-problem-grade-2How many-feet-problem-grade-2
How many-feet-problem-grade-2
susan70
 
Math Lesson
Math Lesson Math Lesson
Math Lesson
floralj
 

Similar to _Math 4-Q4 Week 5.pptx Steps in Collecting Data (20)

Frequency table and Bar Graph
Frequency table and Bar GraphFrequency table and Bar Graph
Frequency table and Bar Graph
 
Chapter 4 Problem 31. For problem three in chapter four, a teac.docx
Chapter 4 Problem 31. For problem three in chapter four,   a teac.docxChapter 4 Problem 31. For problem three in chapter four,   a teac.docx
Chapter 4 Problem 31. For problem three in chapter four, a teac.docx
 
GRAPH AND CHARTS
GRAPH AND CHARTSGRAPH AND CHARTS
GRAPH AND CHARTS
 
Grade 2 PPT_Math_Q4_W7.pptx
Grade 2 PPT_Math_Q4_W7.pptxGrade 2 PPT_Math_Q4_W7.pptx
Grade 2 PPT_Math_Q4_W7.pptx
 
Grade 4 math constructing a horizontal bar graph ppt Palma, Elevena T - demo ...
Grade 4 math constructing a horizontal bar graph ppt Palma, Elevena T - demo ...Grade 4 math constructing a horizontal bar graph ppt Palma, Elevena T - demo ...
Grade 4 math constructing a horizontal bar graph ppt Palma, Elevena T - demo ...
 
bodhaditya data handling ppt math23.pdf
bodhaditya data handling ppt math23.pdfbodhaditya data handling ppt math23.pdf
bodhaditya data handling ppt math23.pdf
 
Math 2 Q4 W5.pptxhsjsjdjjdjdnejdjdjdnsndndn
Math 2 Q4 W5.pptxhsjsjdjjdjdnejdjdjdnsndndnMath 2 Q4 W5.pptxhsjsjdjjdjdnejdjdjdnsndndn
Math 2 Q4 W5.pptxhsjsjdjjdjdnejdjdjdnsndndn
 
1.AdvantagesandDisadvantagesofDotPlotsHistogramsandBoxPlotsLesson.pptx
1.AdvantagesandDisadvantagesofDotPlotsHistogramsandBoxPlotsLesson.pptx1.AdvantagesandDisadvantagesofDotPlotsHistogramsandBoxPlotsLesson.pptx
1.AdvantagesandDisadvantagesofDotPlotsHistogramsandBoxPlotsLesson.pptx
 
Mathematics teachers-guide-q-12
Mathematics teachers-guide-q-12Mathematics teachers-guide-q-12
Mathematics teachers-guide-q-12
 
S2U2 MATH PPT (COLLECTING DATA)
S2U2 MATH PPT (COLLECTING DATA)S2U2 MATH PPT (COLLECTING DATA)
S2U2 MATH PPT (COLLECTING DATA)
 
Class Census
Class CensusClass Census
Class Census
 
Class Census
Class  CensusClass  Census
Class Census
 
Class Census
Class CensusClass Census
Class Census
 
ORGANIZING DATA mathematics 7(4th quarter).pptx
ORGANIZING DATA mathematics 7(4th quarter).pptxORGANIZING DATA mathematics 7(4th quarter).pptx
ORGANIZING DATA mathematics 7(4th quarter).pptx
 
How many-feet-problem-grade-2
How many-feet-problem-grade-2How many-feet-problem-grade-2
How many-feet-problem-grade-2
 
Data handling
Data handlingData handling
Data handling
 
VA1160 Class 06
VA1160 Class 06VA1160 Class 06
VA1160 Class 06
 
mathematics 7
mathematics 7mathematics 7
mathematics 7
 
Math Lesson
Math Lesson Math Lesson
Math Lesson
 
Lesson Plan i Mathematics
Lesson Plan i MathematicsLesson Plan i Mathematics
Lesson Plan i Mathematics
 

More from JhengPantaleon (14)

AP 4 Week 5.pptx
AP 4 Week 5.pptxAP 4 Week 5.pptx
AP 4 Week 5.pptx
 
AP 4-Week 7.pptx
AP 4-Week 7.pptxAP 4-Week 7.pptx
AP 4-Week 7.pptx
 
AP 4 WEEK 1 (1).pptx
AP 4 WEEK 1 (1).pptxAP 4 WEEK 1 (1).pptx
AP 4 WEEK 1 (1).pptx
 
AP 4- Week 6.pptx
AP 4- Week 6.pptxAP 4- Week 6.pptx
AP 4- Week 6.pptx
 
AP 4 Week 4.pptx
AP 4 Week 4.pptxAP 4 Week 4.pptx
AP 4 Week 4.pptx
 
AP 4-Week 2.pptx
AP 4-Week 2.pptxAP 4-Week 2.pptx
AP 4-Week 2.pptx
 
AP 4- Week 3.pptx
AP 4- Week 3.pptxAP 4- Week 3.pptx
AP 4- Week 3.pptx
 
Module 4.pptx
Module 4.pptxModule 4.pptx
Module 4.pptx
 
Module 8.pptx
Module 8.pptxModule 8.pptx
Module 8.pptx
 
EPP W5 Q1 ICT.pptx
EPP W5 Q1 ICT.pptxEPP W5 Q1 ICT.pptx
EPP W5 Q1 ICT.pptx
 
EPP ICT WEEK 1 - Copy.pptx
EPP ICT WEEK 1 - Copy.pptxEPP ICT WEEK 1 - Copy.pptx
EPP ICT WEEK 1 - Copy.pptx
 
EPP W5Q1.pptx
EPP W5Q1.pptxEPP W5Q1.pptx
EPP W5Q1.pptx
 
Module 7.pptx
Module 7.pptxModule 7.pptx
Module 7.pptx
 
Module 1 (1).pptx
Module 1 (1).pptxModule 1 (1).pptx
Module 1 (1).pptx
 

Recently uploaded

The basics of sentences session 2pptx copy.pptx
The basics of sentences session 2pptx copy.pptxThe basics of sentences session 2pptx copy.pptx
The basics of sentences session 2pptx copy.pptx
heathfieldcps1
 
Beyond the EU: DORA and NIS 2 Directive's Global Impact
Beyond the EU: DORA and NIS 2 Directive's Global ImpactBeyond the EU: DORA and NIS 2 Directive's Global Impact
Beyond the EU: DORA and NIS 2 Directive's Global Impact
PECB
 
1029-Danh muc Sach Giao Khoa khoi 6.pdf
1029-Danh muc Sach Giao Khoa khoi  6.pdf1029-Danh muc Sach Giao Khoa khoi  6.pdf
1029-Danh muc Sach Giao Khoa khoi 6.pdf
QucHHunhnh
 
Gardella_PRCampaignConclusion Pitch Letter
Gardella_PRCampaignConclusion Pitch LetterGardella_PRCampaignConclusion Pitch Letter
Gardella_PRCampaignConclusion Pitch Letter
MateoGardella
 

Recently uploaded (20)

Mattingly "AI & Prompt Design: The Basics of Prompt Design"
Mattingly "AI & Prompt Design: The Basics of Prompt Design"Mattingly "AI & Prompt Design: The Basics of Prompt Design"
Mattingly "AI & Prompt Design: The Basics of Prompt Design"
 
fourth grading exam for kindergarten in writing
fourth grading exam for kindergarten in writingfourth grading exam for kindergarten in writing
fourth grading exam for kindergarten in writing
 
The basics of sentences session 2pptx copy.pptx
The basics of sentences session 2pptx copy.pptxThe basics of sentences session 2pptx copy.pptx
The basics of sentences session 2pptx copy.pptx
 
Measures of Dispersion and Variability: Range, QD, AD and SD
Measures of Dispersion and Variability: Range, QD, AD and SDMeasures of Dispersion and Variability: Range, QD, AD and SD
Measures of Dispersion and Variability: Range, QD, AD and SD
 
Beyond the EU: DORA and NIS 2 Directive's Global Impact
Beyond the EU: DORA and NIS 2 Directive's Global ImpactBeyond the EU: DORA and NIS 2 Directive's Global Impact
Beyond the EU: DORA and NIS 2 Directive's Global Impact
 
1029-Danh muc Sach Giao Khoa khoi 6.pdf
1029-Danh muc Sach Giao Khoa khoi  6.pdf1029-Danh muc Sach Giao Khoa khoi  6.pdf
1029-Danh muc Sach Giao Khoa khoi 6.pdf
 
Introduction to Nonprofit Accounting: The Basics
Introduction to Nonprofit Accounting: The BasicsIntroduction to Nonprofit Accounting: The Basics
Introduction to Nonprofit Accounting: The Basics
 
Advance Mobile Application Development class 07
Advance Mobile Application Development class 07Advance Mobile Application Development class 07
Advance Mobile Application Development class 07
 
Unit-V; Pricing (Pharma Marketing Management).pptx
Unit-V; Pricing (Pharma Marketing Management).pptxUnit-V; Pricing (Pharma Marketing Management).pptx
Unit-V; Pricing (Pharma Marketing Management).pptx
 
SOCIAL AND HISTORICAL CONTEXT - LFTVD.pptx
SOCIAL AND HISTORICAL CONTEXT - LFTVD.pptxSOCIAL AND HISTORICAL CONTEXT - LFTVD.pptx
SOCIAL AND HISTORICAL CONTEXT - LFTVD.pptx
 
Unit-IV; Professional Sales Representative (PSR).pptx
Unit-IV; Professional Sales Representative (PSR).pptxUnit-IV; Professional Sales Representative (PSR).pptx
Unit-IV; Professional Sales Representative (PSR).pptx
 
Holdier Curriculum Vitae (April 2024).pdf
Holdier Curriculum Vitae (April 2024).pdfHoldier Curriculum Vitae (April 2024).pdf
Holdier Curriculum Vitae (April 2024).pdf
 
Gardella_PRCampaignConclusion Pitch Letter
Gardella_PRCampaignConclusion Pitch LetterGardella_PRCampaignConclusion Pitch Letter
Gardella_PRCampaignConclusion Pitch Letter
 
Paris 2024 Olympic Geographies - an activity
Paris 2024 Olympic Geographies - an activityParis 2024 Olympic Geographies - an activity
Paris 2024 Olympic Geographies - an activity
 
Z Score,T Score, Percential Rank and Box Plot Graph
Z Score,T Score, Percential Rank and Box Plot GraphZ Score,T Score, Percential Rank and Box Plot Graph
Z Score,T Score, Percential Rank and Box Plot Graph
 
PROCESS RECORDING FORMAT.docx
PROCESS      RECORDING        FORMAT.docxPROCESS      RECORDING        FORMAT.docx
PROCESS RECORDING FORMAT.docx
 
Explore beautiful and ugly buildings. Mathematics helps us create beautiful d...
Explore beautiful and ugly buildings. Mathematics helps us create beautiful d...Explore beautiful and ugly buildings. Mathematics helps us create beautiful d...
Explore beautiful and ugly buildings. Mathematics helps us create beautiful d...
 
Mattingly "AI & Prompt Design: Structured Data, Assistants, & RAG"
Mattingly "AI & Prompt Design: Structured Data, Assistants, & RAG"Mattingly "AI & Prompt Design: Structured Data, Assistants, & RAG"
Mattingly "AI & Prompt Design: Structured Data, Assistants, & RAG"
 
Class 11th Physics NEET formula sheet pdf
Class 11th Physics NEET formula sheet pdfClass 11th Physics NEET formula sheet pdf
Class 11th Physics NEET formula sheet pdf
 
Advanced Views - Calendar View in Odoo 17
Advanced Views - Calendar View in Odoo 17Advanced Views - Calendar View in Odoo 17
Advanced Views - Calendar View in Odoo 17
 

_Math 4-Q4 Week 5.pptx Steps in Collecting Data

  • 1. Math 4-Q4 Week 5 Collects data on two variables using any source. M4SP-IVg-1.4 Organizes data in tabular form and presents them in a single/double horizontal or vertical bar graph. M4SP-IVg-2.4
  • 3. A children’s swimming pool is 13 m long, 9 m wide, and 3 m deep. How many cubic meters of water can it hold? 1. What is asked in the problem? 2. What are the given facts? 3. What formula are you going to use? 4. Write the number sentence. 5. Solve
  • 5. Let us study the survey form about the favorite pet of 10 pupils. Pupil Fruit Pupil Fruit Rey orange Mark orange Mark apple Jenny orange Jona apple Rob others Lika others Cindy others Arnold apple Kate apple
  • 6. 1. How many pupils love to eat orange? Let us count. 2. How many pupils like apples? 3. How many pupils like other fruits?
  • 7. Steps in Collecting Data 1. First, create a question about their favorites. 2. Then, make a survey or ask same set of questions from different person. 3. Lastly, record your answers or results with tally marks. FRUITS TALLY NUMBER OF PUPILS Orange III 3 Apple IIII 4 Others III 3
  • 8. What do you call the list of fruits made by the pupils? It is called data. The data gathered is what we called collection of data. How can we get information? By conducting a survey, by asking same set of questions to different persons and by recording their answers.
  • 10. A. From the given table below, collect the data about the favorite color of 15 pupils. Make a tally marks on a sheet of paper. Pupil Color Pupil Color Rey Red Mark Red Mark Red Jenny Blue Jona Pink Rob Blue Lika Pink Cindy Blue Arnold Pink Kate Blue Pupil Color Jane Pink Joey Blue Lian Red Mark Red Vince Red
  • 12. B. Make a survey about the favorite sports of your 10 classmates. Make a list and tally chart on a sheet of paper
  • 14. From the tally chart or tabular form, we can also present this in a form of a bar graph. Bar graphs are representation of data, quantities or numbers using bars or strips. These are used to compare and contrast numbers, frequencies or other measures of distinct categories of data. They have an x-axis (horizontal) and yaxis (vertical) .
  • 15. Kinds of Bar Graph
  • 16. 1. Vertical bar graph. A graph that visually displays data using vertical bars going up from the bottom, whose lengths are proportional to quantities they represent. It can be used when one axis cannot have a numerical scale.
  • 17. 1. What is the title of the bar graph? 2. What information is placed along the horizontal axis? 3. How about on vertical axis?
  • 18. 2. Horizontal bar graphs Represent the data horizontally. It is a graph whose bars are drawn horizontally. The data categories are shown on the vertical axis and the data values are shown on the horizontal axis. This is an example of horizontal bar graph
  • 19. 1. Which fruit has the most number? 2. Which fruit has the least number? 3. What is the difference between cherry and banana?
  • 21. Construct a vertical bar graph with the given data below. Pupil Color Pupil Color Rey Red Mark Red Mark Red Jenny Blue Jona Pink Rob Blue Lika Pink Cindy Blue Arnold Pink Kate Blue Pupil Color Jane Pink Joey Blue Lian Red Mark Red Vince Red
  • 23. Assignment Create a tally chart and bar graph with the given raw data. Do this on a sheet of paper.
  • 24. Favorite Flower Flower Tally Mark Number of Pupils