More Related Content
Similar to April Bucks County Sold Median Price
Similar to April Bucks County Sold Median Price (17)
More from Prudential Fox & Roach, Realtors
More from Prudential Fox & Roach, Realtors (20)
April Bucks County Sold Median Price
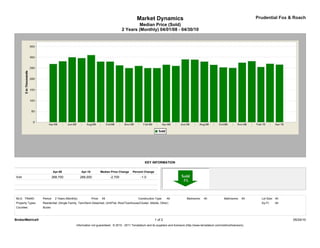
- 1. Market Dynamics Prudential Fox & Roach
Median Price (Sold)
2 Years (Monthly) 04/01/08 - 04/30/10
KEY INFORMATION
Apr-08 Apr-10 Median Price Change Percent Change
Sold 268,700 266,000 -2,700 -1.0
MLS: TReND Period: 2 Years (Monthly) Price: All Construction Type: All Bedrooms: All Bathrooms: All Lot Size: All
Property Types: Residential: (Single Family, Twin/Semi-Detached, Unit/Flat, Row/Townhouse/Cluster, Mobile, Other) Sq Ft: All
Counties: Bucks
BrokerMetrics® 1 of 2 05/24/10
Information not guaranteed. © 2010 - 2011 Terradatum and its suppliers and licensors (http://www.terradatum.com/metrics/licensors).
- 2. Market Dynamics Prudential Fox & Roach
Median Price (Sold)
2 Years (Monthly) 04/01/08 - 04/30/10
FOR SALE UNDER CONTRACT SOLD EXPIRED NEW LISTINGS
Time Period Median $ # Properties Median $ # Properties Median $ # Properties Median $ # Properties Median $ # Properties
Apr-10 339,900 5,093 280,000 809 266,000 536 319,450 384 329,900 1,294
Mar-10 335,000 4,861 282,500 647 270,000 422 339,900 415 309,000 1,223
Feb-10 339,000 4,290 274,900 417 255,000 272 329,900 235 319,900 764
Jan-10 339,000 4,268 296,900 392 282,000 267 344,900 350 314,450 920
Dec-09 349,000 4,124 284,950 278 275,000 368 369,688 498 284,900 404
Nov-09 349,900 4,490 284,900 325 250,750 580 389,000 445 293,700 558
Oct-09 349,900 4,858 272,450 514 253,250 552 369,200 412 299,000 795
Sep-09 349,900 5,096 260,000 569 265,000 509 359,900 464 309,900 951
Aug-09 349,900 5,082 264,900 531 280,000 607 359,945 406 309,900 799
Jul-09 349,900 5,288 279,900 555 289,000 623 349,900 450 309,000 928
Jun-09 349,900 5,404 299,000 634 290,000 603 349,945 410 319,900 970
May-09 349,975 5,327 299,000 535 260,000 425 374,950 358 325,000 990
Apr-09 349,900 5,291 289,000 551 265,500 391 360,000 403 328,500 1,095
Mar-09 349,900 5,050 279,000 471 250,000 363 375,000 383 326,900 1,067
Feb-09 349,900 4,699 258,950 360 250,000 230 349,900 356 327,200 856
Jan-09 349,900 4,562 265,000 293 259,900 228 379,950 426 319,000 827
Dec-08 349,900 4,499 268,900 249 249,950 362 359,900 515 299,900 451
Nov-08 349,900 4,845 259,450 288 262,500 316 395,000 509 299,900 576
Oct-08 349,900 5,180 267,500 317 279,900 435 349,950 594 304,900 857
Sep-08 350,000 5,368 284,900 419 280,000 470 359,888 626 319,900 929
Aug-08 354,900 5,469 290,950 456 310,000 573 359,900 574 319,400 1,014
Jul-08 359,900 5,548 300,000 478 296,000 600 376,500 615 329,900 1,040
Jun-08 359,900 5,724 308,900 589 300,000 621 369,900 627 330,390 1,195
May-08 364,900 5,590 315,000 575 281,250 506 382,250 486 344,900 1,265
Apr-08 364,900 5,392 295,000 591 268,700 480 395,154 476 339,900 1,329
BrokerMetrics® 2 of 2 05/24/10
Information not guaranteed. © 2010 - 2011 Terradatum and its suppliers and licensors (http://www.terradatum.com/metrics/licensors).