More Related Content
Similar to Chester County Sold Median Price
Similar to Chester County Sold Median Price (17)
More from Prudential Fox & Roach, Realtors
More from Prudential Fox & Roach, Realtors (20)
Chester County Sold Median Price
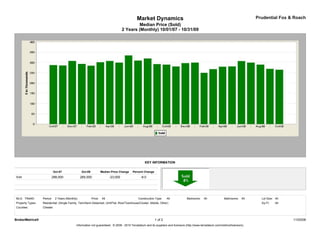
- 1. Market Dynamics Prudential Fox & Roach
Median Price (Sold)
2 Years (Monthly) 10/01/07 - 10/31/09
KEY INFORMATION
Oct-07 Oct-09 Median Price Change Percent Change
Sold 288,000 265,000 -23,000 -8.0
MLS: TReND Period: 2 Years (Monthly) Price: All Construction Type: All Bedrooms: All Bathrooms: All Lot Size: All
Property Types: Residential: (Single Family, Twin/Semi-Detached, Unit/Flat, Row/Townhouse/Cluster, Mobile, Other) Sq Ft: All
Counties: Chester
BrokerMetrics® 1 of 2 11/03/09
Information not guaranteed. © 2009 - 2010 Terradatum and its suppliers and licensors (http://www.terradatum.com/metrics/licensors).
- 2. Market Dynamics Prudential Fox & Roach
Median Price (Sold)
2 Years (Monthly) 10/01/07 - 10/31/09
FOR SALE UNDER CONTRACT SOLD EXPIRED NEW LISTINGS
Time Period Median $ # Properties Median $ # Properties Median $ # Properties Median $ # Properties Median $ # Properties
Oct-09 364,900 4,529 279,900 375 265,000 449 379,900 458 319,900 714
Sep-09 356,750 4,760 269,900 479 269,450 424 348,945 466 319,500 797
Aug-09 352,990 4,835 285,000 449 290,000 506 360,000 423 304,863 797
Jul-09 359,900 4,932 285,000 472 300,000 509 372,494 422 314,950 830
Jun-09 359,900 5,083 304,900 525 307,500 530 364,995 456 324,900 905
May-09 365,000 5,072 325,000 511 281,500 367 394,900 383 349,900 971
Apr-09 359,900 4,894 289,950 420 280,000 317 350,000 373 329,900 1,009
Mar-09 359,000 4,647 299,900 415 268,000 296 344,500 347 339,000 937
Feb-09 354,900 4,357 264,450 320 250,000 239 377,192 327 329,900 751
Jan-09 359,900 4,340 299,900 289 300,000 226 389,000 445 348,900 705
Dec-08 359,900 4,321 299,000 239 297,500 282 370,990 447 334,950 406
Nov-08 359,900 4,595 298,750 245 281,120 300 385,000 435 317,858 518
Oct-08 363,990 4,793 275,000 284 290,000 336 382,804 432 335,000 720
Sep-08 365,000 4,928 300,000 355 292,575 418 370,995 500 349,900 905
Aug-08 364,900 4,864 309,950 364 320,000 522 369,900 477 325,000 702
Jul-08 365,000 5,174 314,700 484 310,000 551 389,900 528 345,000 886
Jun-08 366,900 5,235 317,000 459 335,000 579 385,000 488 349,500 953
May-08 369,900 5,235 339,900 513 299,950 458 379,900 440 349,900 1,113
Apr-08 369,900 5,174 319,899 552 308,000 452 395,175 500 359,900 1,195
Mar-08 364,900 4,866 300,000 475 301,700 361 357,052 412 350,000 1,148
Feb-08 365,450 4,518 329,900 418 285,000 293 388,900 382 349,900 904
Jan-08 365,900 4,477 299,900 379 293,500 264 375,000 484 359,900 981
Dec-07 368,950 4,226 309,900 214 308,245 336 387,000 516 319,898 375
Nov-07 369,900 4,631 289,900 324 286,000 377 384,950 456 339,900 638
Oct-07 365,000 4,921 289,900 368 288,000 423 369,900 560 335,990 989
BrokerMetrics® 2 of 2 11/03/09
Information not guaranteed. © 2009 - 2010 Terradatum and its suppliers and licensors (http://www.terradatum.com/metrics/licensors).