More Related Content
Similar to August 2009 Bucks County Sold Median Price
Similar to August 2009 Bucks County Sold Median Price (17)
More from Prudential Fox & Roach, Realtors
More from Prudential Fox & Roach, Realtors (20)
August 2009 Bucks County Sold Median Price
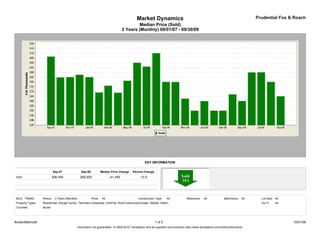
- 1. Market Dynamics Prudential Fox & Roach
Median Price (Sold)
2 Years (Monthly) 09/01/07 - 09/30/09
KEY INFORMATION
Sep-07 Sep-09 Median Price Change Percent Change
Sold 306,450 265,000 -41,450 -13.5
MLS: TReND Period: 2 Years (Monthly) Price: All Construction Type: All Bedrooms: All Bathrooms: All Lot Size: All
Property Types: Residential: (Single Family, Twin/Semi-Detached, Unit/Flat, Row/Townhouse/Cluster, Mobile, Other) Sq Ft: All
Counties: Bucks
BrokerMetrics® 1 of 2 10/01/09
Information not guaranteed. © 2009-2010 Terradatum and its suppliers and licensors (http://www.terradatum.com/metrics/licensors).
- 2. Market Dynamics Prudential Fox & Roach
Median Price (Sold)
2 Years (Monthly) 09/01/07 - 09/30/09
FOR SALE UNDER CONTRACT SOLD EXPIRED NEW LISTINGS
Time Period Median $ # Properties Median $ # Properties Median $ # Properties Median $ # Properties Median $ # Properties
Sep-09 358,000 4,847 249,900 460 265,000 389 353,495 454 324,900 908
Aug-09 350,000 4,917 264,500 529 280,000 601 359,900 449 314,900 788
Jul-09 349,900 5,157 279,900 553 290,000 621 349,900 475 311,220 926
Jun-09 350,000 5,300 297,500 633 289,900 601 349,900 436 324,900 966
May-09 350,000 5,238 299,000 537 260,000 424 369,900 367 325,000 984
Apr-09 349,900 5,224 289,375 552 267,000 393 359,950 418 329,000 1,090
Mar-09 349,900 5,010 279,000 475 250,000 361 375,000 401 329,750 1,067
Feb-09 349,900 4,670 258,900 361 250,000 228 345,308 366 325,000 851
Jan-09 349,900 4,542 265,000 293 259,900 229 380,100 430 319,000 825
Dec-08 349,900 4,486 267,777 251 249,900 363 359,900 518 302,500 450
Nov-08 349,900 4,836 259,900 290 262,500 316 396,558 510 299,900 576
Oct-08 349,900 5,171 267,500 317 279,900 435 349,950 594 309,000 857
Sep-08 349,999 5,360 284,900 419 280,000 470 359,900 627 319,900 929
Aug-08 353,894 5,462 290,950 456 310,000 573 359,900 574 319,400 1,014
Jul-08 359,900 5,539 300,000 478 296,000 600 377,750 614 329,900 1,040
Jun-08 359,900 5,715 308,900 589 300,000 621 369,900 627 330,390 1,195
May-08 364,500 5,609 315,000 575 281,250 506 382,250 486 344,900 1,265
Apr-08 364,900 5,385 295,000 591 268,700 480 395,154 476 339,900 1,329
Mar-08 367,450 4,978 290,000 486 276,000 424 385,900 483 344,900 1,225
Feb-08 366,000 4,717 279,900 477 269,000 349 379,900 474 329,900 1,033
Jan-08 365,000 4,632 282,500 427 285,000 326 359,900 516 339,900 1,212
Dec-07 369,900 4,331 289,700 286 287,500 403 389,920 620 325,000 464
Nov-07 369,900 4,880 299,900 439 285,000 509 389,000 566 338,500 743
Oct-07 366,499 5,297 289,900 507 284,750 512 377,000 648 339,900 1,081
Sep-07 367,950 5,262 295,000 425 306,450 518 379,000 621 349,000 1,216
BrokerMetrics® 2 of 2 10/01/09
Information not guaranteed. © 2009-2010 Terradatum and its suppliers and licensors (http://www.terradatum.com/metrics/licensors).