More Related Content
Similar to June 2010 Delaware County Sold Median Price
Similar to June 2010 Delaware County Sold Median Price (19)
More from Prudential Fox & Roach, Realtors
More from Prudential Fox & Roach, Realtors (20)
June 2010 Delaware County Sold Median Price
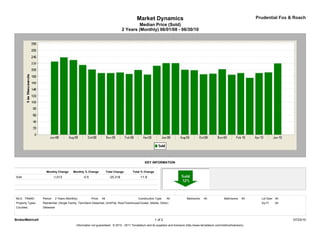
- 1. Market Dynamics Prudential Fox & Roach
Median Price (Sold)
2 Years (Monthly) 06/01/08 - 06/30/10
KEY INFORMATION
Monthly Change Monthly % Change Total Change Total % Change
Sold -1,013 -0.5 -25,318 -11.8
MLS: TReND Period: 2 Years (Monthly) Price: All Construction Type: All Bedrooms: All Bathrooms: All Lot Size: All
Property Types: Residential: (Single Family, Twin/Semi-Detached, Unit/Flat, Row/Townhouse/Cluster, Mobile, Other) Sq Ft: All
Counties: Delaware
BrokerMetrics® 1 of 2 07/23/10
Information not guaranteed. © 2010 - 2011 Terradatum and its suppliers and licensors (http://www.terradatum.com/metrics/licensors).
- 2. Market Dynamics Prudential Fox & Roach
Median Price (Sold)
2 Years (Monthly) 06/01/08 - 06/30/10
FOR SALE UNDER CONTRACT SOLD EXPIRED NEW LISTINGS
Time Period Median $ # Properties Median $ # Properties Median $ # Properties Median $ # Properties Median $ # Properties
Jun-10 219,900 4,443 215,900 341 219,500 771 219,900 442 224,900 828
May-10 219,800 4,319 219,900 321 192,000 516 214,900 383 210,500 818
Apr-10 214,900 4,646 189,900 788 190,000 470 219,000 357 219,900 1,220
Mar-10 210,000 4,411 209,000 657 175,000 377 179,900 328 217,500 1,176
Feb-10 199,994 3,894 189,900 365 190,000 237 199,000 294 212,500 711
Jan-10 199,900 3,810 199,900 343 185,000 250 219,900 284 189,900 773
Dec-09 199,900 3,728 199,900 255 202,000 335 176,450 436 174,900 409
Nov-09 209,900 3,942 210,000 315 188,000 577 215,000 308 180,950 554
Oct-09 214,900 4,225 199,900 507 186,000 515 232,400 330 198,000 742
Sep-09 215,000 4,356 194,900 512 198,500 431 223,900 361 199,999 901
Aug-09 216,700 4,234 209,995 471 199,900 514 209,950 308 179,900 733
Jul-09 224,900 4,299 201,250 476 220,000 570 254,400 322 209,000 789
Jun-09 224,900 4,338 199,900 495 220,000 569 227,000 333 214,900 747
May-09 225,000 4,441 224,950 552 212,000 403 229,900 298 221,450 826
Apr-09 228,800 4,402 219,900 497 185,450 360 246,950 290 229,064 956
Mar-09 225,000 4,144 224,900 413 198,900 337 219,500 285 225,000 871
Feb-09 224,900 3,910 199,919 393 187,000 233 224,950 244 229,900 739
Jan-09 219,900 3,846 189,900 316 191,500 236 224,900 359 199,900 640
Dec-08 224,000 3,869 199,900 252 190,000 355 224,900 411 175,000 399
Nov-08 225,000 4,109 189,900 259 190,000 286 227,000 380 205,000 505
Oct-08 225,000 4,329 206,700 309 200,950 400 229,950 416 218,900 707
Sep-08 225,000 4,482 190,000 367 215,000 413 225,000 493 224,900 937
Aug-08 224,900 4,299 209,950 386 229,950 513 218,450 368 199,900 739
Jul-08 229,900 4,419 219,900 457 238,000 503 235,000 402 219,395 912
Jun-08 235,445 4,458 237,500 495 225,000 594 249,900 456 224,900 993
BrokerMetrics® 2 of 2 07/23/10
Information not guaranteed. © 2010 - 2011 Terradatum and its suppliers and licensors (http://www.terradatum.com/metrics/licensors).