More Related Content
Similar to December 2009 Montgomery County Sold Median Price
Similar to December 2009 Montgomery County Sold Median Price (19)
More from Prudential Fox & Roach, Realtors
More from Prudential Fox & Roach, Realtors (20)
December 2009 Montgomery County Sold Median Price
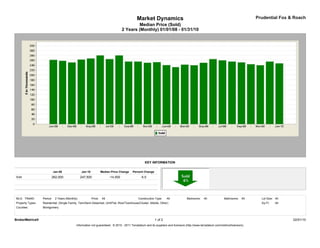
- 1. Market Dynamics Prudential Fox & Roach
Median Price (Sold)
2 Years (Monthly) 01/01/08 - 01/31/10
KEY INFORMATION
Jan-08 Jan-10 Median Price Change Percent Change
Sold 262,000 247,500 -14,500 -5.5
MLS: TReND Period: 2 Years (Monthly) Price: All Construction Type: All Bedrooms: All Bathrooms: All Lot Size: All
Property Types: Residential: (Single Family, Twin/Semi-Detached, Unit/Flat, Row/Townhouse/Cluster, Mobile, Other) Sq Ft: All
Counties: Montgomery
BrokerMetrics® 1 of 2 02/01/10
Information not guaranteed. © 2010 - 2011 Terradatum and its suppliers and licensors (http://www.terradatum.com/metrics/licensors).
- 2. Market Dynamics Prudential Fox & Roach
Median Price (Sold)
2 Years (Monthly) 01/01/08 - 01/31/10
FOR SALE UNDER CONTRACT SOLD EXPIRED NEW LISTINGS
Time Period Median $ # Properties Median $ # Properties Median $ # Properties Median $ # Properties Median $ # Properties
Jan-10 293,950 5,462 265,000 400 247,500 337 299,900 563 279,900 1,154
Dec-09 295,770 5,406 249,900 393 255,000 526 319,000 705 260,000 568
Nov-09 299,775 5,900 264,900 466 240,000 872 338,495 596 269,990 889
Oct-09 299,775 6,352 254,900 746 244,000 781 317,000 595 269,900 1,112
Sep-09 299,900 6,582 249,900 762 251,500 733 329,900 580 280,950 1,286
Aug-09 299,000 6,633 250,000 765 255,000 815 328,375 572 264,900 1,149
Jul-09 299,900 6,767 249,900 756 260,000 849 331,900 527 269,950 1,222
Jun-09 299,900 6,943 264,900 818 265,000 873 316,550 580 279,900 1,313
May-09 299,900 6,931 275,000 811 249,900 647 319,900 490 279,900 1,304
Apr-09 299,900 6,925 265,000 767 239,900 513 309,900 531 282,700 1,468
Mar-09 299,900 6,647 257,950 658 242,250 462 334,900 532 279,900 1,460
Feb-09 300,000 6,212 249,900 528 232,200 366 364,900 497 297,900 1,205
Jan-09 299,900 6,159 244,900 444 240,500 311 309,945 708 279,900 1,115
Dec-08 300,000 6,019 239,900 359 252,500 498 329,900 616 259,900 558
Nov-08 300,000 6,461 264,900 384 250,000 484 308,375 616 269,994 757
Oct-08 309,000 6,887 259,220 460 255,000 602 319,900 723 275,000 1,071
Sep-08 309,900 7,094 264,800 573 255,000 661 323,302 705 299,900 1,339
Aug-08 304,900 7,033 256,100 604 279,900 793 320,000 674 279,900 1,136
Jul-08 309,900 7,355 275,000 713 265,000 837 329,900 745 287,375 1,436
Jun-08 310,000 7,425 274,950 768 280,000 928 329,374 738 293,396 1,528
May-08 314,800 7,374 279,900 816 267,500 805 329,000 661 299,900 1,674
Apr-08 314,900 7,211 284,900 876 263,000 687 324,900 635 300,000 1,818
Mar-08 312,050 6,850 279,900 813 251,300 632 325,000 644 299,900 1,629
Feb-08 312,490 6,472 269,900 673 258,000 494 340,500 578 307,200 1,510
Jan-08 309,900 6,321 265,000 639 262,000 485 324,950 720 299,250 1,546
BrokerMetrics® 2 of 2 02/01/10
Information not guaranteed. © 2010 - 2011 Terradatum and its suppliers and licensors (http://www.terradatum.com/metrics/licensors).