More Related Content
Similar to Bucks County Sold Average vs Median Price
Similar to Bucks County Sold Average vs Median Price (20)
More from Prudential Fox & Roach, Realtors
More from Prudential Fox & Roach, Realtors (20)
Bucks County Sold Average vs Median Price
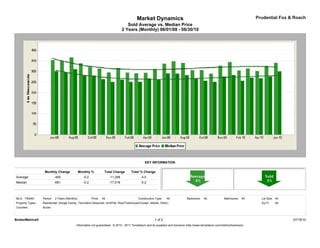
- 1. Market Dynamics Prudential Fox & Roach
Sold Average vs. Median Price
2 Years (Monthly) 06/01/08 - 06/30/10
KEY INFORMATION
Monthly Change Monthly % Total Change Total % Change
Average -450 -0.2 -11,258 -4.0
Median -681 -0.2 -17,018 -5.2
MLS: TReND Period: 2 Years (Monthly) Price: All Construction Type: All Bedrooms: All Bathrooms: All Lot Size: All
Property Types: Residential: (Single Family, Twin/Semi-Detached, Unit/Flat, Row/Townhouse/Cluster, Mobile, Other) Sq Ft: All
Counties: Bucks
BrokerMetrics® 1 of 2 07/19/10
Information not guaranteed. © 2010 - 2011 Terradatum and its suppliers and licensors (http://www.terradatum.com/metrics/licensors).
- 2. Market Dynamics Prudential Fox & Roach
Sold Average vs. Median Price
2 Years (Monthly) 06/01/08 - 06/30/10
Time Period # Properties Sold Sold Average $ Sold Median $ Average $ - Median $ Median $ as % of Average $ Sold Avg DOM
Jun-10 756 339,682 299,075 40,607 88.0 71
May-10 543 325,440 274,900 50,540 84.5 89
Apr-10 542 300,621 266,000 34,621 88.5 82
Mar-10 425 312,596 270,000 42,596 86.4 103
Feb-10 272 303,879 255,000 48,879 83.9 101
Jan-10 268 343,498 282,000 61,498 82.1 97
Dec-09 369 325,973 275,000 50,973 84.4 92
Nov-09 579 288,395 250,000 38,395 86.7 85
Oct-09 551 305,185 255,000 50,185 83.6 88
Sep-09 509 304,864 265,000 39,864 86.9 86
Aug-09 608 339,041 281,250 57,791 83.0 85
Jul-09 623 346,792 289,000 57,792 83.3 80
Jun-09 602 336,263 290,000 46,263 86.2 87
May-09 425 310,932 260,000 50,932 83.6 90
Apr-09 391 292,351 265,500 26,851 90.8 97
Mar-09 363 290,798 250,000 40,798 86.0 92
Feb-09 230 293,456 250,000 43,456 85.2 98
Jan-09 228 315,594 259,900 55,694 82.4 92
Dec-08 363 294,302 250,000 44,302 85.0 91
Nov-08 317 312,172 262,500 49,672 84.1 75
Oct-08 448 320,682 279,450 41,232 87.1 68
Sep-08 457 337,280 280,000 57,280 83.0 70
Aug-08 573 365,364 310,000 55,364 84.8 66
Jul-08 600 347,940 296,000 51,940 85.1 68
Jun-08 621 352,935 300,000 52,935 85.0 64
BrokerMetrics® 2 of 2 07/19/10
Information not guaranteed. © 2010 - 2011 Terradatum and its suppliers and licensors (http://www.terradatum.com/metrics/licensors).