More Related Content
Similar to July 2009 Bucks County Sold Median Price
Similar to July 2009 Bucks County Sold Median Price (17)
More from Prudential Fox & Roach, Realtors
More from Prudential Fox & Roach, Realtors (20)
July 2009 Bucks County Sold Median Price
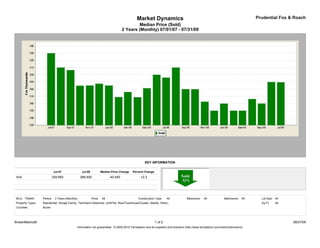
- 1. Market Dynamics Prudential Fox & Roach
Median Price (Sold)
2 Years (Monthly) 07/01/07 - 07/31/09
KEY INFORMATION
Jul-07 Jul-09 Median Price Change Percent Change
Sold 329,950 289,500 -40,450 -12.3
MLS: TReND Period: 2 Years (Monthly) Price: All Construction Type: All Bedrooms: All Bathrooms: All Lot Size: All
Property Types: Residential: (Single Family, Twin/Semi-Detached, Unit/Flat, Row/Townhouse/Cluster, Mobile, Other) Sq Ft: All
Counties: Bucks
BrokerMetrics® 1 of 2 08/27/09
Information not guaranteed. © 2009-2010 Terradatum and its suppliers and licensors (http://www.terradatum.com/metrics/licensors).
- 2. Market Dynamics Prudential Fox & Roach
Median Price (Sold)
2 Years (Monthly) 07/01/07 - 07/31/09
FOR SALE UNDER CONTRACT SOLD EXPIRED NEW LISTINGS
Time Period Median $ # Properties Median $ # Properties Median $ # Properties Median $ # Properties Median $ # Properties
Jul-09 350,000 5,108 279,900 546 289,500 620 349,900 487 319,000 923
Jun-09 354,900 5,263 298,250 632 289,900 599 348,586 446 324,945 964
May-09 353,900 5,207 297,200 534 260,000 425 367,400 374 326,250 984
Apr-09 349,975 5,199 289,000 551 266,250 392 360,000 425 329,000 1,089
Mar-09 349,900 4,991 279,000 476 250,000 362 375,000 405 329,825 1,066
Feb-09 349,900 4,654 258,900 361 250,000 227 341,900 368 325,000 851
Jan-09 349,900 4,528 267,000 294 259,900 230 380,200 431 319,900 825
Dec-08 349,900 4,478 267,777 251 249,950 364 359,450 524 302,500 450
Nov-08 349,900 4,831 259,900 291 262,500 316 398,558 512 299,900 576
Oct-08 349,900 5,169 267,500 317 279,900 434 350,000 597 309,900 857
Sep-08 349,999 5,360 284,900 420 280,000 470 359,888 628 319,900 929
Aug-08 354,900 5,461 290,950 456 310,000 574 359,900 573 319,400 1,014
Jul-08 359,900 5,538 300,000 478 296,000 600 377,750 614 329,900 1,040
Jun-08 359,900 5,714 308,900 589 300,000 621 369,900 627 332,500 1,195
May-08 364,500 5,608 315,000 575 281,250 506 382,250 486 344,900 1,265
Apr-08 364,900 5,385 295,000 592 268,700 480 395,154 476 339,900 1,329
Mar-08 367,450 4,978 290,000 486 276,000 424 385,900 483 344,900 1,225
Feb-08 366,000 4,717 279,900 477 269,000 349 379,900 474 329,900 1,033
Jan-08 365,000 4,632 282,500 427 285,000 326 359,900 516 339,900 1,212
Dec-07 369,900 4,331 289,700 286 287,500 403 389,920 620 325,000 464
Nov-07 369,900 4,880 299,900 439 285,000 509 389,000 566 338,500 743
Oct-07 366,499 5,297 289,900 507 284,750 512 377,000 648 339,900 1,081
Sep-07 367,950 5,262 295,000 425 306,450 518 379,000 621 349,000 1,216
Aug-07 365,000 5,151 299,900 531 310,000 755 374,475 572 338,360 1,114
Jul-07 364,950 5,204 309,900 615 329,950 738 379,900 550 334,900 1,174
BrokerMetrics® 2 of 2 08/27/09
Information not guaranteed. © 2009-2010 Terradatum and its suppliers and licensors (http://www.terradatum.com/metrics/licensors).