More Related Content
Similar to July 2010 Bucks County Sold Median Price
Similar to July 2010 Bucks County Sold Median Price (16)
More from Prudential Fox & Roach, Realtors
More from Prudential Fox & Roach, Realtors (20)
July 2010 Bucks County Sold Median Price
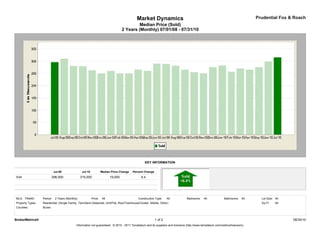
- 1. Market Dynamics Prudential Fox & Roach
Median Price (Sold)
2 Years (Monthly) 07/01/08 - 07/31/10
KEY INFORMATION
Jul-08 Jul-10 Median Price Change Percent Change
Sold 296,000 315,000 19,000 6.4
MLS: TReND Period: 2 Years (Monthly) Price: All Construction Type: All Bedrooms: All Bathrooms: All Lot Size: All
Property Types: Residential: (Single Family, Twin/Semi-Detached, Unit/Flat, Row/Townhouse/Cluster, Mobile, Other) Sq Ft: All
Counties: Bucks
BrokerMetrics® 1 of 2 08/30/10
Information not guaranteed. © 2010 - 2011 Terradatum and its suppliers and licensors (http://www.terradatum.com/metrics/licensors).
- 2. Market Dynamics Prudential Fox & Roach
Median Price (Sold)
2 Years (Monthly) 07/01/08 - 07/31/10
FOR SALE UNDER CONTRACT SOLD EXPIRED NEW LISTINGS
Time Period Median $ # Properties Median $ # Properties Median $ # Properties Median $ # Properties Median $ # Properties
Jul-10 330,000 5,022 299,900 420 315,000 433 344,000 447 299,900 822
Jun-10 337,323 5,052 312,450 422 298,125 762 334,670 430 314,888 945
May-10 339,900 4,851 334,400 404 275,000 543 332,400 340 324,900 926
Apr-10 334,900 5,065 285,000 797 265,000 543 329,900 343 320,000 1,293
Mar-10 329,900 4,816 284,900 654 270,000 422 339,900 390 299,900 1,229
Feb-10 334,900 4,219 274,900 412 257,000 275 327,450 220 314,900 764
Jan-10 335,000 4,191 296,900 394 282,200 270 349,900 342 310,000 922
Dec-09 345,450 4,040 284,950 278 275,000 369 369,875 493 284,000 403
Nov-09 349,900 4,400 284,900 325 250,000 579 389,000 438 289,900 558
Oct-09 349,900 4,763 272,450 514 255,000 551 369,000 407 299,000 795
Sep-09 349,900 4,991 260,000 566 265,000 509 359,900 457 309,910 950
Aug-09 349,900 4,974 264,950 530 281,250 608 360,000 403 309,900 799
Jul-09 349,900 5,175 279,900 554 289,000 623 349,900 446 308,950 928
Jun-09 349,900 5,290 299,000 634 290,000 601 349,900 409 319,900 968
May-09 349,900 5,212 299,000 533 260,000 425 375,000 357 325,000 986
Apr-09 349,900 5,176 289,000 551 265,500 391 359,900 399 329,000 1,091
Mar-09 349,900 4,940 279,450 470 250,000 363 375,000 385 328,995 1,062
Feb-09 349,500 4,596 259,000 359 250,000 230 349,900 359 327,250 854
Jan-09 349,900 4,461 265,000 293 259,900 228 379,950 426 319,000 825
Dec-08 349,900 4,400 268,900 249 250,000 363 359,900 515 299,900 450
Nov-08 349,900 4,746 259,900 290 262,500 317 399,000 506 299,900 575
Oct-08 349,900 5,066 259,975 324 279,450 448 349,900 571 300,000 853
Sep-08 349,985 5,268 285,000 416 280,000 457 360,000 639 319,900 919
Aug-08 354,900 5,371 293,900 460 310,000 573 364,900 562 318,000 1,020
Jul-08 359,900 5,410 300,000 475 296,000 600 375,000 584 329,998 1,056
BrokerMetrics® 2 of 2 08/30/10
Information not guaranteed. © 2010 - 2011 Terradatum and its suppliers and licensors (http://www.terradatum.com/metrics/licensors).