More Related Content
Similar to Montgomery county sold median price
Similar to Montgomery county sold median price (16)
More from Prudential Fox & Roach, Realtors
More from Prudential Fox & Roach, Realtors (20)
Montgomery county sold median price
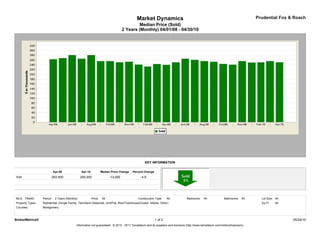
- 1. Market Dynamics Prudential Fox & Roach
Median Price (Sold)
2 Years (Monthly) 04/01/08 - 04/30/10
KEY INFORMATION
Apr-08 Apr-10 Median Price Change Percent Change
Sold 263,000 250,000 -13,000 -4.9
MLS: TReND Period: 2 Years (Monthly) Price: All Construction Type: All Bedrooms: All Bathrooms: All Lot Size: All
Property Types: Residential: (Single Family, Twin/Semi-Detached, Unit/Flat, Row/Townhouse/Cluster, Mobile, Other) Sq Ft: All
Counties: Montgomery
BrokerMetrics® 1 of 2 05/24/10
Information not guaranteed. © 2010 - 2011 Terradatum and its suppliers and licensors (http://www.terradatum.com/metrics/licensors).
- 2. Market Dynamics Prudential Fox & Roach
Median Price (Sold)
2 Years (Monthly) 04/01/08 - 04/30/10
FOR SALE UNDER CONTRACT SOLD EXPIRED NEW LISTINGS
Time Period Median $ # Properties Median $ # Properties Median $ # Properties Median $ # Properties Median $ # Properties
Apr-10 294,000 6,816 259,950 1,126 250,000 745 282,250 446 299,512 1,778
Mar-10 289,220 6,466 264,900 952 255,000 580 322,900 476 277,050 1,752
Feb-10 289,900 5,692 261,450 574 249,950 356 289,900 404 284,900 1,066
Jan-10 289,000 5,713 269,900 573 248,950 358 302,455 514 269,900 1,224
Dec-09 290,000 5,552 249,900 393 255,000 534 319,432 670 259,000 576
Nov-09 298,800 6,015 265,000 468 240,000 873 339,900 571 269,925 892
Oct-09 299,000 6,445 256,900 745 243,000 785 319,000 577 269,900 1,118
Sep-09 299,000 6,653 249,900 760 252,000 735 334,900 566 279,900 1,296
Aug-09 297,000 6,681 250,000 763 255,000 817 329,900 561 264,900 1,150
Jul-09 299,500 6,802 249,925 756 260,000 852 330,900 515 270,000 1,223
Jun-09 299,900 6,972 264,900 817 265,000 873 317,250 576 279,840 1,314
May-09 299,900 6,950 275,000 810 249,900 647 314,950 482 279,900 1,306
Apr-09 299,900 6,937 265,000 769 239,450 512 309,950 524 282,500 1,470
Mar-09 299,900 6,651 259,450 656 242,500 463 334,900 528 279,900 1,461
Feb-09 299,990 6,217 249,900 531 232,200 366 364,900 496 295,500 1,208
Jan-09 299,900 6,161 244,900 444 240,500 311 309,945 708 279,900 1,115
Dec-08 300,000 6,020 239,900 359 252,500 498 329,900 615 259,900 558
Nov-08 300,000 6,462 264,900 384 250,000 484 308,375 616 269,994 757
Oct-08 309,000 6,887 259,220 460 255,000 602 319,900 722 275,000 1,071
Sep-08 309,900 7,094 264,800 573 255,000 661 323,302 705 299,900 1,339
Aug-08 304,900 7,033 256,100 604 279,900 793 320,000 674 279,900 1,136
Jul-08 309,900 7,355 275,000 713 265,000 837 329,900 745 287,375 1,436
Jun-08 310,000 7,425 274,950 768 280,000 928 329,374 738 293,396 1,528
May-08 314,800 7,374 279,900 816 267,500 805 329,000 661 299,900 1,674
Apr-08 314,900 7,212 284,900 876 263,000 687 324,950 636 300,000 1,818
BrokerMetrics® 2 of 2 05/24/10
Information not guaranteed. © 2010 - 2011 Terradatum and its suppliers and licensors (http://www.terradatum.com/metrics/licensors).