More Related Content
Similar to Delaware county msi and avg dom
Similar to Delaware county msi and avg dom (18)
More from Prudential Fox & Roach, Realtors
More from Prudential Fox & Roach, Realtors (20)
Delaware county msi and avg dom
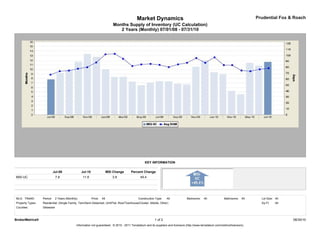
- 1. Market Dynamics Prudential Fox & Roach
Months Supply of Inventory (UC Calculation)
2 Years (Monthly) 07/01/08 - 07/31/10
KEY INFORMATION
Jul-08 Jul-10 MSI Change Percent Change
MSI-UC 7.8 11.6 3.8 49.4
MLS: TReND Period: 2 Years (Monthly) Price: All Construction Type: All Bedrooms: All Bathrooms: All Lot Size: All
Property Types: Residential: (Single Family, Twin/Semi-Detached, Unit/Flat, Row/Townhouse/Cluster, Mobile, Other) Sq Ft: All
Counties: Delaware
BrokerMetrics® 1 of 2 08/30/10
Information not guaranteed. © 2010 - 2011 Terradatum and its suppliers and licensors (http://www.terradatum.com/metrics/licensors).
- 2. Market Dynamics Prudential Fox & Roach
Months Supply of Inventory (UC Calculation)
2 Years (Monthly) 07/01/08 - 07/31/10
Time # For Sale Last # Under
Period MSI NAR MSI Day of Month Contract # Sold
Jul-10 11.6 12.4 3,805 327 307
Jun-10 10.8 4.8 3,718 344 773
May-10 11.4 7.1 3,663 320 519
Apr-10 4.5 7.5 3,538 783 471
Mar-10 5.2 9.1 3,452 658 381
Feb-10 8.9 13.7 3,251 364 237
Jan-10 9.3 12.8 3,196 342 250
Dec-09 11.9 9.1 3,047 255 335
Nov-09 10.6 5.8 3,328 315 577
Oct-09 6.7 6.6 3,397 507 515
Sep-09 6.8 8.1 3,491 511 431
Aug-09 7.4 6.7 3,460 470 514
Jul-09 7.4 6.1 3,503 475 570
Jun-09 7.1 6.2 3,510 495 569
May-09 6.5 8.9 3,592 552 403
Apr-09 7.3 10.0 3,616 496 360
Mar-09 8.3 10.2 3,446 413 337
Feb-09 8.3 14.0 3,273 393 234
Jan-09 10.0 13.4 3,171 316 236
Dec-08 12.7 9.0 3,206 252 356
Nov-08 13.4 12.1 3,470 259 286
Oct-08 11.7 9.0 3,604 309 400
Sep-08 9.9 8.8 3,622 367 413
Aug-08 9.2 6.9 3,545 386 513
Jul-08 7.8 7.1 3,560 457 503
BrokerMetrics® 2 of 2 08/30/10
Information not guaranteed. © 2010 - 2011 Terradatum and its suppliers and licensors (http://www.terradatum.com/metrics/licensors).