More Related Content
Similar to July 2009 Chester County Sold Median Price
Similar to July 2009 Chester County Sold Median Price (18)
More from Prudential Fox & Roach, Realtors
More from Prudential Fox & Roach, Realtors (20)
July 2009 Chester County Sold Median Price
- 1. Market Dynamics Prudential Fox & Roach
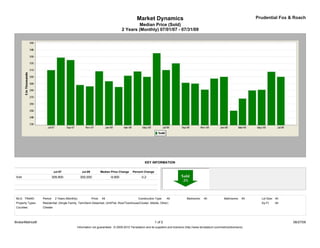
Median Price (Sold)
2 Years (Monthly) 07/01/07 - 07/31/09
KEY INFORMATION
Jul-07 Jul-09 Median Price Change Percent Change
Sold 309,900 300,000 -9,900 -3.2
MLS: TReND Period: 2 Years (Monthly) Price: All Construction Type: All Bedrooms: All Bathrooms: All Lot Size: All
Property Types: Residential: (Single Family, Twin/Semi-Detached, Unit/Flat, Row/Townhouse/Cluster, Mobile, Other) Sq Ft: All
Counties: Chester
BrokerMetrics® 1 of 2 08/27/09
Information not guaranteed. © 2009-2010 Terradatum and its suppliers and licensors (http://www.terradatum.com/metrics/licensors).
- 2. Market Dynamics Prudential Fox & Roach
Median Price (Sold)
2 Years (Monthly) 07/01/07 - 07/31/09
FOR SALE UNDER CONTRACT SOLD EXPIRED NEW LISTINGS
Time Period Median $ # Properties Median $ # Properties Median $ # Properties Median $ # Properties Median $ # Properties
Jul-09 360,995 4,840 280,394 467 300,000 504 364,900 439 323,000 821
Jun-09 362,900 5,011 309,950 526 307,500 530 363,950 466 325,000 897
May-09 368,000 5,009 325,000 507 281,000 363 393,700 388 349,950 968
Apr-09 359,900 4,844 289,450 416 280,000 317 350,000 387 329,900 1,005
Mar-09 359,900 4,606 299,450 416 268,000 295 344,500 351 339,900 932
Feb-09 355,000 4,327 265,000 321 250,000 240 375,000 332 329,900 751
Jan-09 359,900 4,310 299,900 288 300,000 225 389,000 446 349,900 698
Dec-08 359,900 4,305 294,500 240 297,500 282 369,900 453 335,000 406
Nov-08 359,900 4,582 297,375 244 281,120 300 387,794 439 318,500 517
Oct-08 363,700 4,782 275,000 284 290,000 335 385,448 433 335,000 720
Sep-08 365,000 4,921 304,900 357 291,250 419 369,950 502 349,900 903
Aug-08 364,900 4,861 309,900 365 320,000 522 369,900 478 325,000 704
Jul-08 365,000 5,169 314,700 484 310,000 551 389,900 528 349,700 886
Jun-08 366,700 5,231 316,970 460 335,000 579 385,000 488 349,500 953
May-08 369,000 5,287 339,900 513 299,950 458 379,900 440 349,900 1,113
Apr-08 369,900 5,186 319,899 552 308,000 452 395,175 500 359,900 1,195
Mar-08 364,900 4,829 300,750 476 301,700 361 357,052 412 350,000 1,148
Feb-08 365,000 4,486 329,900 418 285,000 293 388,900 382 349,900 904
Jan-08 365,000 4,454 299,900 379 293,500 264 375,000 484 359,900 981
Dec-07 368,200 4,206 309,900 214 308,245 336 387,000 516 319,898 375
Nov-07 369,900 4,615 289,900 324 286,000 377 384,950 456 339,900 638
Oct-07 365,000 4,905 289,900 368 288,000 423 369,900 559 335,945 988
Sep-07 369,000 4,824 299,900 367 324,900 415 384,000 535 349,900 983
Aug-07 369,900 4,783 325,000 418 328,450 662 375,000 521 344,900 911
Jul-07 374,900 4,883 329,900 518 309,900 587 419,450 490 349,000 935
BrokerMetrics® 2 of 2 08/27/09
Information not guaranteed. © 2009-2010 Terradatum and its suppliers and licensors (http://www.terradatum.com/metrics/licensors).