More Related Content
Similar to Montgomery County Sold Median Price
Similar to Montgomery County Sold Median Price (20)
More from Prudential Fox & Roach, Realtors
More from Prudential Fox & Roach, Realtors (20)
Montgomery County Sold Median Price
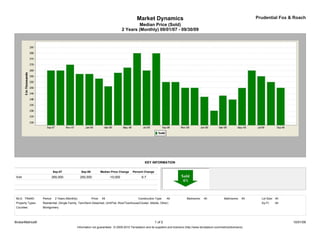
- 1. Market Dynamics Prudential Fox & Roach
Median Price (Sold)
2 Years (Monthly) 09/01/07 - 09/30/09
KEY INFORMATION
Sep-07 Sep-09 Median Price Change Percent Change
Sold 265,000 250,000 -15,000 -5.7
MLS: TReND Period: 2 Years (Monthly) Price: All Construction Type: All Bedrooms: All Bathrooms: All Lot Size: All
Property Types: Residential: (Single Family, Twin/Semi-Detached, Unit/Flat, Row/Townhouse/Cluster, Mobile, Other) Sq Ft: All
Counties: Montgomery
BrokerMetrics® 1 of 2 10/01/09
Information not guaranteed. © 2009-2010 Terradatum and its suppliers and licensors (http://www.terradatum.com/metrics/licensors).
- 2. Market Dynamics Prudential Fox & Roach
Median Price (Sold)
2 Years (Monthly) 09/01/07 - 09/30/09
FOR SALE UNDER CONTRACT SOLD EXPIRED NEW LISTINGS
Time Period Median $ # Properties Median $ # Properties Median $ # Properties Median $ # Properties Median $ # Properties
Sep-09 299,999 6,262 243,950 544 250,000 585 324,900 579 287,500 1,223
Aug-09 299,900 6,411 249,900 748 255,000 815 325,000 624 269,900 1,144
Jul-09 299,900 6,579 249,900 766 260,000 850 330,000 546 274,900 1,219
Jun-09 299,900 6,778 264,900 822 265,000 872 315,450 596 279,900 1,309
May-09 299,900 6,790 275,000 813 249,900 648 310,000 508 280,950 1,300
Apr-09 299,900 6,820 265,000 773 239,900 511 309,000 557 284,900 1,464
Mar-09 299,900 6,588 259,900 663 243,250 462 330,000 569 279,900 1,458
Feb-09 300,000 6,160 249,900 530 230,200 368 363,930 500 297,900 1,205
Jan-09 299,900 6,112 244,900 446 242,250 310 309,990 711 279,900 1,113
Dec-08 300,000 5,975 239,900 360 250,000 498 329,700 616 259,900 549
Nov-08 301,945 6,430 264,900 385 250,000 484 309,800 619 274,500 747
Oct-08 309,000 6,869 259,440 463 255,000 602 319,900 723 277,900 1,067
Sep-08 309,900 7,081 264,825 574 255,000 661 323,302 705 299,900 1,339
Aug-08 304,900 7,020 256,100 604 279,900 793 320,000 674 279,900 1,136
Jul-08 309,900 7,342 275,000 713 265,000 837 329,900 745 287,375 1,436
Jun-08 310,000 7,413 275,000 769 280,000 928 329,374 738 293,396 1,528
May-08 311,400 7,454 279,900 818 267,500 805 329,000 661 299,900 1,674
Apr-08 314,470 7,248 284,900 876 263,000 687 324,900 635 300,000 1,818
Mar-08 310,900 6,792 279,900 813 251,300 632 325,000 643 299,900 1,629
Feb-08 310,945 6,408 269,900 673 258,000 494 340,500 578 307,200 1,510
Jan-08 309,500 6,261 265,000 639 262,000 485 324,950 720 299,250 1,546
Dec-07 305,000 5,918 269,900 448 262,000 601 300,000 743 274,900 636
Nov-07 309,750 6,571 266,250 562 270,000 693 323,900 719 279,900 1,030
Oct-07 310,000 7,119 264,900 698 265,000 746 325,000 876 298,950 1,538
Sep-07 314,900 6,926 270,900 608 265,000 703 325,000 732 299,900 1,519
BrokerMetrics® 2 of 2 10/01/09
Information not guaranteed. © 2009-2010 Terradatum and its suppliers and licensors (http://www.terradatum.com/metrics/licensors).