More Related Content
Similar to January Bucks County Sold Median Price (17)
More from Prudential Fox & Roach, Realtors (20)
January Bucks County Sold Median Price
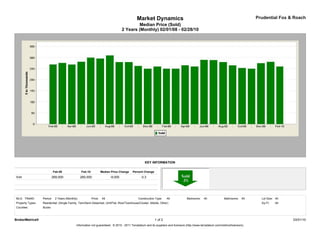
- 1. Market Dynamics Prudential Fox & Roach
Median Price (Sold)
2 Years (Monthly) 02/01/08 - 02/28/10
KEY INFORMATION
Feb-08 Feb-10 Median Price Change Percent Change
Sold 269,000 260,000 -9,000 -3.3
MLS: TReND Period: 2 Years (Monthly) Price: All Construction Type: All Bedrooms: All Bathrooms: All Lot Size: All
Property Types: Residential: (Single Family, Twin/Semi-Detached, Unit/Flat, Row/Townhouse/Cluster, Mobile, Other) Sq Ft: All
Counties: Bucks
BrokerMetrics® 1 of 2 03/01/10
Information not guaranteed. © 2010 - 2011 Terradatum and its suppliers and licensors (http://www.terradatum.com/metrics/licensors).
- 2. Market Dynamics Prudential Fox & Roach
Median Price (Sold)
2 Years (Monthly) 02/01/08 - 02/28/10
FOR SALE UNDER CONTRACT SOLD EXPIRED NEW LISTINGS
Time Period Median $ # Properties Median $ # Properties Median $ # Properties Median $ # Properties Median $ # Properties
Feb-10 347,000 4,127 258,450 314 260,000 247 329,900 249 329,700 724
Jan-10 344,000 4,169 293,000 389 281,000 262 339,000 377 319,900 916
Dec-09 349,900 4,049 280,000 274 275,000 371 369,000 522 288,375 400
Nov-09 350,500 4,432 279,999 331 250,000 578 387,000 452 296,500 558
Oct-09 350,000 4,815 269,900 515 253,250 552 359,995 426 299,000 794
Sep-09 349,900 5,061 261,900 570 265,000 509 359,720 470 314,900 951
Aug-09 349,900 5,052 264,900 533 280,000 607 359,900 409 309,900 797
Jul-09 349,900 5,270 279,900 556 289,000 621 349,900 459 309,700 928
Jun-09 349,900 5,392 299,000 635 290,000 601 349,990 415 319,900 969
May-09 349,995 5,318 299,000 536 260,000 426 374,900 359 324,950 986
Apr-09 349,900 5,290 289,000 551 265,500 391 359,900 407 329,000 1,095
Mar-09 349,900 5,050 279,450 472 250,000 363 375,000 383 327,900 1,067
Feb-09 349,900 4,699 258,950 360 250,000 230 349,900 356 325,750 856
Jan-09 349,900 4,562 265,000 293 259,900 228 379,950 426 319,000 827
Dec-08 349,900 4,499 268,900 249 249,950 362 359,900 515 299,900 451
Nov-08 349,900 4,845 259,450 288 262,500 316 395,000 509 299,900 576
Oct-08 349,900 5,180 267,500 317 279,900 435 349,950 594 308,900 857
Sep-08 350,000 5,368 284,900 419 280,000 470 359,888 626 319,900 929
Aug-08 354,900 5,469 290,950 456 310,000 573 359,900 574 319,400 1,014
Jul-08 359,900 5,548 300,000 478 296,000 600 376,500 615 329,900 1,040
Jun-08 359,900 5,724 308,900 589 300,000 621 369,900 627 330,390 1,195
May-08 364,900 5,590 315,000 575 281,250 506 382,250 486 344,900 1,265
Apr-08 364,950 5,392 295,000 591 268,700 480 395,154 476 339,900 1,329
Mar-08 368,800 5,032 290,000 486 276,000 424 385,900 483 344,900 1,225
Feb-08 368,825 4,758 279,900 477 269,000 349 379,900 474 329,900 1,033
BrokerMetrics® 2 of 2 03/01/10
Information not guaranteed. © 2010 - 2011 Terradatum and its suppliers and licensors (http://www.terradatum.com/metrics/licensors).