More Related Content
Similar to May 2010 Philadelphia County Sold Median Price
Similar to May 2010 Philadelphia County Sold Median Price (18)
More from Prudential Fox & Roach, Realtors
More from Prudential Fox & Roach, Realtors (20)
May 2010 Philadelphia County Sold Median Price
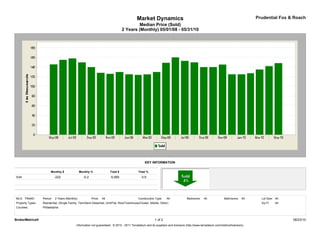
- 1. Market Dynamics Prudential Fox & Roach
Median Price (Sold)
2 Years (Monthly) 05/01/08 - 05/31/10
KEY INFORMATION
Monthly $ Monthly % Total $ Total %
Sold -222 -0.2 -5,560 -3.9
MLS: TReND Period: 2 Years (Monthly) Price: All Construction Type: All Bedrooms: All Bathrooms: All Lot Size: All
Property Types: Residential: (Single Family, Twin/Semi-Detached, Unit/Flat, Row/Townhouse/Cluster, Mobile, Other) Sq Ft: All
Counties: Philadelphia
BrokerMetrics® 1 of 2 06/23/10
Information not guaranteed. © 2010 - 2011 Terradatum and its suppliers and licensors (http://www.terradatum.com/metrics/licensors).
- 2. Market Dynamics Prudential Fox & Roach
Median Price (Sold)
2 Years (Monthly) 05/01/08 - 05/31/10
FOR SALE UNDER CONTRACT SOLD EXPIRED NEW LISTINGS
Time Period Median $ # Properties Median $ # Properties Median $ # Properties Median $ # Properties Median $ # Properties
May-10 149,900 10,763 135,000 739 147,900 1,321 145,000 1,065 149,000 1,876
Apr-10 149,900 12,089 159,900 1,893 142,000 1,162 125,000 1,309 150,000 2,967
Mar-10 149,000 11,850 139,900 1,456 135,000 1,021 137,750 1,272 164,900 2,848
Feb-10 139,900 10,905 149,900 975 127,500 628 117,400 928 156,450 1,778
Jan-10 135,000 11,022 135,000 836 125,000 668 130,000 1,059 135,000 2,335
Dec-09 135,000 10,924 135,000 704 125,000 874 137,000 1,533 123,750 1,348
Nov-09 139,900 11,313 135,000 804 145,000 1,332 149,900 933 129,900 1,688
Oct-09 139,990 11,935 139,900 1,216 140,000 1,149 140,950 1,094 142,450 2,274
Sep-09 139,900 12,061 140,000 1,261 139,900 1,035 139,900 1,139 139,700 2,326
Aug-09 142,000 11,881 149,900 1,050 150,000 1,137 139,450 1,096 139,000 2,105
Jul-09 145,000 12,090 149,900 1,098 153,000 1,131 148,500 1,216 138,000 2,087
Jun-09 149,900 12,420 153,450 1,118 160,000 1,115 149,900 1,299 149,000 2,393
May-09 149,999 12,348 160,000 1,089 148,750 1,040 149,450 1,232 145,850 2,286
Apr-09 151,110 12,180 169,000 1,099 130,000 894 144,900 1,019 159,900 2,347
Mar-09 149,900 12,071 139,900 1,041 124,950 804 139,900 1,197 154,900 2,352
Feb-09 145,900 11,481 134,900 798 124,000 629 139,900 964 142,000 2,088
Jan-09 149,900 11,304 139,900 723 125,000 636 159,000 1,188 134,000 1,994
Dec-08 149,900 11,449 129,900 648 130,000 784 140,000 1,491 129,900 1,368
Nov-08 149,900 11,890 129,900 717 126,000 756 157,500 1,092 139,900 1,709
Oct-08 149,900 12,408 129,950 752 128,000 933 139,900 1,475 139,900 2,035
Sep-08 149,900 12,873 134,900 932 139,900 1,021 159,000 1,568 154,900 2,647
Aug-08 149,900 12,792 140,000 1,003 149,900 1,165 149,900 1,563 135,000 2,281
Jul-08 153,900 13,117 149,900 1,093 158,000 1,209 157,900 1,513 145,000 2,703
Jun-08 155,000 13,030 153,900 1,129 155,000 1,277 153,900 1,487 150,000 2,627
May-08 155,000 12,943 159,900 1,193 145,450 1,232 149,900 1,347 154,900 2,524
BrokerMetrics® 2 of 2 06/23/10
Information not guaranteed. © 2010 - 2011 Terradatum and its suppliers and licensors (http://www.terradatum.com/metrics/licensors).