Downloaded 141 times
![Displacement
Displacement is defined as the straight line path between an
object’s initial position and an object’s final position.
Displacement is a measurement of the change in position of a
moving object.
Displacement is not necessarily the distance travelled!
s = 7 km [E] (displacement)
s = 12 km (distance)](https://image.slidesharecdn.com/1-151015024716-lva1-app6891/75/1-2-displacement-and-position-vs-time-graphs-2-2048.jpg)
![Displacement (continued)
Victor begins his walk 3 km [S] of Starbucks. 2 hours later,
he ends his walk at his friend’s house 2 km [N] of Starbucks.
What is Victor’s displacement?
- x direction
South
+x direction
NorthStarbucks
ref pt
We can see that Victor’s change in position equals
5 km [N]](https://image.slidesharecdn.com/1-151015024716-lva1-app6891/75/1-2-displacement-and-position-vs-time-graphs-3-2048.jpg)
![Displacement (continued)
Mathematically, Victor’s displacement (Δs) can be calculated by :
Displacement = change in position = final position – initial position
- x direction
South
+x direction
NorthStarbucks
ref pt
Initial position
3 km [South]
Final position
2 km [North]
Δs = sfinal – sinitial = 2 km [N] – 3 km [S]
= 2 km [N] – -3 km [N]
= 5 km [N]
5 km [N]](https://image.slidesharecdn.com/1-151015024716-lva1-app6891/75/1-2-displacement-and-position-vs-time-graphs-4-2048.jpg)
![Displacement (continued)
Starbucks
final position
Initial position
3 km [South]
House
2 km [North]
Δs = sfinal – sinitial = zero – 3 km [S]
= zero – -3 km [N]
= 3 km [N]
Victor picks up his friend and they take 1 hour to walk back
to Starbucks for a coffee. What is Victor’s displacement
relative to his starting point?](https://image.slidesharecdn.com/1-151015024716-lva1-app6891/75/1-2-displacement-and-position-vs-time-graphs-5-2048.jpg)
![Displacement (continued)
-3
-2
-1
0
1
2
3
0 1 2 3 4
time (hrs)
Position[N]km
We can also show Victor’s walk on a position vs time graph
Start
Friend’s house
Starbucks
(reference pt.)](https://image.slidesharecdn.com/1-151015024716-lva1-app6891/75/1-2-displacement-and-position-vs-time-graphs-6-2048.jpg)
![-3
-2
-1
0
1
2
3
0 1 2 3 4
time (hrs)
Position[N]km
How far did Victor walk?
Start
Friend’s house
Starbucks
5 km + 2 km = 7 km (DISTANCE)](https://image.slidesharecdn.com/1-151015024716-lva1-app6891/75/1-2-displacement-and-position-vs-time-graphs-7-2048.jpg)
![-3
-2
-1
0
1
2
3
0 1 2 3 4
time (hrs)
Position[N]km
What is Victor’s change in position?
Start
Friend’s house
Starbucks
= 3 km [N] (DISPLACEMENT)](https://image.slidesharecdn.com/1-151015024716-lva1-app6891/75/1-2-displacement-and-position-vs-time-graphs-8-2048.jpg)
![More about position vs time graphs
Biff walks down the hallway and travels a constant 1.5 m
[North] each second. What would a position vs time
graph look like?
0
2
4
6
8
10
0 1 2 3 4 5 6 7
time (s)
Position[N]m
Biff is changing
his position by 1.5
m [N] each second
he walks.](https://image.slidesharecdn.com/1-151015024716-lva1-app6891/75/1-2-displacement-and-position-vs-time-graphs-9-2048.jpg)
![More about position vs time graphs
Biff’s average velocity is 1.5 ms-1 [N]. How is this value
related to the graph?
0
2
4
6
8
10
0 1 2 3 4 5 6 7
time (s)
Position[N]m
Δs = 9 m
Δt = 6 s
-1
9 m
6 s
1.5 ms
s
slope
t](https://image.slidesharecdn.com/1-151015024716-lva1-app6891/75/1-2-displacement-and-position-vs-time-graphs-10-2048.jpg)
![An example:
Determine the velocity for each segment of this position vs
time graph
/m [N]
s
/s
t
A = 3 ms-1[N]
B = 0 ms-1
C = -4 ms-1[N] or 4 ms-1[S]
D = 0 ms-1
E = 6 ms-1[N]
F = 0.9 ms-1[N]](https://image.slidesharecdn.com/1-151015024716-lva1-app6891/75/1-2-displacement-and-position-vs-time-graphs-12-2048.jpg)
![0
100
200
300
400
500
600
0 5 10 15
t /s
s/m[downwards]
Now consider a graph of a falling ball (strobe analysis
lab): The graph is a curve. What does that mean?
The slope of the tangent line
represents the instantaneous
velocity at t = 5 s.
We can estimate the slope
at any point by drawing a
tangent to the curve.
Let’s draw a tangent at t
= 5 s](https://image.slidesharecdn.com/1-151015024716-lva1-app6891/75/1-2-displacement-and-position-vs-time-graphs-14-2048.jpg)
![0
100
200
300
400
500
600
0 5 10 15
t /s
s/m[downwards]By drawing two simple tangents, we can see that the slope of
the tangent line increases as the ball falls.
Slope represents
velocity and it makes
sense that a falling
ball speeds up!!!](https://image.slidesharecdn.com/1-151015024716-lva1-app6891/75/1-2-displacement-and-position-vs-time-graphs-15-2048.jpg)
![0
100
200
300
400
500
600
0 5 10 15
t /s
s/m[downwards]
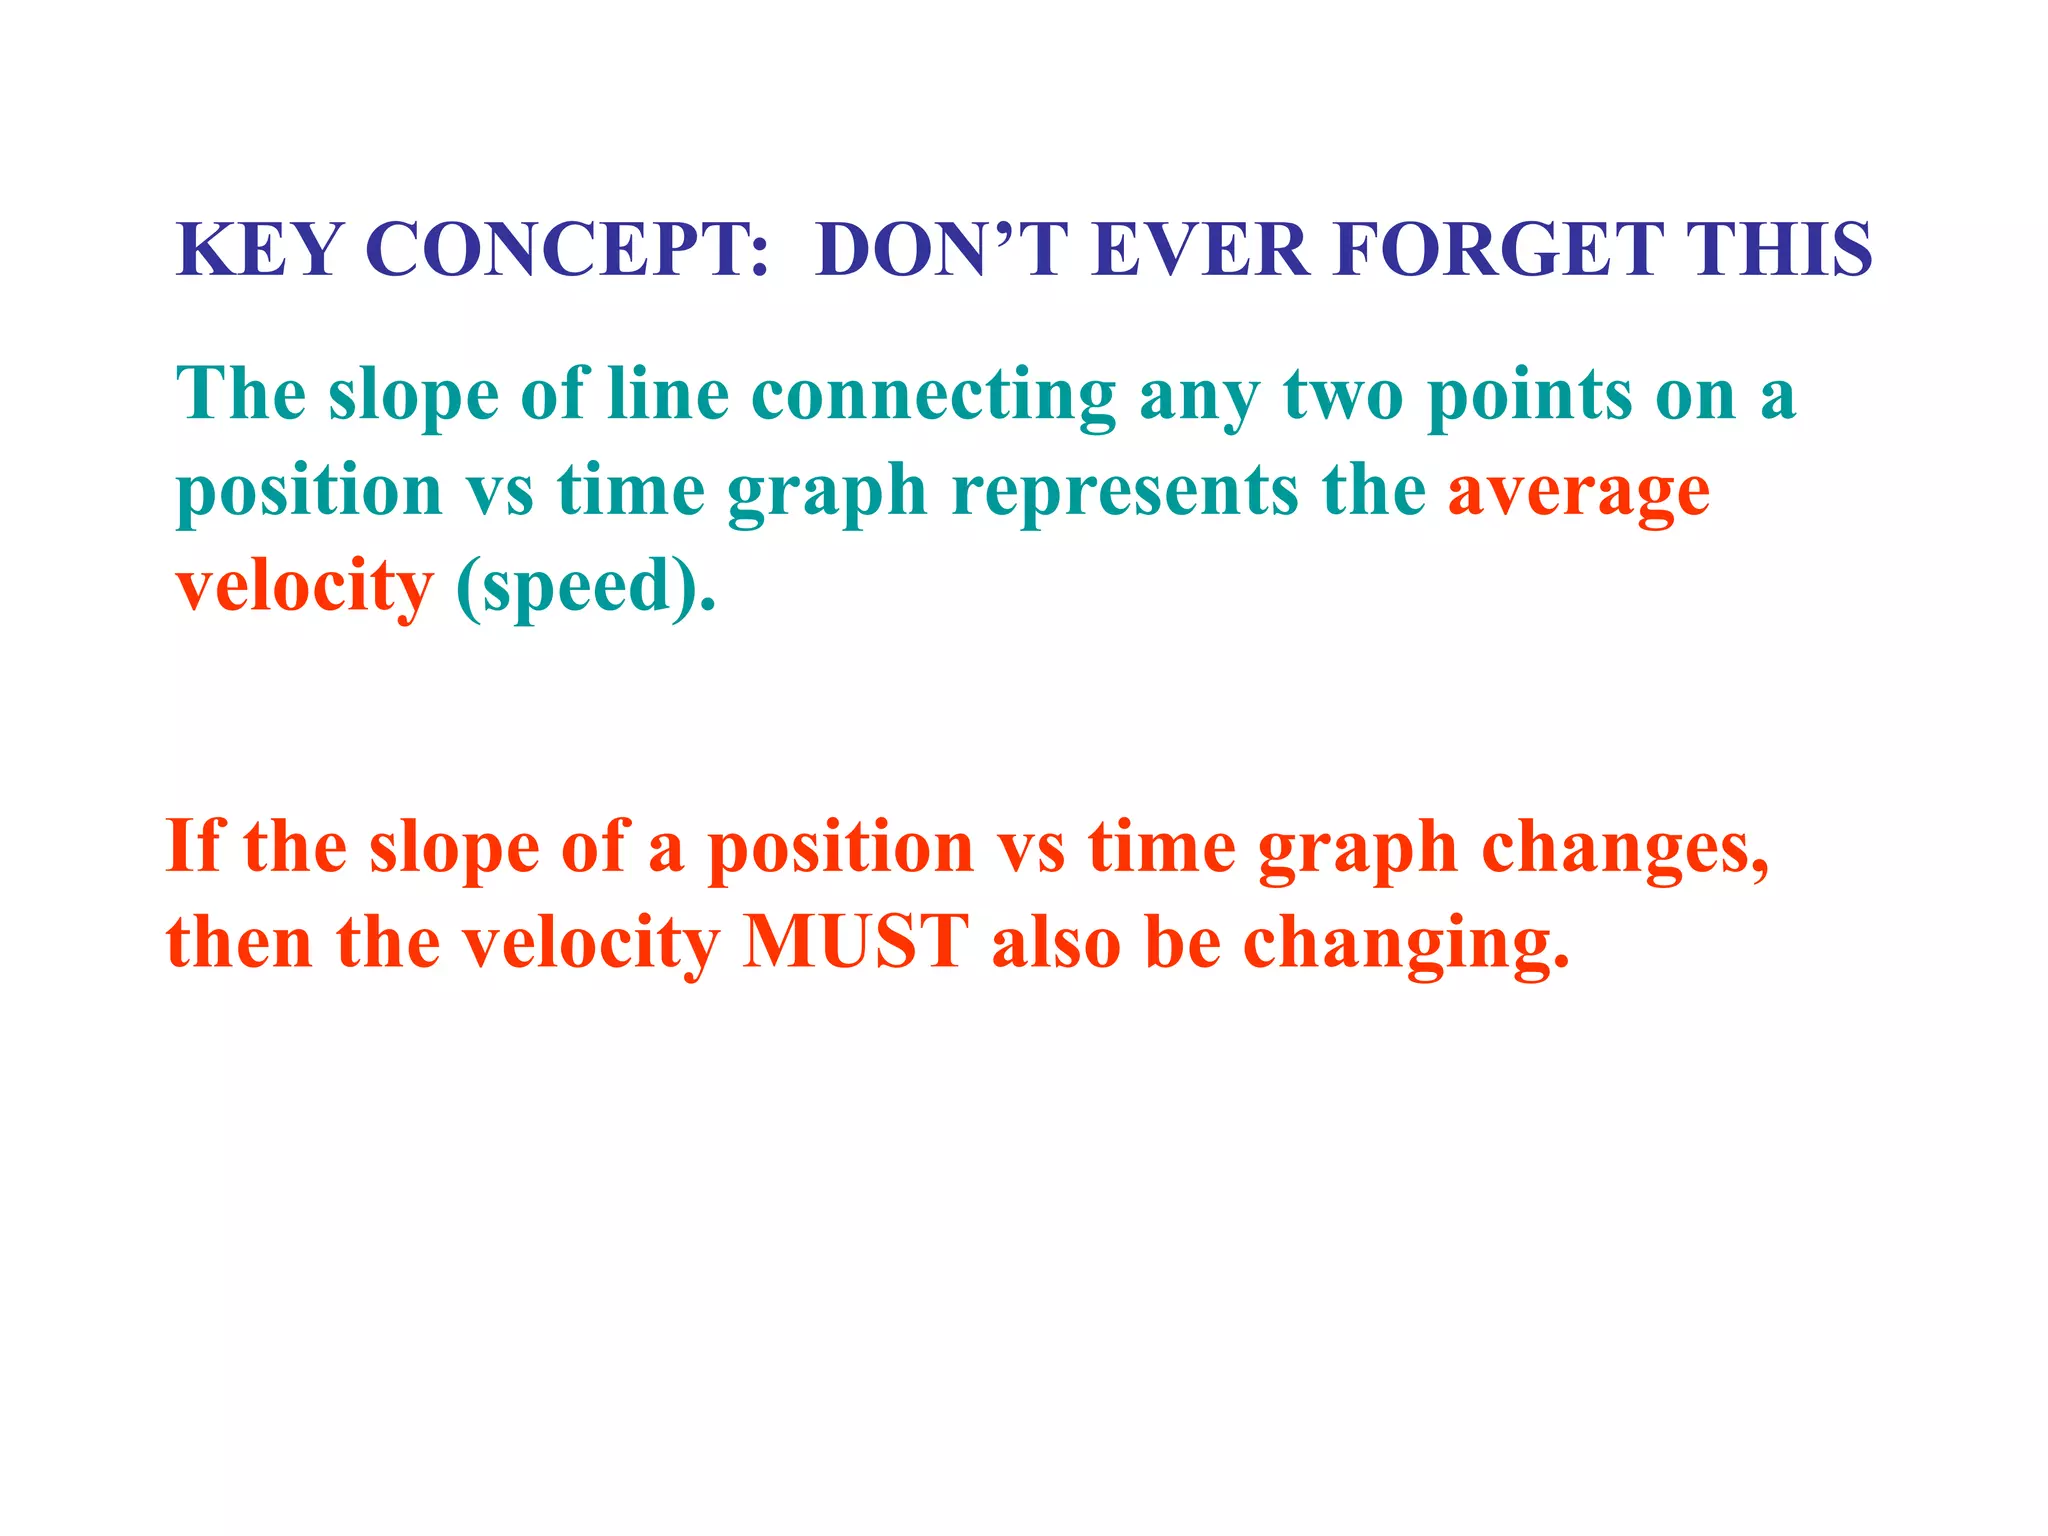
Average velocity is defined as the overall displacement
divided by the time. The average velocity between any
two times would be the slope of a line connecting those
points.
The slope of this line
represents the average
velocity for the time
interval 0 to 10 s](https://image.slidesharecdn.com/1-151015024716-lva1-app6891/75/1-2-displacement-and-position-vs-time-graphs-16-2048.jpg)

1) Displacement is defined as the straight line path between an object's initial and final positions, representing the change in position. It is not necessarily the same as the total distance travelled. 2) Victor's displacement is calculated as his final position (2km North of Starbucks) minus his initial position (3km South of Starbucks), equaling 5km North. 3) A position-time graph shows an object's position over time. The slope of the line between any two points represents the average velocity during that time interval.