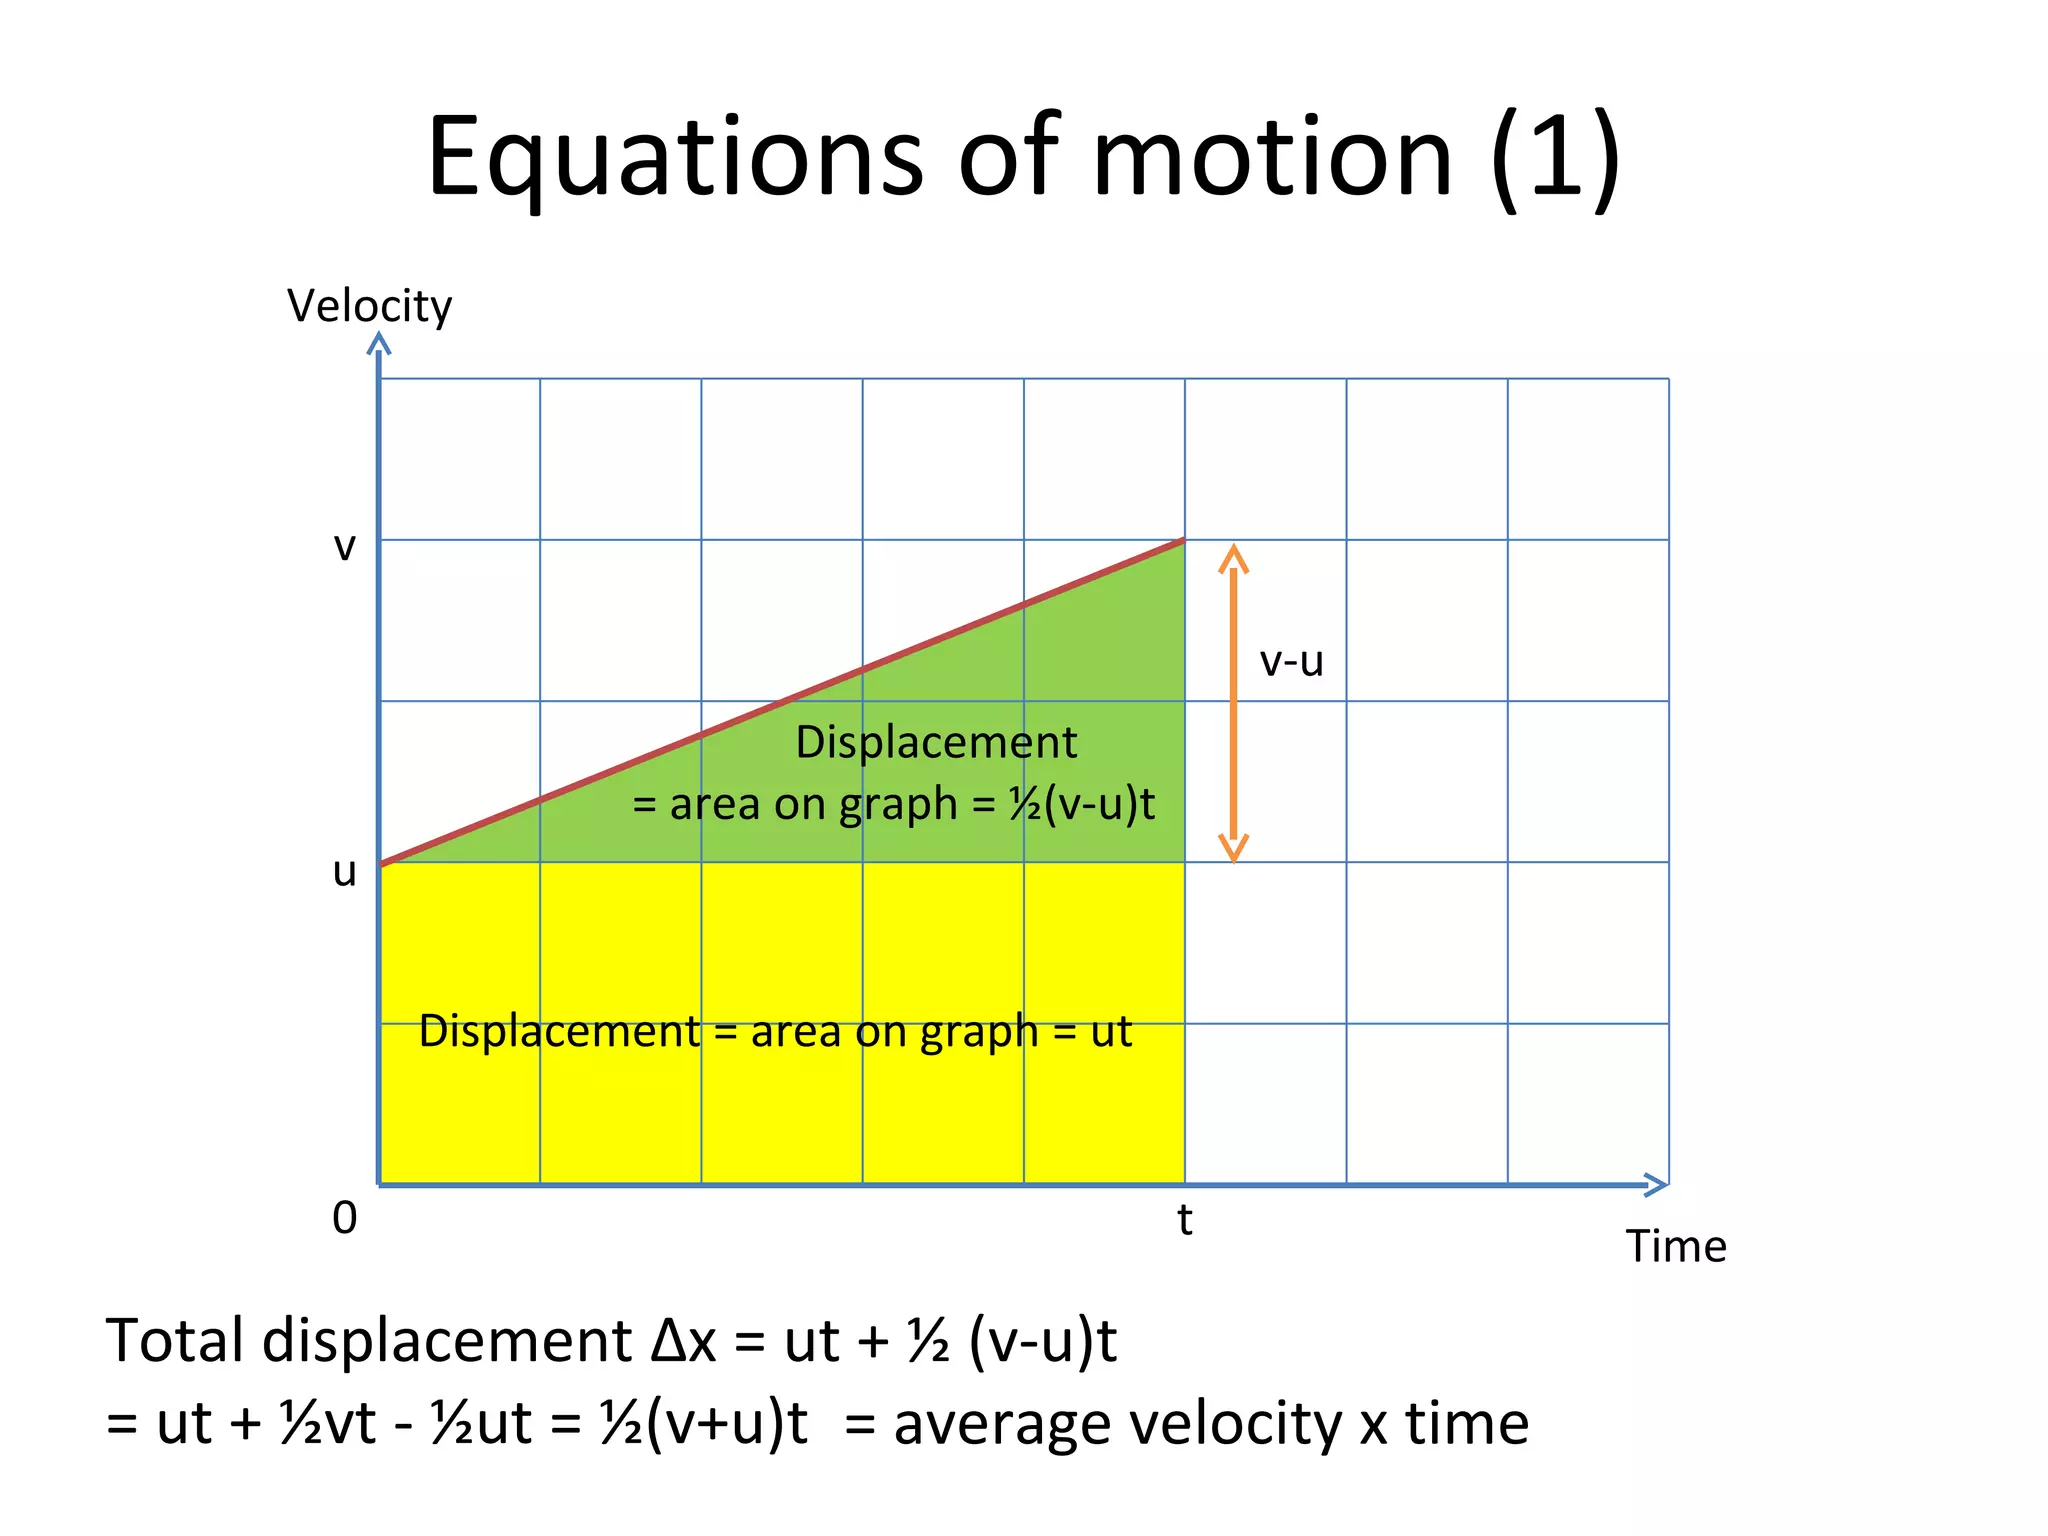
Learn about various motion graphs through interesting graphics.This ppt also includes questions from past papers.It is ideal for educators and students alike who can learn the concepts and their application at the ame time.
Introduction to AI for Nonprofits with Tapp NetworkTechSoup
Dive into the world of AI! Experts Jon Hill and Tareq Monaur will guide you through AI's role in enhancing nonprofit websites and basic marketing strategies, making it easy to understand and apply.
2024.06.01 Introducing a competency framework for languag learning materials ...Sandy Millin
http://sandymillin.wordpress.com/iateflwebinar2024
Published classroom materials form the basis of syllabuses, drive teacher professional development, and have a potentially huge influence on learners, teachers and education systems. All teachers also create their own materials, whether a few sentences on a blackboard, a highly-structured fully-realised online course, or anything in between. Despite this, the knowledge and skills needed to create effective language learning materials are rarely part of teacher training, and are mostly learnt by trial and error.
Knowledge and skills frameworks, generally called competency frameworks, for ELT teachers, trainers and managers have existed for a few years now. However, until I created one for my MA dissertation, there wasn’t one drawing together what we need to know and do to be able to effectively produce language learning materials.
This webinar will introduce you to my framework, highlighting the key competencies I identified from my research. It will also show how anybody involved in language teaching (any language, not just English!), teacher training, managing schools or developing language learning materials can benefit from using the framework.
Model Attribute Check Company Auto PropertyCeline George
In Odoo, the multi-company feature allows you to manage multiple companies within a single Odoo database instance. Each company can have its own configurations while still sharing common resources such as products, customers, and suppliers.
How to Make a Field invisible in Odoo 17Celine George
It is possible to hide or invisible some fields in odoo. Commonly using “invisible” attribute in the field definition to invisible the fields. This slide will show how to make a field invisible in odoo 17.
The French Revolution, which began in 1789, was a period of radical social and political upheaval in France. It marked the decline of absolute monarchies, the rise of secular and democratic republics, and the eventual rise of Napoleon Bonaparte. This revolutionary period is crucial in understanding the transition from feudalism to modernity in Europe.
For more information, visit-www.vavaclasses.com
Macroeconomics- Movie Location
This will be used as part of your Personal Professional Portfolio once graded.
Objective:
Prepare a presentation or a paper using research, basic comparative analysis, data organization and application of economic information. You will make an informed assessment of an economic climate outside of the United States to accomplish an entertainment industry objective.
Palestine last event orientationfvgnh .pptxRaedMohamed3
An EFL lesson about the current events in Palestine. It is intended to be for intermediate students who wish to increase their listening skills through a short lesson in power point.
Honest Reviews of Tim Han LMA Course Program.pptxtimhan337
Personal development courses are widely available today, with each one promising life-changing outcomes. Tim Han’s Life Mastery Achievers (LMA) Course has drawn a lot of interest. In addition to offering my frank assessment of Success Insider’s LMA Course, this piece examines the course’s effects via a variety of Tim Han LMA course reviews and Success Insider comments.
Instructions for Submissions thorugh G- Classroom.pptxJheel Barad
This presentation provides a briefing on how to upload submissions and documents in Google Classroom. It was prepared as part of an orientation for new Sainik School in-service teacher trainees. As a training officer, my goal is to ensure that you are comfortable and proficient with this essential tool for managing assignments and fostering student engagement.
Biological screening of herbal drugs: Introduction and Need for
Phyto-Pharmacological Screening, New Strategies for evaluating
Natural Products, In vitro evaluation techniques for Antioxidants, Antimicrobial and Anticancer drugs. In vivo evaluation techniques
for Anti-inflammatory, Antiulcer, Anticancer, Wound healing, Antidiabetic, Hepatoprotective, Cardio protective, Diuretics and
Antifertility, Toxicity studies as per OECD guidelines
How libraries can support authors with open access requirements for UKRI fund...
Motion graphs
1. 1D Motion graphs We will only consider straight line motion (also called ‘one dimensional’ or ‘linear’ motion). For straight line motion, direction can be indicated with a ‘+’ or ‘-’ sign as long as the positive direction has been specified. This PowerPoint show is designed to accompany (or remind you of) an oral presentation. Without the oral presentation some parts of this PowerPoint show may be meaningless.
2. Position-time graphs On a position-time graph, the gradient gives the velocity. This line has zero gradient, so the velocity is zero. Position / m Time / s 0 2 4 6 8 10 12 14 1 2 3 4 5
3. Line A has a gradient of 4/8 = 0.5 m/s. Line A is a steeper line -> higher velocity (forwards). On a position-time graph, the gradient gives the velocity. Line B has a gradient of 4/10 = 0.4 m/s. Position / m Time / s 0 2 4 6 8 10 12 14 1 2 3 4 5
4. Negative slope so negative velocity (going backwards). Velocity = gradient = -4/10 = -0.4 m/s Position / m Time / s 0 2 4 6 8 10 12 14 1 2 3 4 5
5. After the first 5 seconds the object moves back behind the zero position. The velocity is constant and negative: v = -12 / 10 = - 1.2 m/s Position / m Time / s 0 2 4 6 8 10 12 14 2 4 6 8 10 16 -2 -4 -6
6. What is the average velocity over the 8 seconds? Over the first six seconds? Over the period t = 8s to t=10s ? V = 4/8 = 0.5 m/s V = 2 / 6 = 0.333 m/s V = 2 / 2 = 1 m/s Position / m Time / s 0 2 4 6 8 10 12 14 1 2 3 4 5
7. What is the average velocity over the ten seconds? Over the first four seconds? Over the period t = 4s to t=10s ? V = 5/10 = 0.5 m/s V = 4/4 = 1 m/s V = 1/6 = 0.167 m/s Position / m Time / s 0 2 4 6 8 10 12 14 1 2 3 4 5
8. On a position-time graph, instantaneous velocity at any time is the slope of a tangent to the curve at that time. What is the instantaneous velocity at t= 2s? Instantaneous velocity = slope of tangent = (4.3-1.7) / 4 = 0.65 m/s X X Position / m Time / s 0 2 4 6 8 10 12 14 1 2 3 4 5
9.
10. Velocity-time graphs On a velocity-time graph, the gradient gives the acceleration . Here the gradient is zero, so the acceleration is zero. Velocity (m/s) Time / s 0 2 4 6 8 10 12 14 1 2 3 4 5
11. Acceleration = 4 / 10 = 0.4 m/s² On a velocity-time graph, the gradient gives the acceleration . Velocity (m/s) Time / s 0 2 4 6 8 10 12 14 1 2 3 4 5
12. In the first four seconds: acceleration = zero In the next 10 seconds: acceleration = -4 / 10 = -0.4 m/s² Velocity (m/s) Time / s 0 2 4 6 8 10 12 14 1 2 3 4 5
13. Velocity is negative (backwards). Acceleration = zero Velocity (m/s) Time / s 0 2 4 6 8 10 12 14 2 4 6 8 10 16 -2 -4 -6
14. In the first four seconds: acceleration = -2 / 4 = -0.5 m/s² In the next 6 seconds: acceleration = zero Velocity (m/s) Time / s 0 2 4 6 8 10 12 14 1 2 3 4 5 16 -1 -2 -3
15. Acceleration = -8 / 8 = -1 m/s² Note that the acceleration is constant here, whether the velocity is forwards, zero or backwards (negative). Velocity (m/s) Time / s 0 2 4 6 8 10 12 14 2 4 6 8 10 16 -2 -4 -6
16. In the first four seconds, a = 4 / 4 = 1 m/s² Between t= 4s and t = 10s, a = zero Between t= 10s and t = 12s, a = -4 / 2 = -2 m/s² Over the whole 12s, average acceleration = ZERO Velocity (m/s) Time / s 0 2 4 6 8 10 12 14 1 2 3 4 5
17. On a velocity-time graph, the area under the graph gives the displacement (the change in position). Displacement = 4 x 10 = 40 m Velocity (m/s) Time / s 0 2 4 6 8 10 12 14 1 2 3 4 5
18.
19. Δ x = ½ x 4 x 10 = 20m Velocity (m/s) Time / s 0 2 4 6 8 10 12 14 1 2 3 4 5
20. First four seconds: Δ x = 4 x 4 = 16m Next ten seconds: Δ x = ½ x 4 x 10 = 20m Total displacement = 16m + 20m = 36m Velocity (m/s) Time / s 0 2 4 6 8 10 12 14 1 2 3 4 5
21. Velocity (m/s) Time / s 0 2 4 6 8 10 12 14 2 4 6 8 10 16 -2 -4 -6 An area below the time axis is a NEGATIVE AREA and corresponds to a NEGATIVE displacement i.e. a backwards displacement . Δx = -4 x 8 = -32m
22. First four seconds: Δ x = ½ x -2 x 4 = -4m Next six seconds: Δ x = -2 x 6 = -12m Total displacement = -4m + -12m = -16m Velocity (m/s) Time / s 0 2 4 6 8 10 12 14 1 2 3 4 5 16 -1 -2 -3
23. Total displacement = 8m + -8m = 0m First four seconds: Δ x = ½ x 4 x 4 = 8m Next four seconds: Δ x = ½ x -4 x 4 = -8m THINK about that result! Velocity (m/s) Time / s 0 2 4 6 8 10 12 14 2 4 6 8 10 16 -2 -4 -6
24. Δx = 0.5 x 4 x 4 = 8m Δx = 0.5 x 4 x 2 = 4m Δx = 4 x 6= 24m Total displacement = 8m + 24m + 4m = 36m Velocity (m/s) Time / s 0 2 4 6 8 10 12 14 1 2 3 4 5
25. Equations of motion (1) Displacement = area on graph = ut Total displacement Δ x = ut + ½ (v-u)t = ut + ½vt - ½ut = ½(v+u)t = average velocity x time Velocity Time 0 t u v Displacement = area on graph = ½(v-u)t v-u