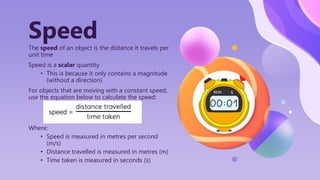
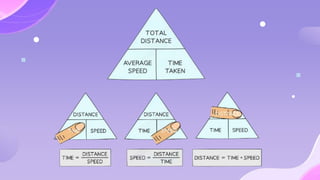
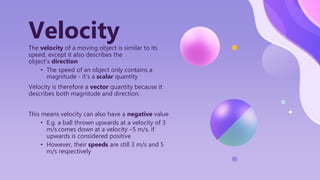
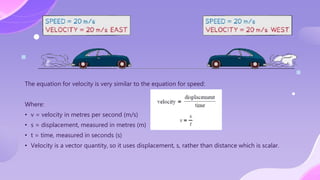
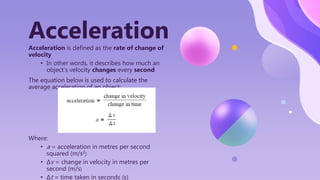
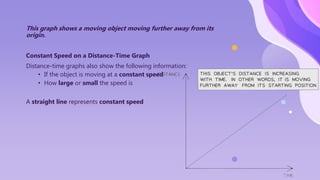
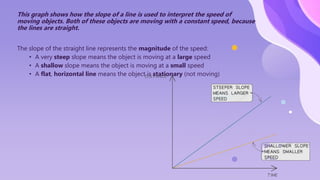
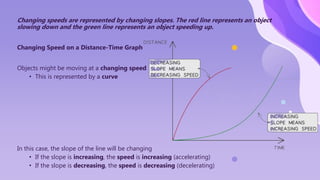
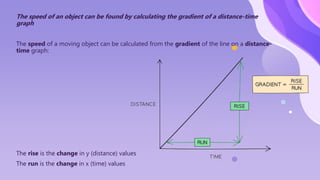
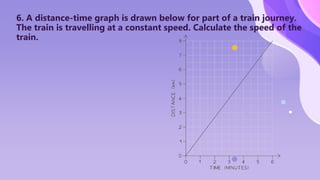
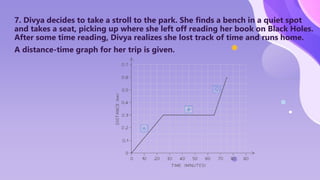
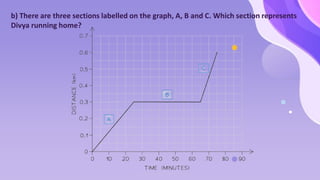
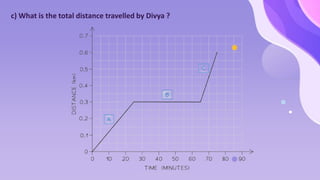
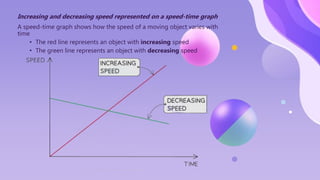
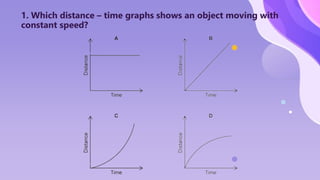
Slideshow on distance time graphs and speed time graphs. It is very helpful for grades 7-9. It is very detailed. One stop for all graph types in science. Science graphs will become easy with this detailed ppt.
The PowerPoint presentation (ppt) under discussion proves to be an invaluable resource, offering a wealth of assistance and comprehensive details that cater to the needs of its audience. This presentation stands out as an exemplary tool, combining clarity, depth, and relevance to ensure a profound understanding of the subject matter.
One of the key strengths of this ppt lies in its helpful nature. Each slide is meticulously crafted to provide guidance and support, serving as a valuable companion for individuals seeking information on the topic at hand. The helpfulness of the presentation is evident in its ability to simplify complex concepts, breaking them down into digestible segments that promote a clear and accessible learning experience.
Moreover, the detailed nature of the presentation is a noteworthy aspect that sets it apart. The creators have invested time and effort into thorough research and exploration, resulting in a comprehensive compilation of information. The slides go beyond surface-level discussions, delving into nuanced aspects of the subject matter, thereby enriching the audience's knowledge and fostering a more profound comprehension of the material.
The attention to detail is evident not only in the content but also in the visual elements of the presentation. Graphics, charts, and illustrations complement the textual information, creating a multimedia experience that caters to diverse learning preferences. This meticulous detailing not only enhances the aesthetic appeal of the ppt but also reinforces key points, making the information more memorable and engaging.
Furthermore, the ppt's utility extends beyond a mere informational resource. Its detailed content serves as a valuable reference point for further exploration and study. The audience can delve into specific sections or revisit key concepts, reinforcing their understanding and facilitating a deeper grasp of the subject matter over time.
In conclusion, this PowerPoint presentation stands out as an invaluable educational tool, combining a helpful approach with meticulous detailing. Its clarity, depth, and relevance make it a go-to resource for individuals seeking a comprehensive understanding of the subject matter. Whether used for educational purposes, professional development, or personal enrichment, this ppt proves to be a reliable and effective guide, ensuring that its audience is not only informed but also empowered with knowledge. It is very catchy. The presentation's helpful and detailed nature is manifested in its strategic organization and seamless flow. The creators have thoughtfully structured the content, presenting information in a logical sequence that aids in the audience's comprehension. Each section builds upon the previous one.
Thank you lot
2. Motion is the change in position of an object with respect to its surroundings in a
given interval of time.
Distance travelled = Total path length covered
= d + d
= 2d
Moti
on
5. The speed of an object is the distance it travels per
unit time
Speed is a scalar quantity
• This is because it only contains a magnitude
(without a direction)
For objects that are moving with a constant speed,
use the equation below to calculate the speed:
Where:
• Speed is measured in metres per second
(m/s)
• Distance travelled is measured in metres (m)
• Time taken is measured in seconds (s)
Speed
6. In some cases, the speed of a moving object is not
constant
• For example, the object might be moving
faster or slower at certain moments in time
(accelerating and decelerating)
The equation for calculating the average speed of
an object is:
The formula for average speed (and the formula for
speed) can be rearranged with the help of the
formula triangle at the side:
Average
Speed
7.
8. 1. If a car travels 120 km in 2 hrs. Calculate its average speed ?
2. If Anna drives at an average speed of 45 km/hr on a journey of
135 km, the journey would take time ?
3. Jane walks at an average speed of 8 km in 3 hr. Calculate the
distance he travels ?
9. 4. Planes fly at typical speeds of around 250 m/s. Calculate the
total distance travelled by a plane moving at this average speed
for 2 hours.
10. The velocity of a moving object is similar to its
speed, except it also describes the
object’s direction
• The speed of an object only contains a
magnitude - it’s a scalar quantity
Velocity is therefore a vector quantity because it
describes both magnitude and direction.
This means velocity can also have a negative value
• E.g. a ball thrown upwards at a velocity of 3
m/s comes down at a velocity –5 m/s, if
upwards is considered positive
• However, their speeds are still 3 m/s and 5
m/s respectively
Velocity
11. The equation for velocity is very similar to the equation for speed:
Where:
• v = velocity in metres per second (m/s)
• s = displacement, measured in metres (m)
• t = time, measured in seconds (s)
• Velocity is a vector quantity, so it uses displacement, s, rather than distance which is scalar.
12. Acceleration
Acceleration is defined as the rate of change of
velocity
• In other words, it describes how much an
object's velocity changes every second
The equation below is used to calculate the
average acceleration of an object:
Where:
• a = acceleration in metres per second
squared (m/s2)
• Δv = change in velocity in metres per
second (m/s)
• Δt = time taken in seconds (s)
13. The change in velocity is found by
the difference between the initial and final velocity, as
written below:
Where:
• v = final velocity in metres per second (m/s)
• u = initial velocity in metres per second (m/s)
14. Speeding Up & Slowing Down
An object that speeds up is accelerating
An object that slows down is decelerating
The acceleration of an object can be positive or negative, depending on whether the object is speeding
up or slowing down
• If an object is speeding up, its acceleration is positive
• If an object is slowing down, its acceleration is negative (sometimes called deceleration)
15. 5. A Japanese bullet train decelerates at a constant rate in a
straight line. The velocity of the train decreases from 50 m/s to
42 m/s in 30 seconds.
(a) Calculate the change in velocity of the train.
(b) Calculate the deceleration of the train, and explain how your
answer shows the train is slowing down.
16. A Japanese bullet train decelerates at a constant rate in a
straight line. The velocity of the train decreases from 50 m/s to
42 m/s in 30 seconds.
(a) Calculate the change in velocity of the train.
17. A Japanese bullet train decelerates at a constant rate in a straight
line. The velocity of the train decreases from 50 m/s to 42 m/s in 30
seconds.
(b) Calculate the deceleration of the train, and explain how your
answer shows the train is slowing down.
19. Distance – time
graphs
A distance-time graph shows how the distance of an object moving in
a straight line (from a starting position) varies over time.
20. This graph shows a moving object moving further away from its
origin.
Constant Speed on a Distance-Time Graph
Distance-time graphs also show the following information:
• If the object is moving at a constant speed
• How large or small the speed is
A straight line represents constant speed
21. This graph shows how the slope of a line is used to interpret the speed of
moving objects. Both of these objects are moving with a constant speed, because
the lines are straight.
The slope of the straight line represents the magnitude of the speed:
• A very steep slope means the object is moving at a large speed
• A shallow slope means the object is moving at a small speed
• A flat, horizontal line means the object is stationary (not moving)
22. Changing speeds are represented by changing slopes. The red line represents an object
slowing down and the green line represents an object speeding up.
Changing Speed on a Distance-Time Graph
Objects might be moving at a changing speed
• This is represented by a curve
In this case, the slope of the line will be changing
• If the slope is increasing, the speed is increasing (accelerating)
• If the slope is decreasing, the speed is decreasing (decelerating)
23. The speed of an object can be found by calculating the gradient of a distance-time
graph
The speed of a moving object can be calculated from the gradient of the line on a distance-
time graph:
The rise is the change in y (distance) values
The run is the change in x (time) values
24. 6. A distance-time graph is drawn below for part of a train journey.
The train is travelling at a constant speed. Calculate the speed of the
train.
25. 7. Divya decides to take a stroll to the park. She finds a bench in a quiet spot
and takes a seat, picking up where she left off reading her book on Black Holes.
After some time reading, Divya realizes she lost track of time and runs home.
A distance-time graph for her trip is given.
26. a) How long does Divya spend reading her book?
27. b) There are three sections labelled on the graph, A, B and C. Which section represents
Divya running home?
28. c) What is the total distance travelled by Divya ?
30. Increasing and decreasing speed represented on a speed-time graph
A speed-time graph shows how the speed of a moving object varies with
time
• The red line represents an object with increasing speed
• The green line represents an object with decreasing speed
31. A straight line represents constant acceleration
The slope of the line represents the magnitude of acceleration
• A steep slope means large acceleration (or deceleration) - i.e. the object's speed changes
very quickly
• A gentle slope means small acceleration (or deceleration) - i.e. the object's speed changes
very gradually
• A flat line means the acceleration is zero - i.e. the object is moving with a constant speed
32. The distance travelled can be found from the area beneath the graph
If the area beneath the graph forms a triangle (the object is accelerating or decelerating) then the area
can be determined using the formula:
If the area beneath the graph is a rectangle (constant velocity) then the area can be determined using the
formula:
33. 8. The speed-time graph below shows a car journey which lasts for 160
seconds.
Calculate the total distance travelled by the car on this journey.
35. 1. Which distance – time graphs shows an object moving with
constant speed?
36. 2. What is the speed of a bowling ball which travels down a 30 m
lane in 2.5 seconds?
A. 5 miles per hour
B. 75 meters per second
C. 12 meters per second
D. 12 miles per hour
37. 3. An athlete runs a 100 m race in a straight line. The table shows how
his speed changes with time for the first 5.0 s of the race.
What is the average acceleration of the athlete between time 2.0 s and
3.0 s?
A 1.6 m/ s2
B 1.9 m/ s2
C 4.9 m/ s2
D 5.7 m/ s2
38. 4. Figure shows a speed–time graph for a car.
• Describe the motion of the car from 0 to 50 .
• Describe the motion of the car from
50 s to 90 s.
• Calculate the distance travelled by the
car between 50 s and 90 s.
39. 5. A motorcycle travels at a constant speed. The motorcycle travels
710 m in 87 s. Calculate the speed of the motorcycle and show that it
is close to 8 m/s.
40. CREDITS: This presentation template was created by Slidesgo,
including icons by Flaticon, infographics & images by Freepik
THANKS
!
Does anyone have any
questions?
Please keep this slide for attribution