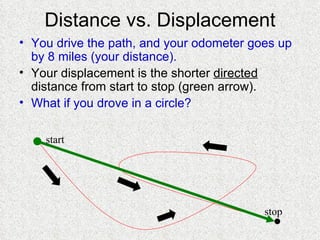
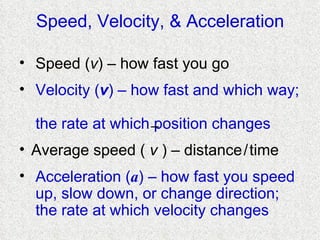
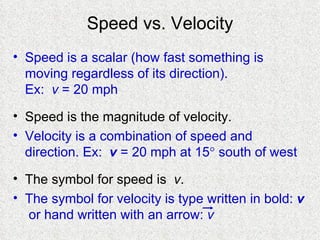
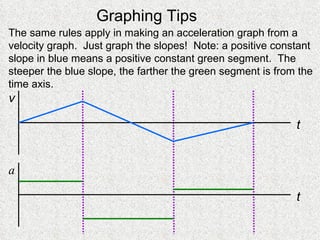
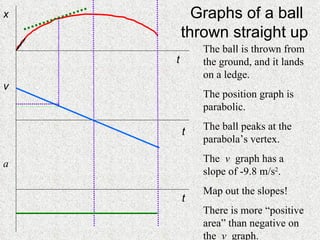
Distance vs. Displacement You drive the path, and your odometer goes up by 8 miles (your distance). Your displacement is the shorter  directed  distance from start to stop (green arrow). What if you drove in a circle? start stop
Speed, Velocity, & Acceleration Speed ( v ) – how fast you go Velocity ( v ) – how fast and which way;   the rate at which position changes Average speed (  v  ) – distance   /   time Acceleration ( a ) – how fast you speed   up, slow down, or change direction;   the rate at which velocity changes
Speed vs. Velocity Speed is a scalar (how fast something is moving regardless of its direction).  Ex:  v  = 20 mph Speed is the magnitude of velocity. Velocity is a combination of speed and direction. Ex:  v  = 20 mph at 15   south of west The symbol for speed is  v . The symbol for velocity is type written in bold:  v   or hand written with an arrow:  v
Speed vs. Velocity During your 8 mi. trip, which took 15 min., your speedometer displays your instantaneous speed, which varies throughout the trip. Your average speed is 32 mi/hr. Your average velocity is 32 mi/hr in a SE direction. At any point in time, your velocity vector points tangent to your path.   The faster you go, the longer your velocity vector.
Acceleration Acceleration – how fast you speed up, slow down, or change direction; it’s the rate at which velocity changes. Two examples: a  = +2 mph   /   s t  (s) v  (mph) 0 55 1 57 2 59 3 61 t  (s) v  (m/s) 0 34 1 31 2 28 3 25 a  = -3 m   /   s s = -3 m   /   s   2
Velocity & Acceleration Sign Chart V E L O C I T Y ACCELERATION + - + Moving forward; Speeding up Moving backward; Slowing down - Moving forward; Slowing down Moving backward; Speeding up
Acceleration due to Gravity a  = - g  = -9.8 m/s 2   9.8 m/s 2 Near the surface of the Earth, all objects accelerate at the same rate (ignoring air resistance). Interpretation : Velocity decreases by 9.8 m/s each second, meaning velocity is becoming less positive or more negative.  Less positive means slowing down while going up.  More negative means speeding up while going down. This acceleration vector is the same on the way up, at the top, and on the way down!
Kinematics Formula Summary For 1-D motion with  constant  acceleration: v f  = v 0  +  a   t   v avg  = ( v 0  +  v f   )   /   2  x  =  v 0   t  +  ½   a   t   2 v f 2  –  v 0 2  = 2   a    x
Graphing ! A … Starts at home (origin) and goes forward slowly B … Not moving (position remains constant as time  progresses) C … Turns around and goes in the other direction    quickly, passing up home 1 – D Motion x t A B C
Graphing w/ Acceleration x A …  Start from rest south of home; increase speed gradually B …  Pass home; gradually slow to a stop (still moving north) C …  Turn around; gradually speed back up again heading south D …  Continue heading south; gradually slow to a stop near the    starting point t A B C D
Tangent Lines t x On a position vs. time graph: SLOPE VELOCITY Positive Positive Negative Negative Zero Zero SLOPE SPEED Steep Fast Gentle Slow Flat Zero
Increasing & Decreasing Increasing Decreasing On a position vs. time graph: Increasing  means moving forward (positive direction). Decreasing  means moving backwards (negative direction). t x
Concavity On a position vs. time graph: Concave up  means positive acceleration. Concave down  means negative acceleration. t x
Special Points P Q R S t x Inflection Pt. P, R Change of concavity Peak or Valley Q Turning point Time Axis Intercept P, S Times when you are at “home”
Curve Summary A B C D t x
All 3 Graphs v t a t t x
Graphing Tips Line up the graphs vertically. Draw vertical dashed lines at special points except intercepts. Map the slopes of the position graph onto the velocity graph. A red peak or valley means a blue time intercept.  t x v t
Graphing Tips The same rules apply in making an acceleration graph from a velocity graph.  Just graph the slopes!  Note: a positive constant slope in blue means a positive constant green segment.  The steeper the blue slope, the farther the green segment is from the time axis. a t v t
Real life Note how the  v   graph is pointy and the  a   graph skips.  In real life, the blue points would be smooth curves and the green segments would be connected.  In our class, however, we’ll mainly deal with constant acceleration. a t v t
Area under a velocity graph “ forward area” “ backward area” Area above the time axis = forward (positive) displacement. Area below the time axis = backward (negative) displacement. Net area (above - below) = net displacement. Total area (above + below) = total distance traveled. v t
Area The areas above and below are about equal, so even though a significant distance may have been covered, the displacement is about zero, meaning the stopping point was near the starting point.  The position graph shows this too. v t “ forward area” “ backward area” t x
Area units Imagine approximating the area under the curve with very thin rectangles. Each has area of height    width. The height is in m/s; width is in seconds. Therefore, area is in meters! v  (m/s) t  (s) 12 m/s 0.5 s 12 The rectangles under the time axis have negative    heights, corresponding to negative displacement.
Graphs of a ball thrown straight up  x v a The ball is thrown from the ground, and it lands on a ledge. The position graph is parabolic. The ball peaks at the parabola’s vertex. The  v   graph has a slope of -9.8 m/s 2 . Map out the slopes! There is more “positive area” than negative on the  v   graph. t t t
Graph Practice Try making all three graphs for the following scenario : 1.   Schmedrick starts out north of home.  At time zero he’s driving a cement mixer south very fast at a constant speed.   2. He accidentally runs over an innocent moose crossing the road, so he slows to a stop to check on the poor moose. 3. He pauses for a while until he determines the moose is squashed flat and deader than a doornail. 4. Fleeing the scene of the crime, Schmedrick takes off again in the same direction, speeding up quickly. 5. When his conscience gets the better of him, he slows, turns around, and returns to the crash site.
Uniform Acceleration When object starts from rest and undergoes constant acceleration: Position is proportional to the square of time. Position changes result in the sequence of odd numbers. Falling bodies exhibit this type of motion (since  g   is constant). t   : 0  1  2  3  4  x  = 1  x  = 3  x  = 5 ( arbitrary  units ) x  : 0  1  4  9  16   x  = 7
Spreadsheet Problem We’re analyzing position as a function of time, initial velocity, and constant acceleration. x ,   x , and the ratio depend on  t ,  v 0 , and  a .  x  is how  much position changes each second. The ratio (1, 3, 5, 7) is the ratio of the   x ’s. Make a spreadsheet like this and determine what must be true about  v 0  and/or  a   in order to get this ratio of odd numbers. Explain your answer mathematically.

Motion

  • 1.
    Distance vs. DisplacementYou drive the path, and your odometer goes up by 8 miles (your distance). Your displacement is the shorter directed distance from start to stop (green arrow). What if you drove in a circle? start stop
  • 2.
    Speed, Velocity, &Acceleration Speed ( v ) – how fast you go Velocity ( v ) – how fast and which way; the rate at which position changes Average speed ( v ) – distance / time Acceleration ( a ) – how fast you speed up, slow down, or change direction; the rate at which velocity changes
  • 3.
    Speed vs. VelocitySpeed is a scalar (how fast something is moving regardless of its direction). Ex: v = 20 mph Speed is the magnitude of velocity. Velocity is a combination of speed and direction. Ex: v = 20 mph at 15  south of west The symbol for speed is v . The symbol for velocity is type written in bold: v or hand written with an arrow: v
  • 4.
    Speed vs. VelocityDuring your 8 mi. trip, which took 15 min., your speedometer displays your instantaneous speed, which varies throughout the trip. Your average speed is 32 mi/hr. Your average velocity is 32 mi/hr in a SE direction. At any point in time, your velocity vector points tangent to your path. The faster you go, the longer your velocity vector.
  • 5.
    Acceleration Acceleration –how fast you speed up, slow down, or change direction; it’s the rate at which velocity changes. Two examples: a = +2 mph / s t (s) v (mph) 0 55 1 57 2 59 3 61 t (s) v (m/s) 0 34 1 31 2 28 3 25 a = -3 m / s s = -3 m / s 2
  • 6.
    Velocity & AccelerationSign Chart V E L O C I T Y ACCELERATION + - + Moving forward; Speeding up Moving backward; Slowing down - Moving forward; Slowing down Moving backward; Speeding up
  • 7.
    Acceleration due toGravity a = - g = -9.8 m/s 2 9.8 m/s 2 Near the surface of the Earth, all objects accelerate at the same rate (ignoring air resistance). Interpretation : Velocity decreases by 9.8 m/s each second, meaning velocity is becoming less positive or more negative. Less positive means slowing down while going up. More negative means speeding up while going down. This acceleration vector is the same on the way up, at the top, and on the way down!
  • 8.
    Kinematics Formula SummaryFor 1-D motion with constant acceleration: v f = v 0 + a t v avg = ( v 0 + v f ) / 2  x = v 0 t + ½ a t 2 v f 2 – v 0 2 = 2 a  x
  • 9.
    Graphing ! A… Starts at home (origin) and goes forward slowly B … Not moving (position remains constant as time progresses) C … Turns around and goes in the other direction quickly, passing up home 1 – D Motion x t A B C
  • 10.
    Graphing w/ Accelerationx A … Start from rest south of home; increase speed gradually B … Pass home; gradually slow to a stop (still moving north) C … Turn around; gradually speed back up again heading south D … Continue heading south; gradually slow to a stop near the starting point t A B C D
  • 11.
    Tangent Lines tx On a position vs. time graph: SLOPE VELOCITY Positive Positive Negative Negative Zero Zero SLOPE SPEED Steep Fast Gentle Slow Flat Zero
  • 12.
    Increasing & DecreasingIncreasing Decreasing On a position vs. time graph: Increasing means moving forward (positive direction). Decreasing means moving backwards (negative direction). t x
  • 13.
    Concavity On aposition vs. time graph: Concave up means positive acceleration. Concave down means negative acceleration. t x
  • 14.
    Special Points PQ R S t x Inflection Pt. P, R Change of concavity Peak or Valley Q Turning point Time Axis Intercept P, S Times when you are at “home”
  • 15.
    Curve Summary AB C D t x
  • 16.
    All 3 Graphsv t a t t x
  • 17.
    Graphing Tips Lineup the graphs vertically. Draw vertical dashed lines at special points except intercepts. Map the slopes of the position graph onto the velocity graph. A red peak or valley means a blue time intercept. t x v t
  • 18.
    Graphing Tips Thesame rules apply in making an acceleration graph from a velocity graph. Just graph the slopes! Note: a positive constant slope in blue means a positive constant green segment. The steeper the blue slope, the farther the green segment is from the time axis. a t v t
  • 19.
    Real life Notehow the v graph is pointy and the a graph skips. In real life, the blue points would be smooth curves and the green segments would be connected. In our class, however, we’ll mainly deal with constant acceleration. a t v t
  • 20.
    Area under avelocity graph “ forward area” “ backward area” Area above the time axis = forward (positive) displacement. Area below the time axis = backward (negative) displacement. Net area (above - below) = net displacement. Total area (above + below) = total distance traveled. v t
  • 21.
    Area The areasabove and below are about equal, so even though a significant distance may have been covered, the displacement is about zero, meaning the stopping point was near the starting point. The position graph shows this too. v t “ forward area” “ backward area” t x
  • 22.
    Area units Imagineapproximating the area under the curve with very thin rectangles. Each has area of height  width. The height is in m/s; width is in seconds. Therefore, area is in meters! v (m/s) t (s) 12 m/s 0.5 s 12 The rectangles under the time axis have negative heights, corresponding to negative displacement.
  • 23.
    Graphs of aball thrown straight up x v a The ball is thrown from the ground, and it lands on a ledge. The position graph is parabolic. The ball peaks at the parabola’s vertex. The v graph has a slope of -9.8 m/s 2 . Map out the slopes! There is more “positive area” than negative on the v graph. t t t
  • 24.
    Graph Practice Trymaking all three graphs for the following scenario : 1. Schmedrick starts out north of home. At time zero he’s driving a cement mixer south very fast at a constant speed. 2. He accidentally runs over an innocent moose crossing the road, so he slows to a stop to check on the poor moose. 3. He pauses for a while until he determines the moose is squashed flat and deader than a doornail. 4. Fleeing the scene of the crime, Schmedrick takes off again in the same direction, speeding up quickly. 5. When his conscience gets the better of him, he slows, turns around, and returns to the crash site.
  • 25.
    Uniform Acceleration Whenobject starts from rest and undergoes constant acceleration: Position is proportional to the square of time. Position changes result in the sequence of odd numbers. Falling bodies exhibit this type of motion (since g is constant). t : 0 1 2 3 4  x = 1  x = 3  x = 5 ( arbitrary units ) x : 0 1 4 9 16  x = 7
  • 26.
    Spreadsheet Problem We’reanalyzing position as a function of time, initial velocity, and constant acceleration. x ,  x , and the ratio depend on t , v 0 , and a .  x is how much position changes each second. The ratio (1, 3, 5, 7) is the ratio of the  x ’s. Make a spreadsheet like this and determine what must be true about v 0 and/or a in order to get this ratio of odd numbers. Explain your answer mathematically.