This document provides information about distance-time graphs, including:
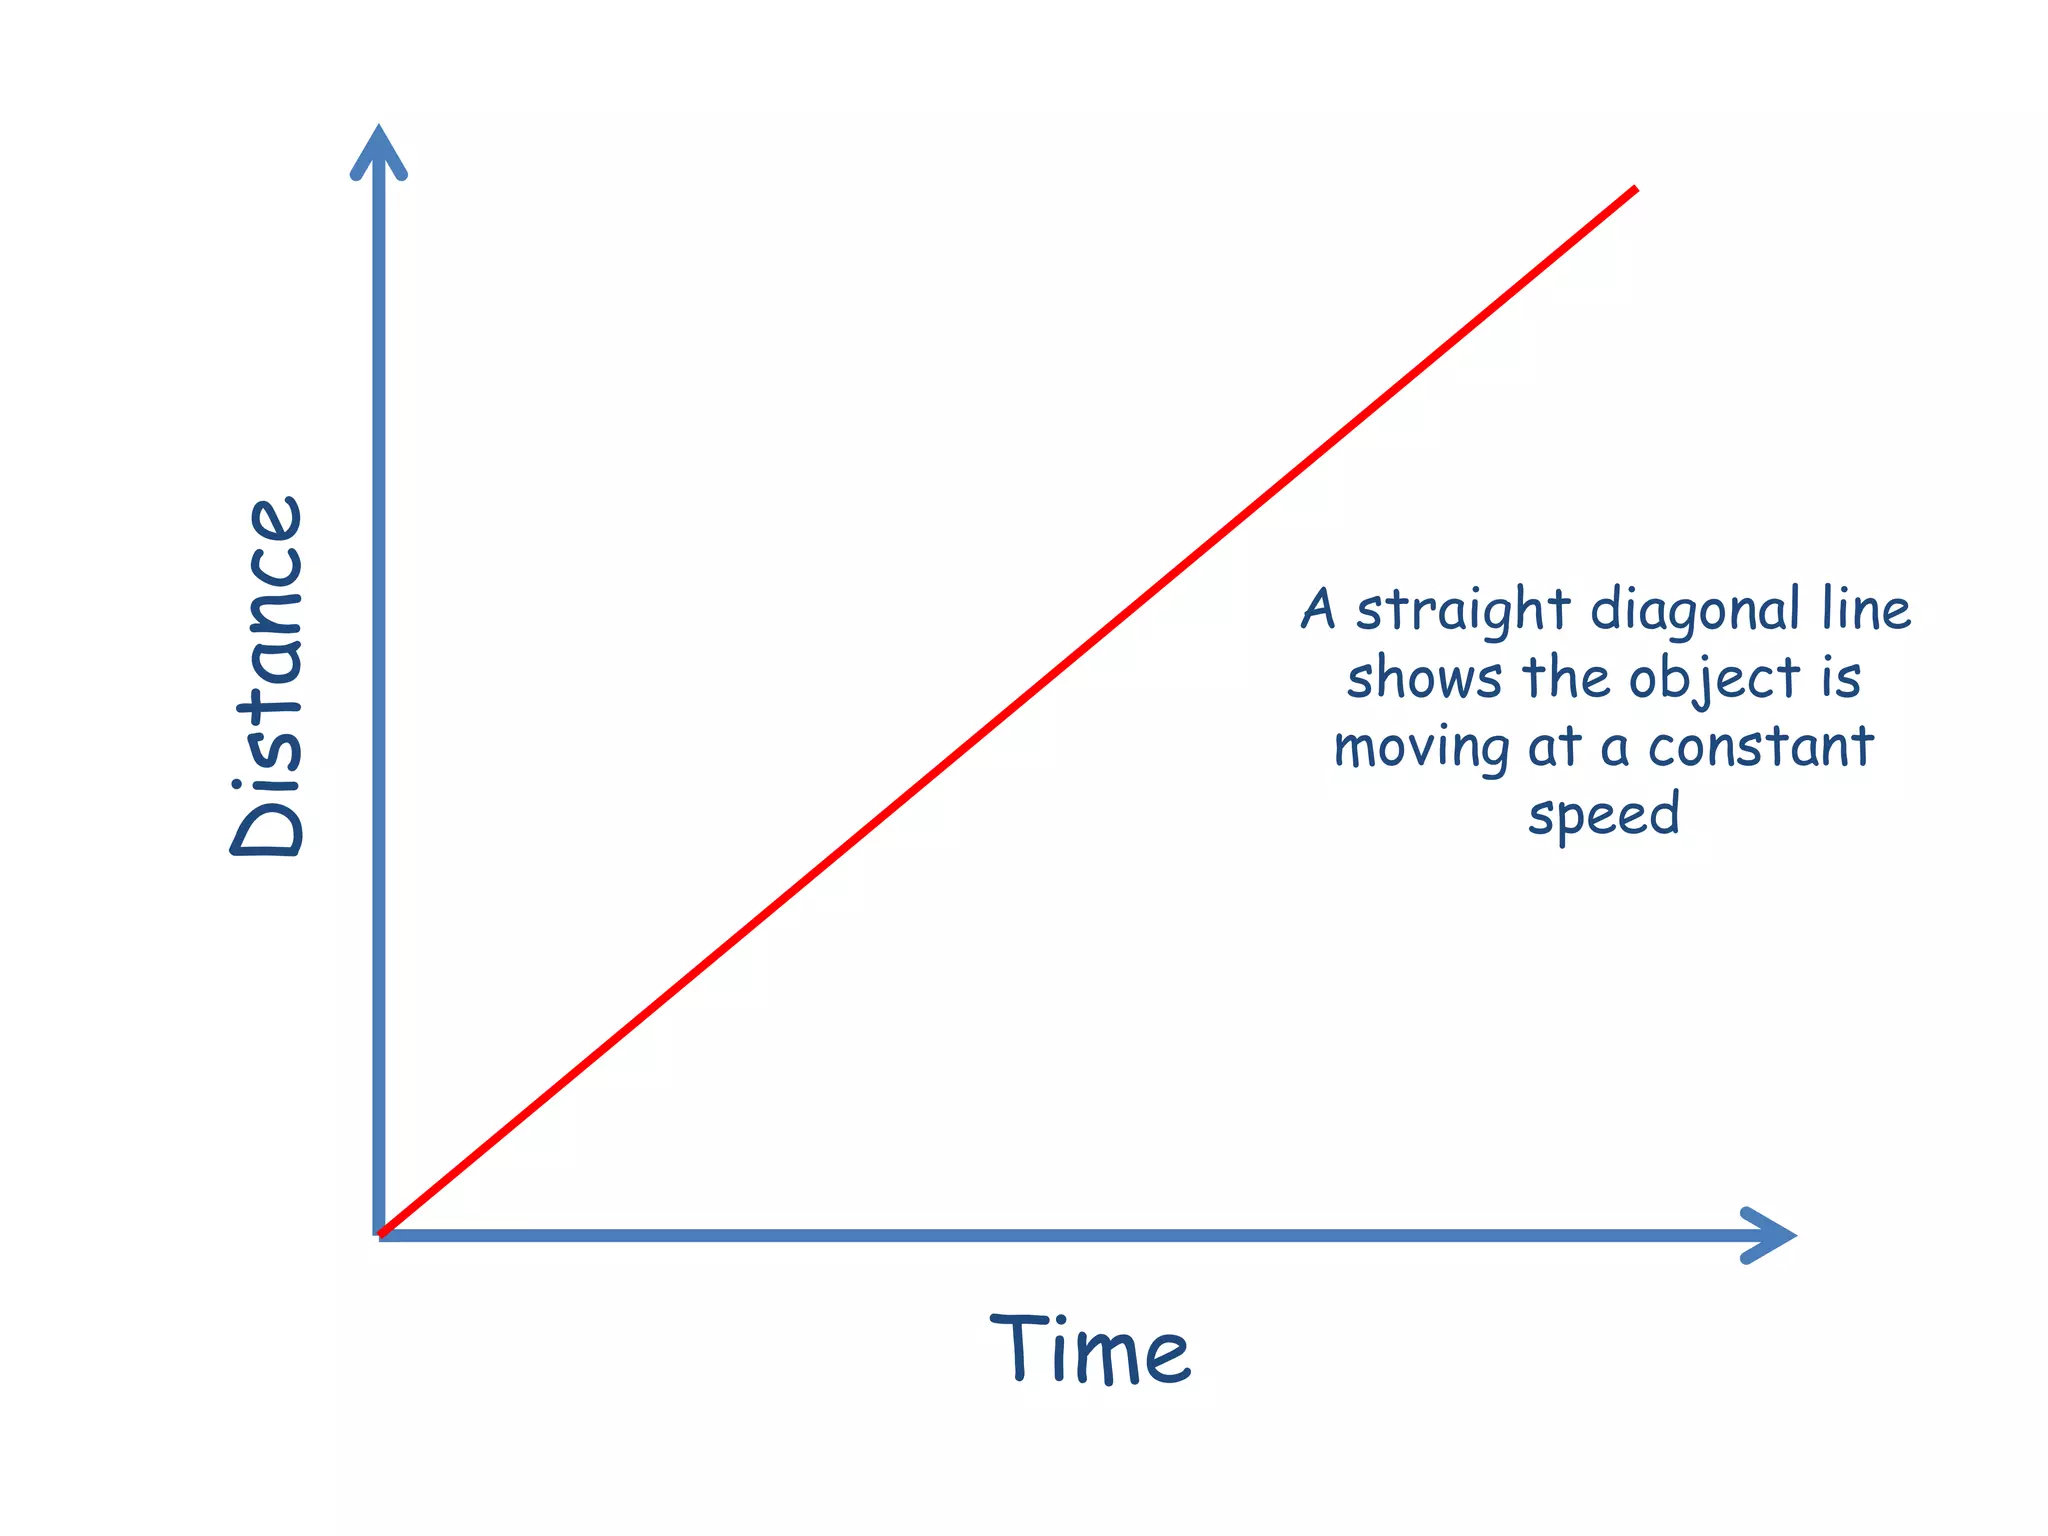
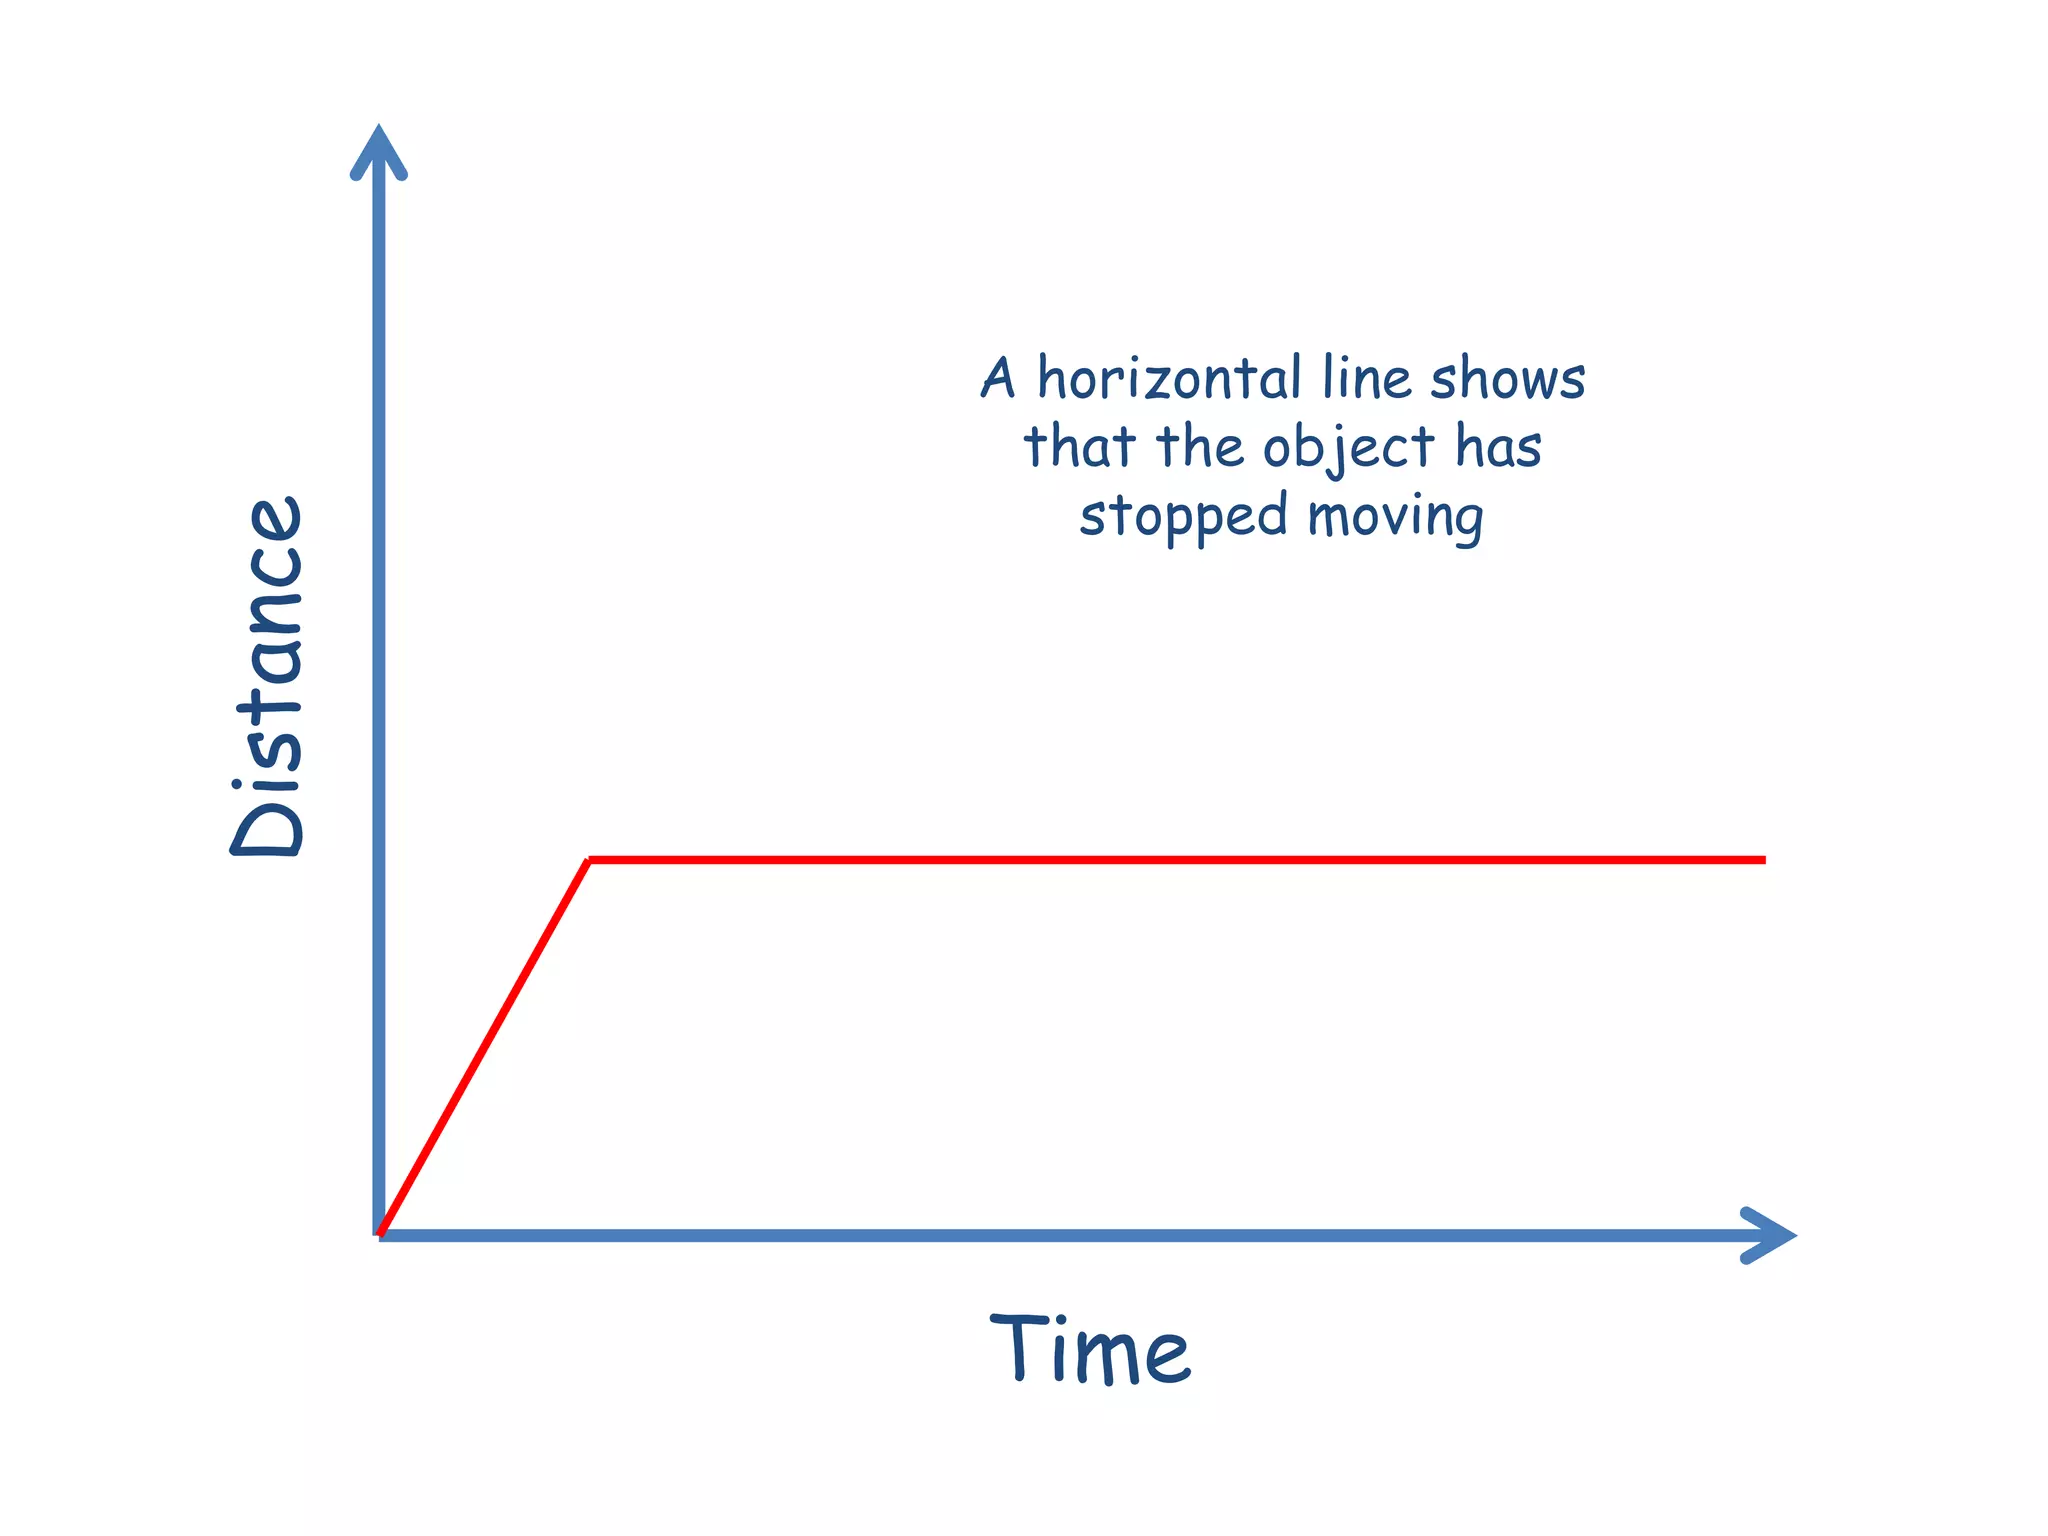
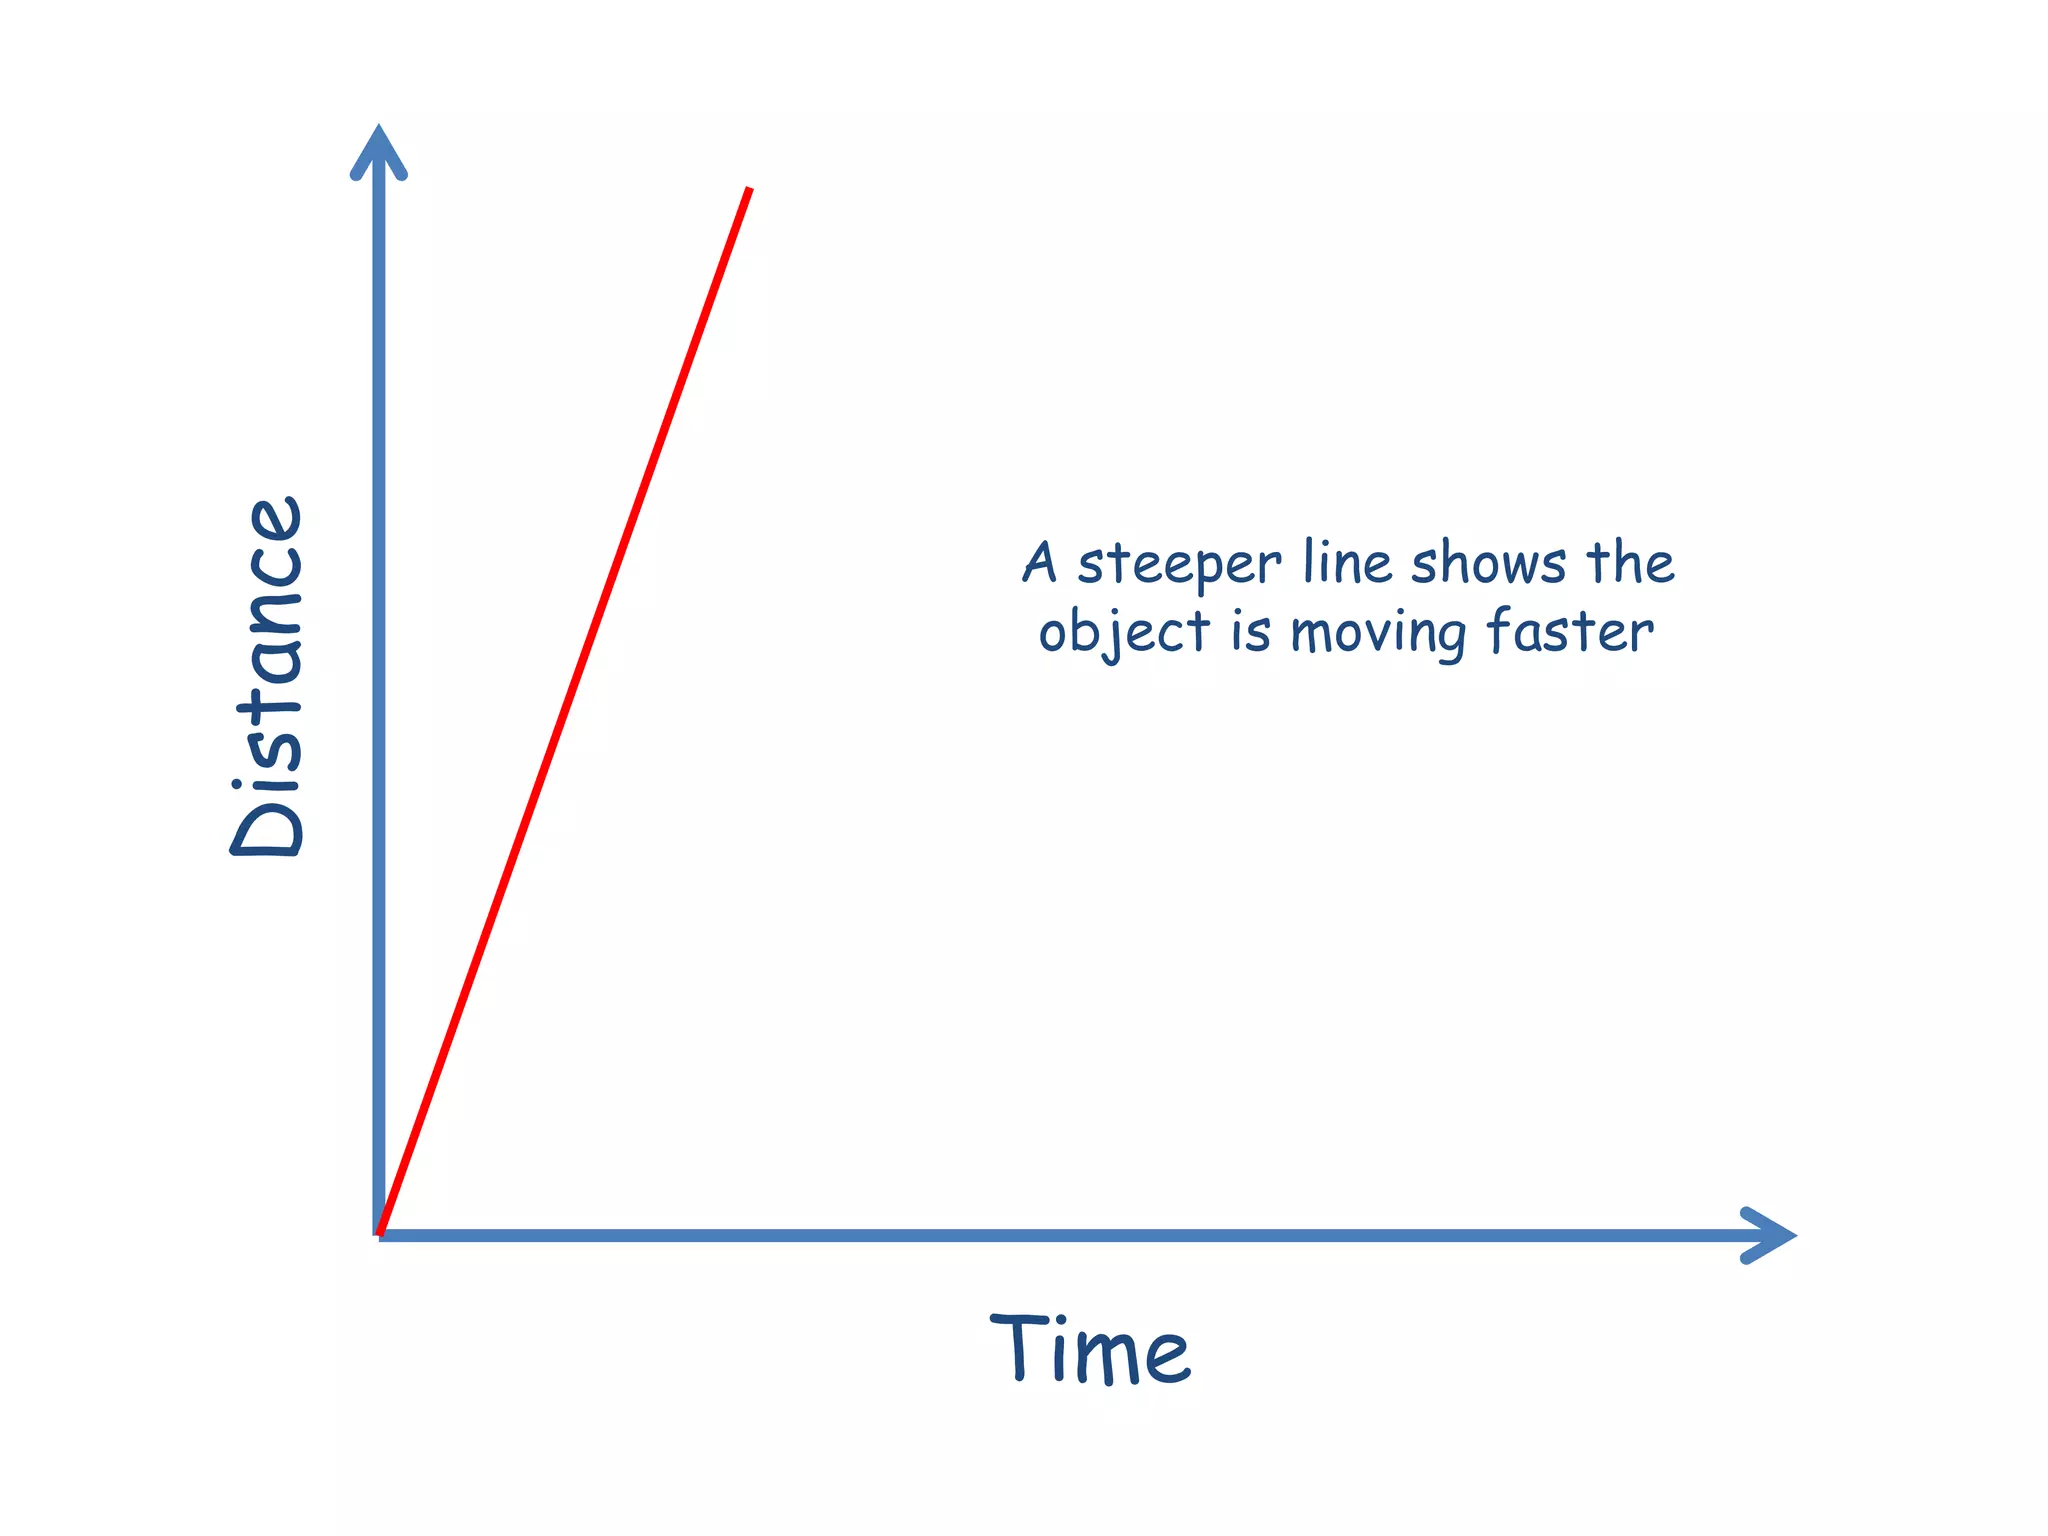
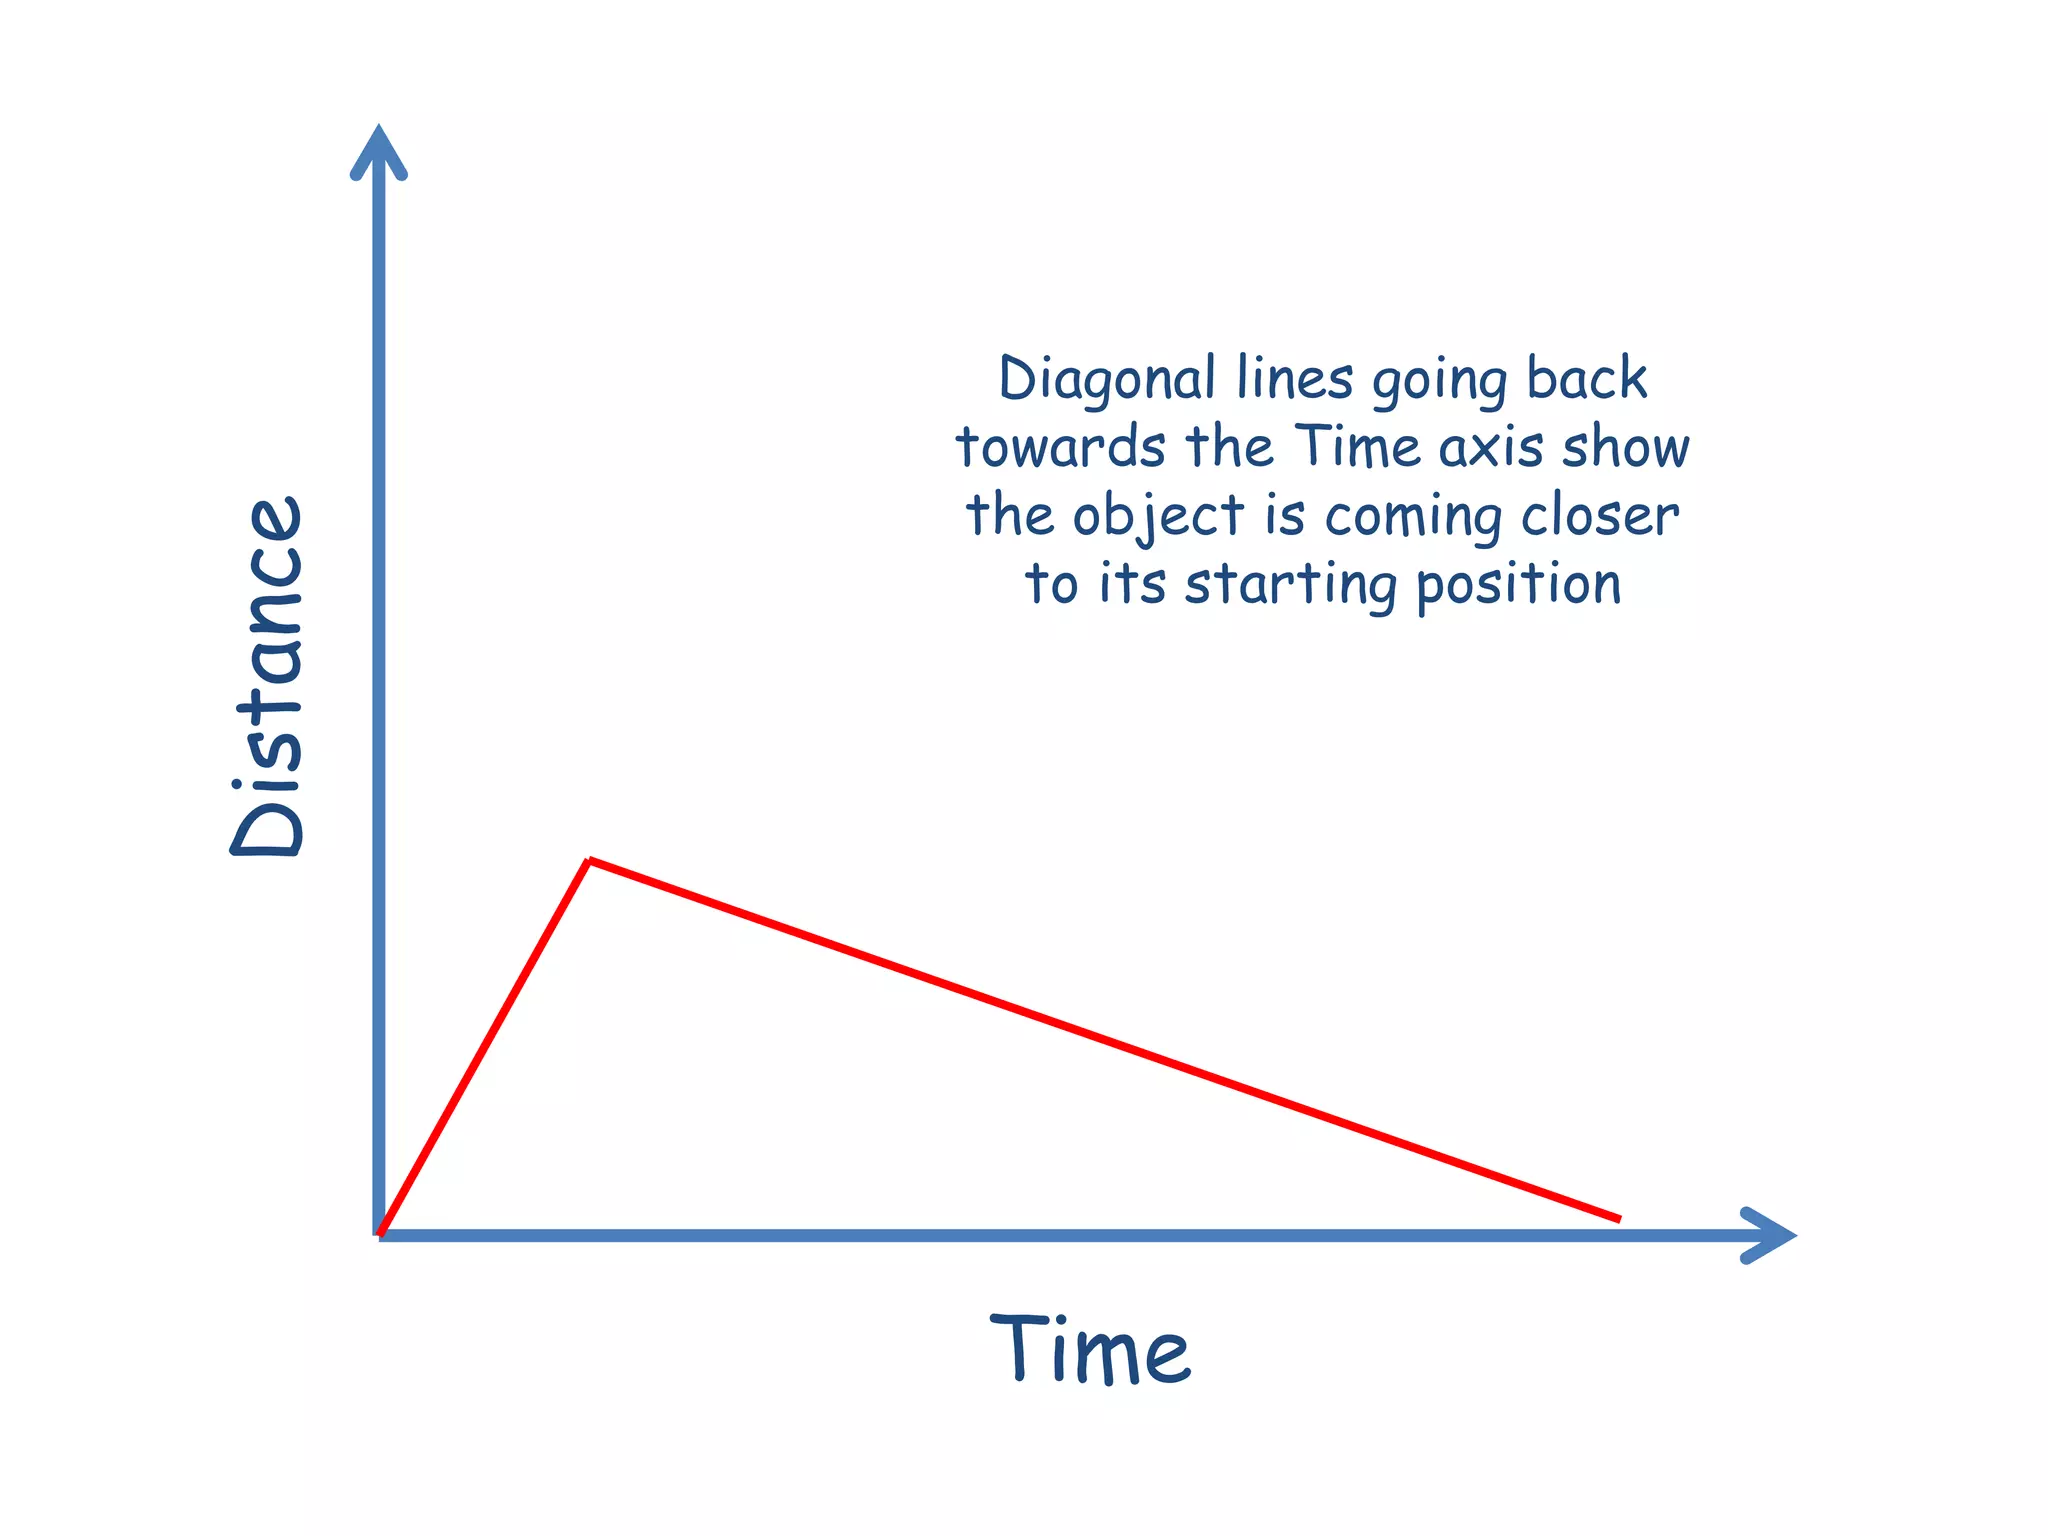
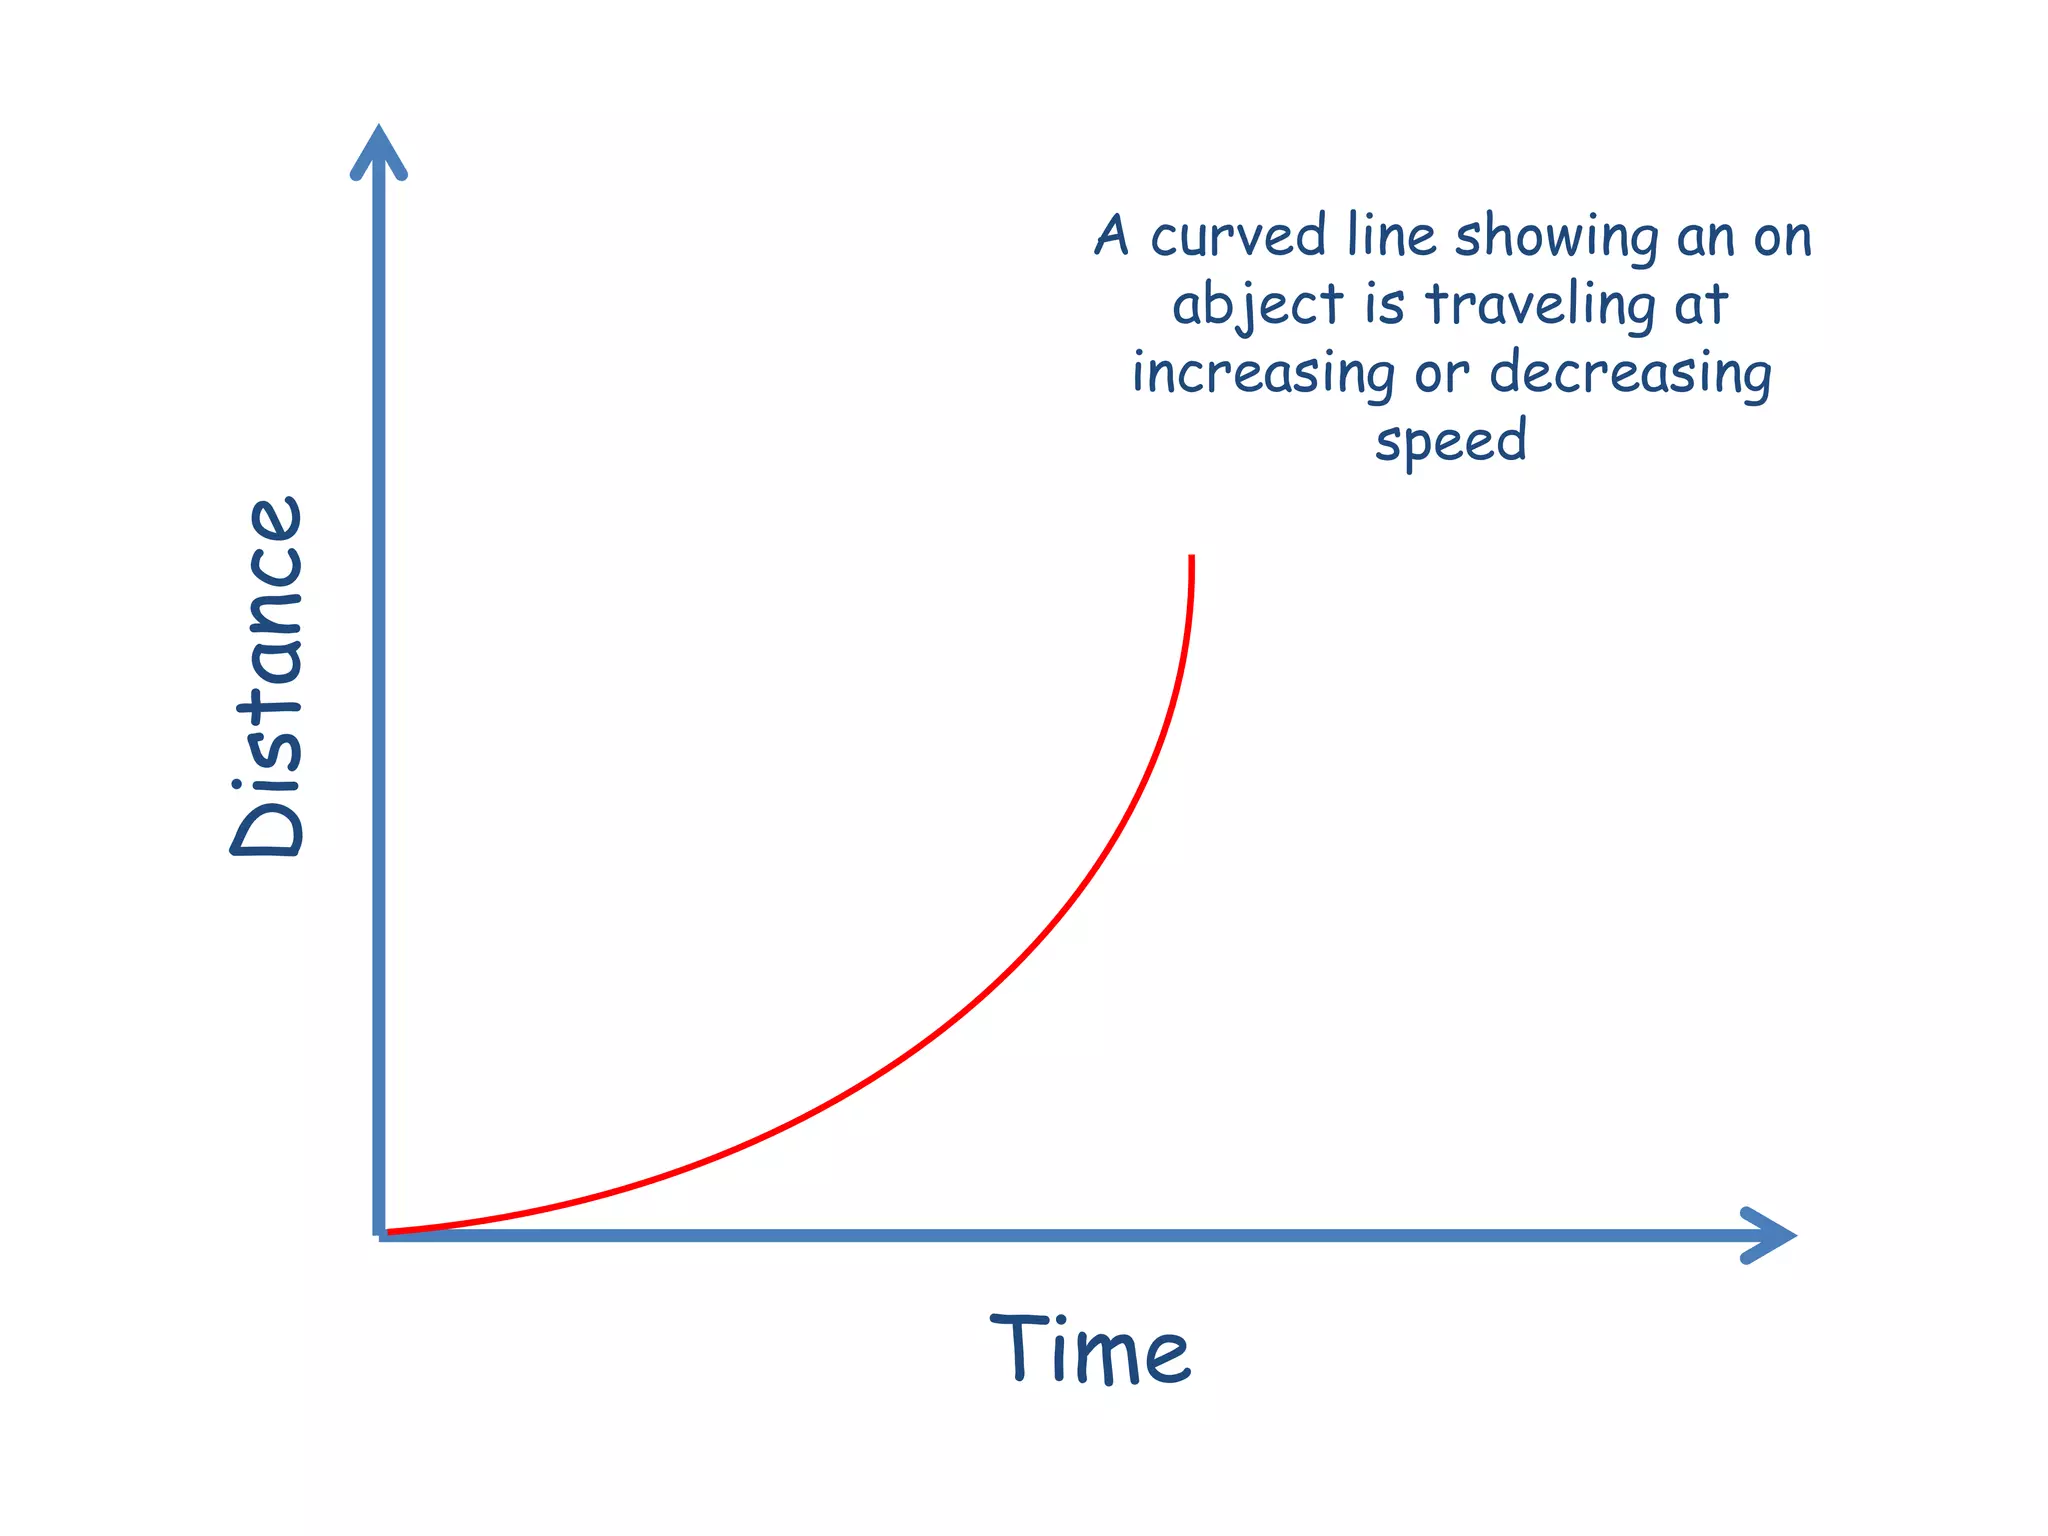
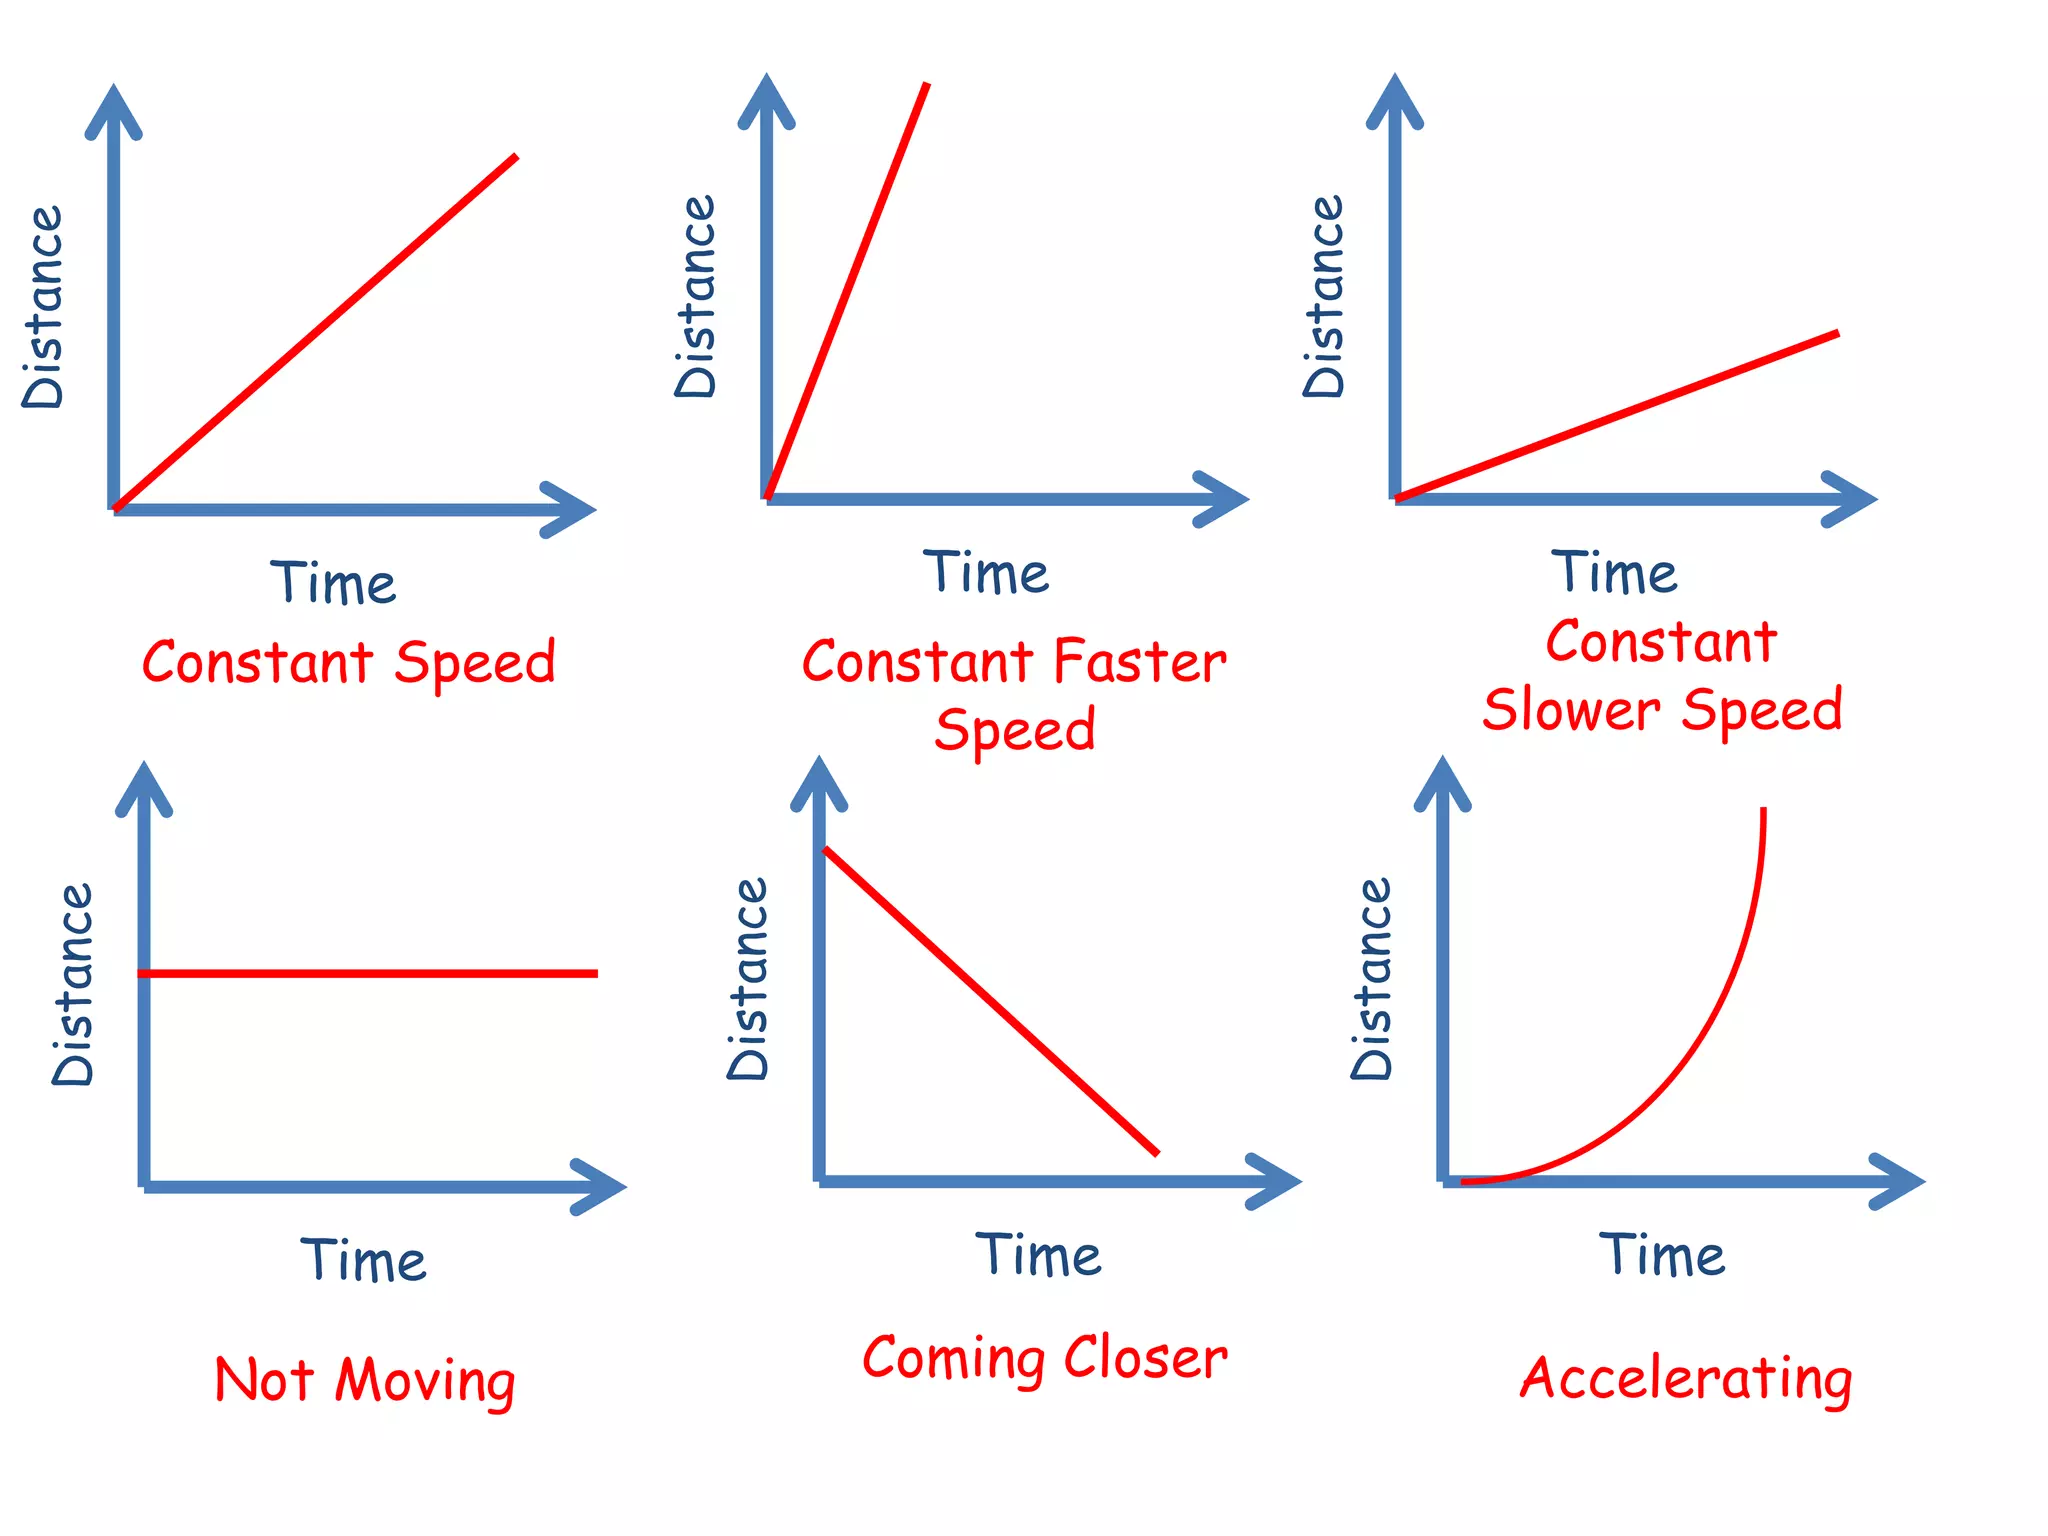
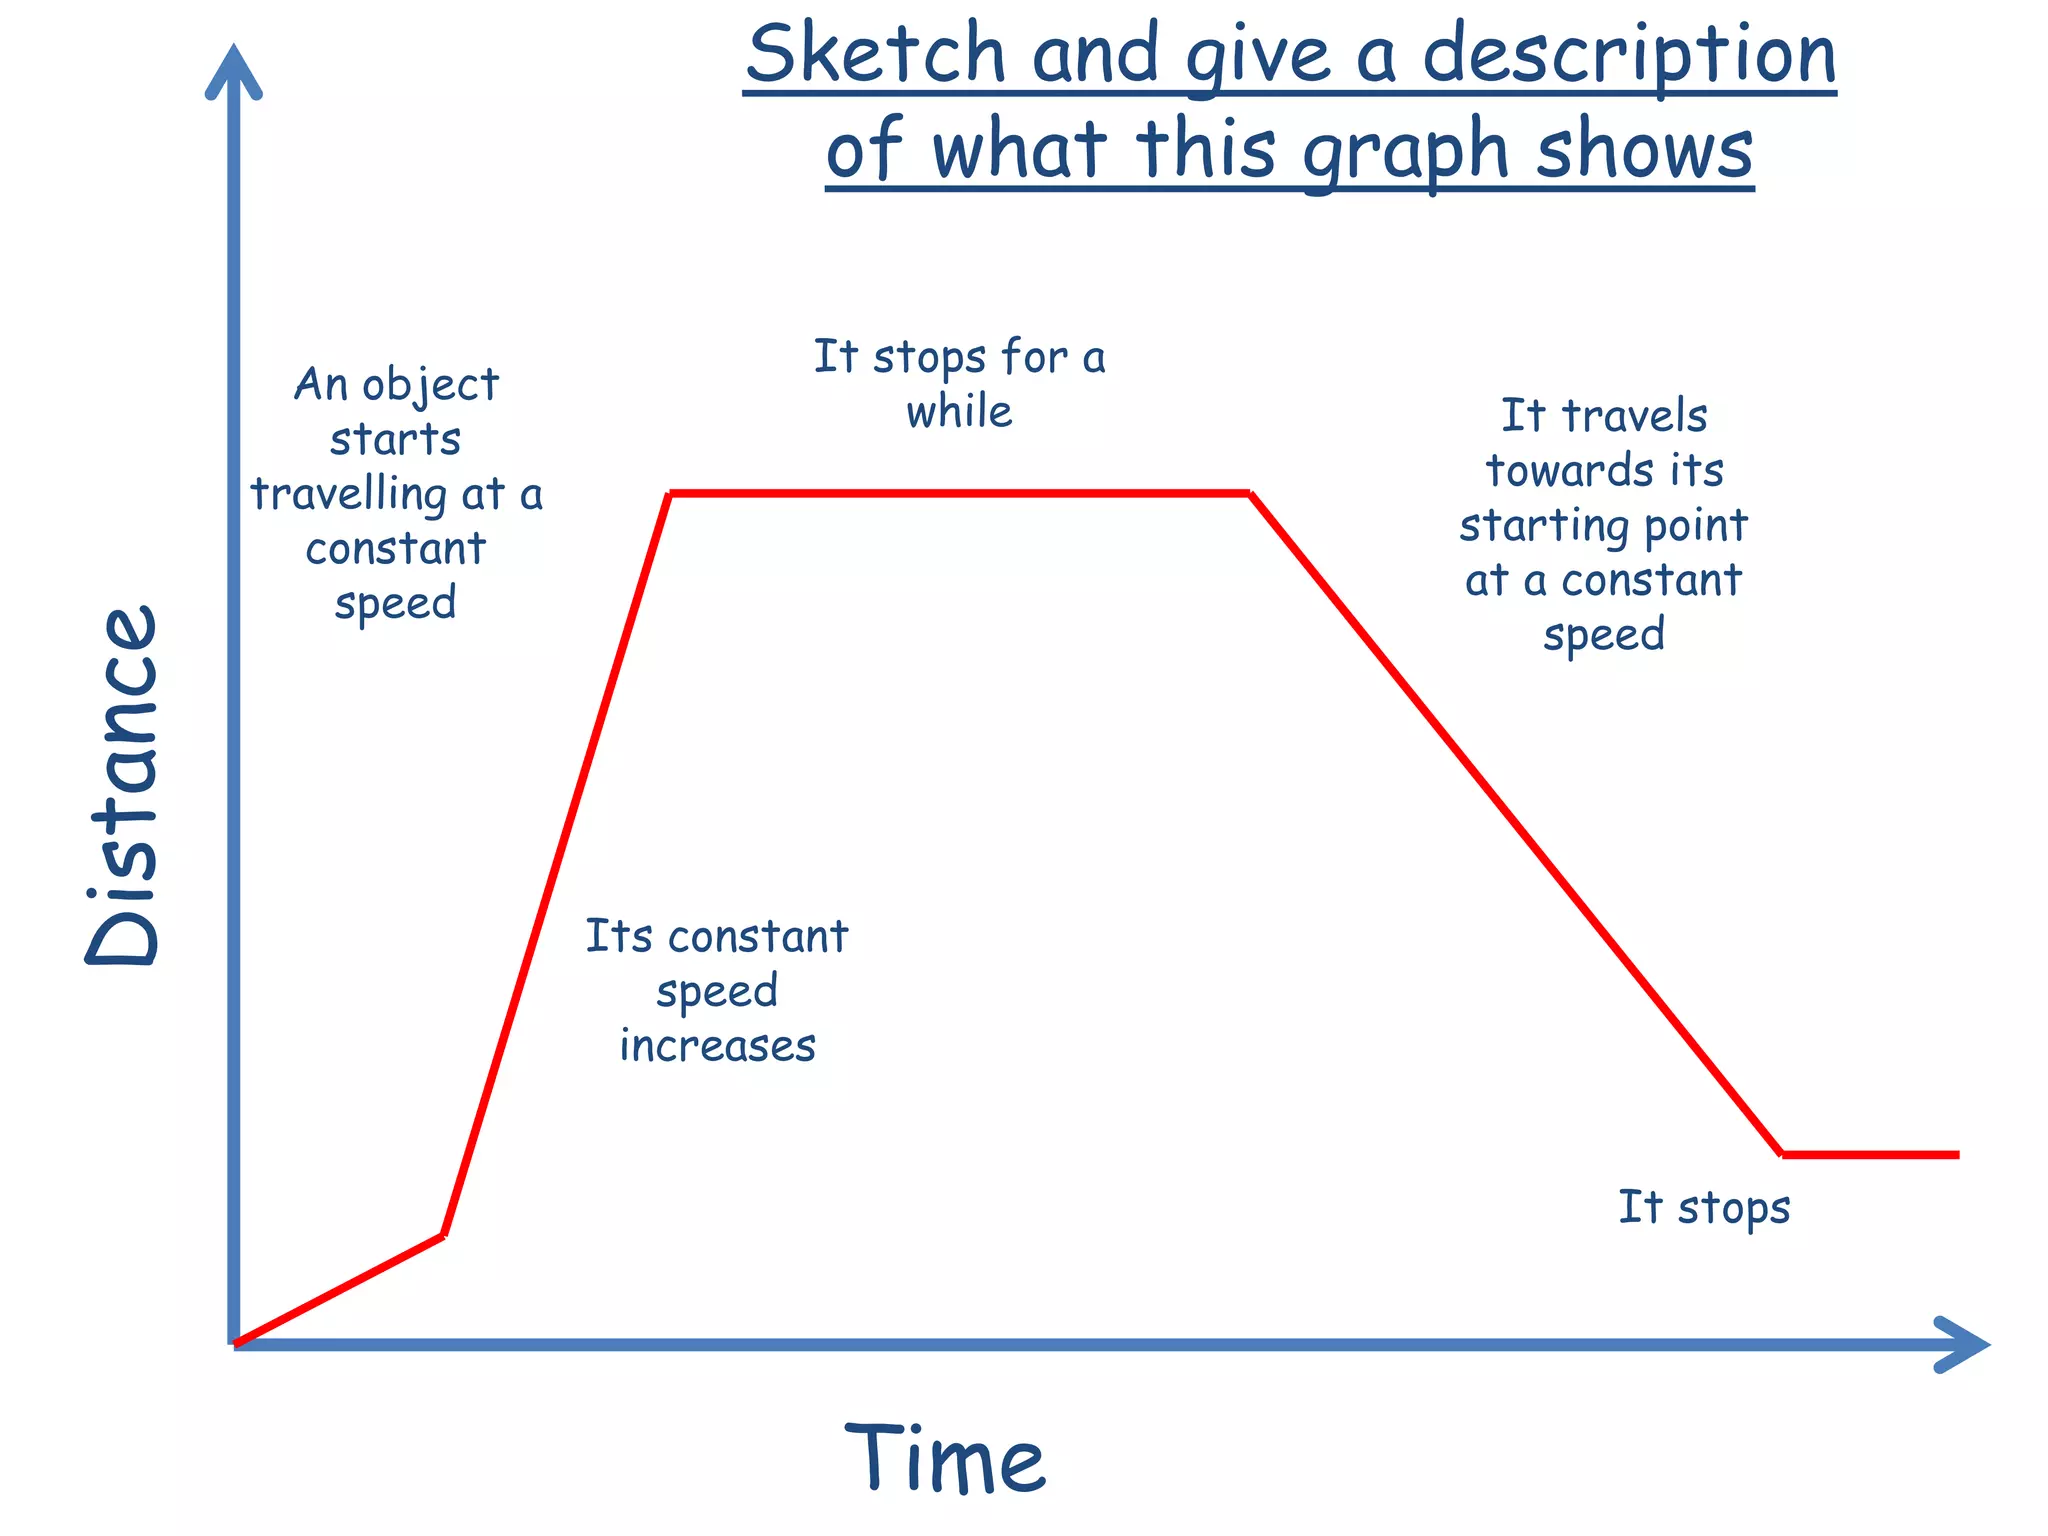
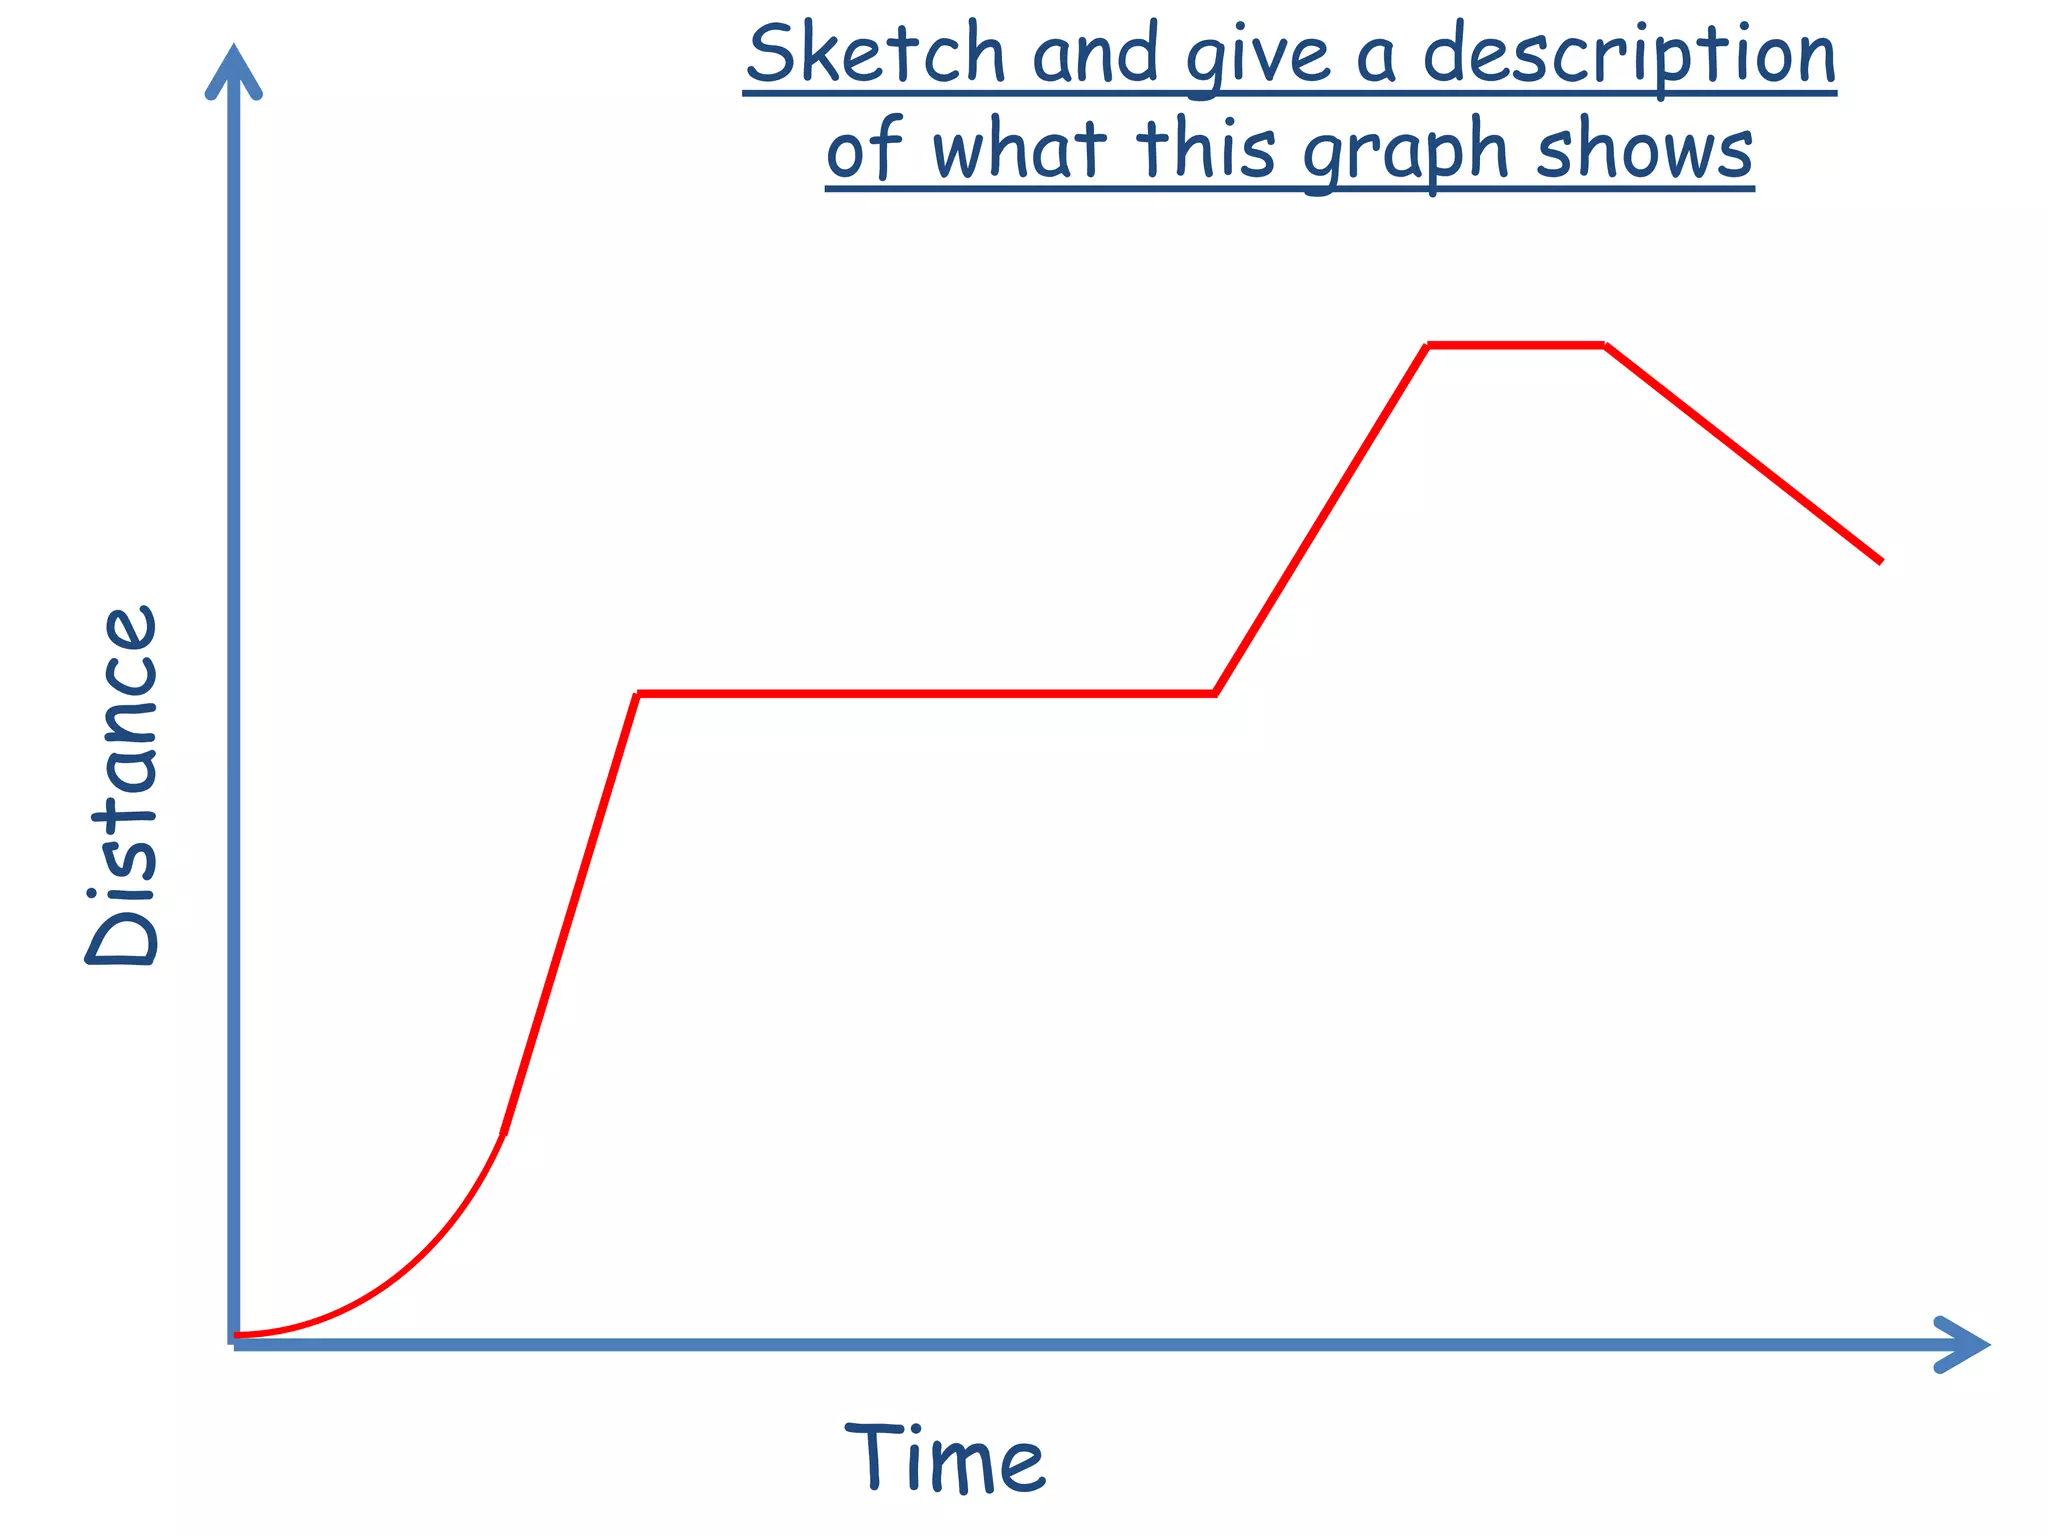
- Common line patterns on graphs and what they represent about an object's motion (e.g. diagonal lines = constant speed; horizontal lines = stopped)
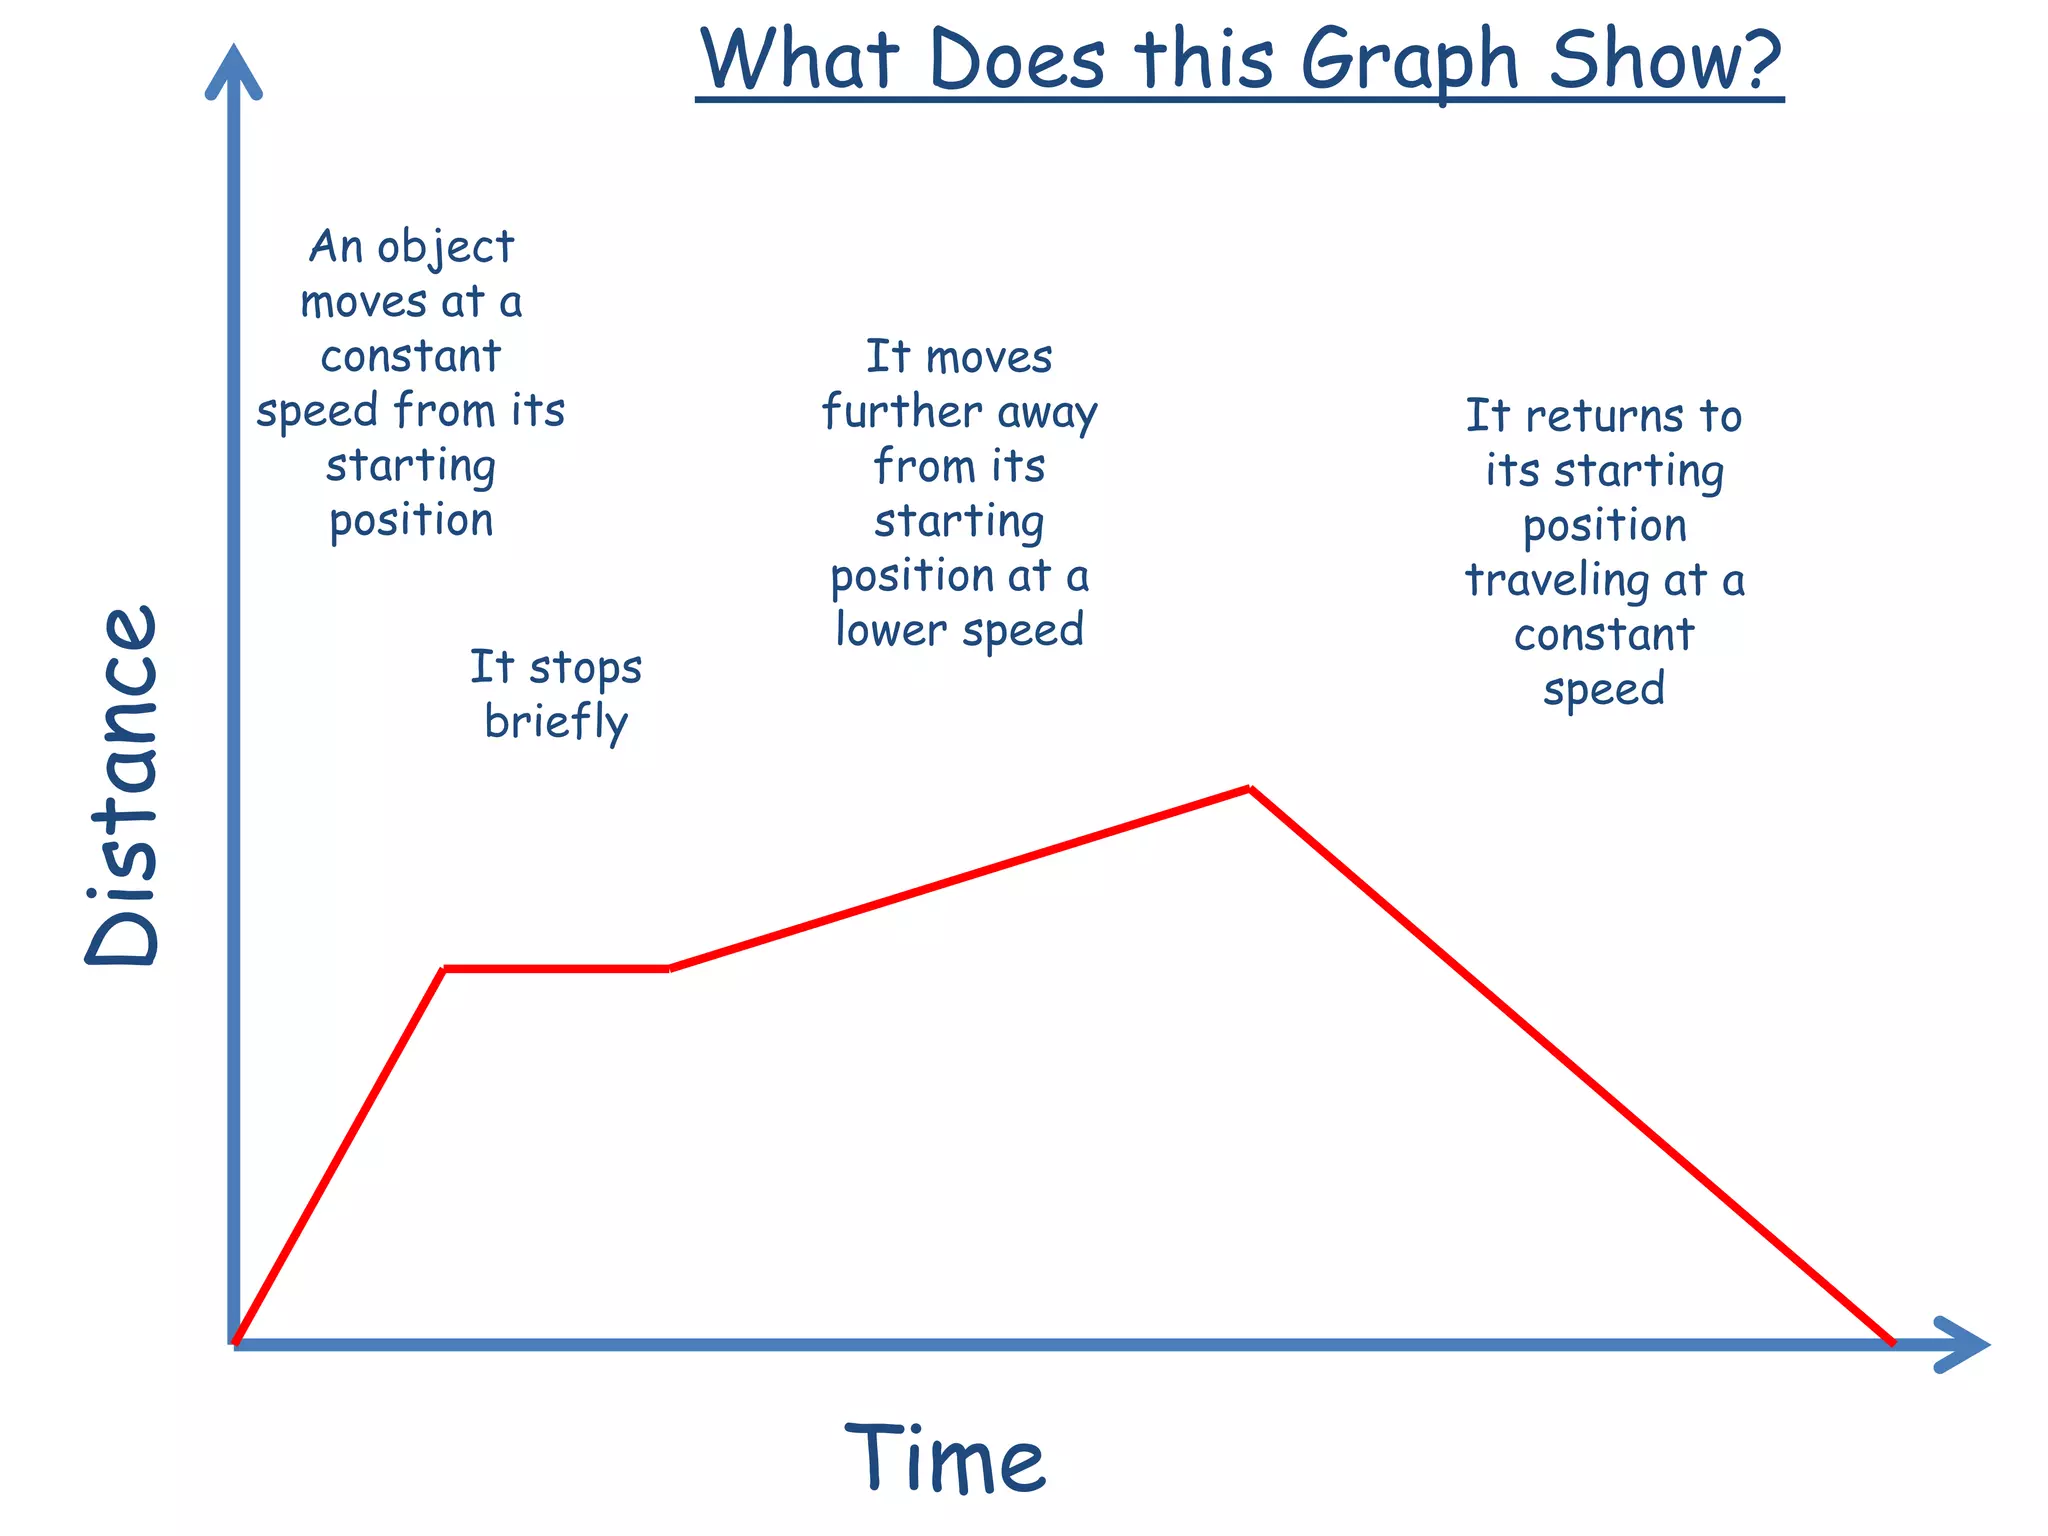
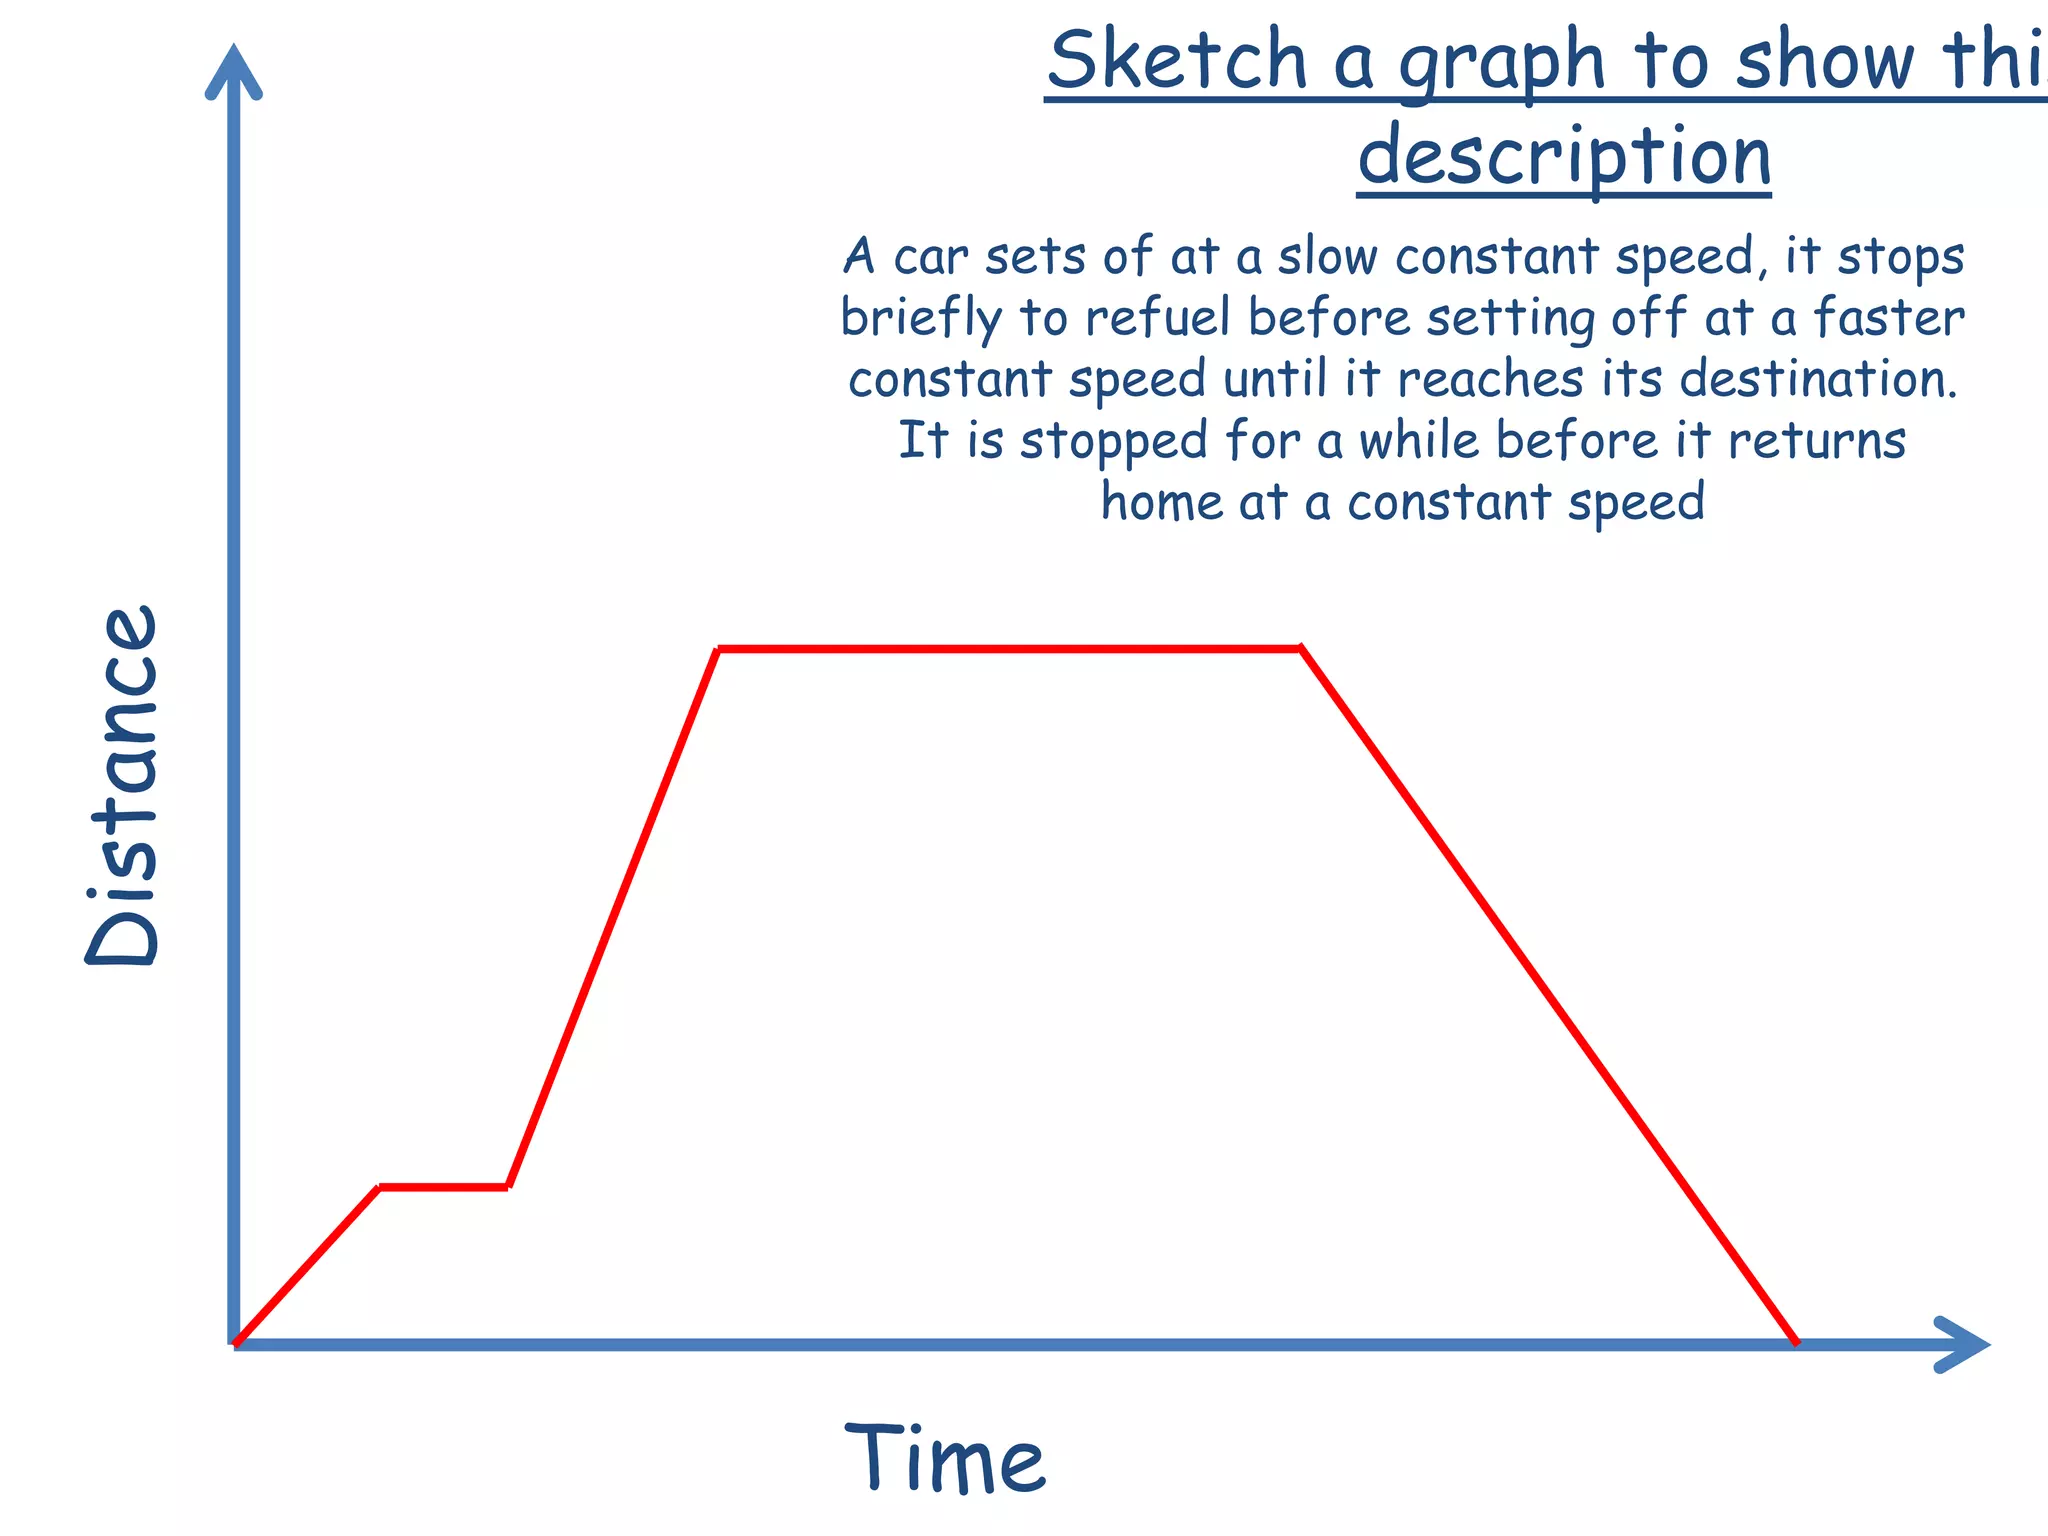
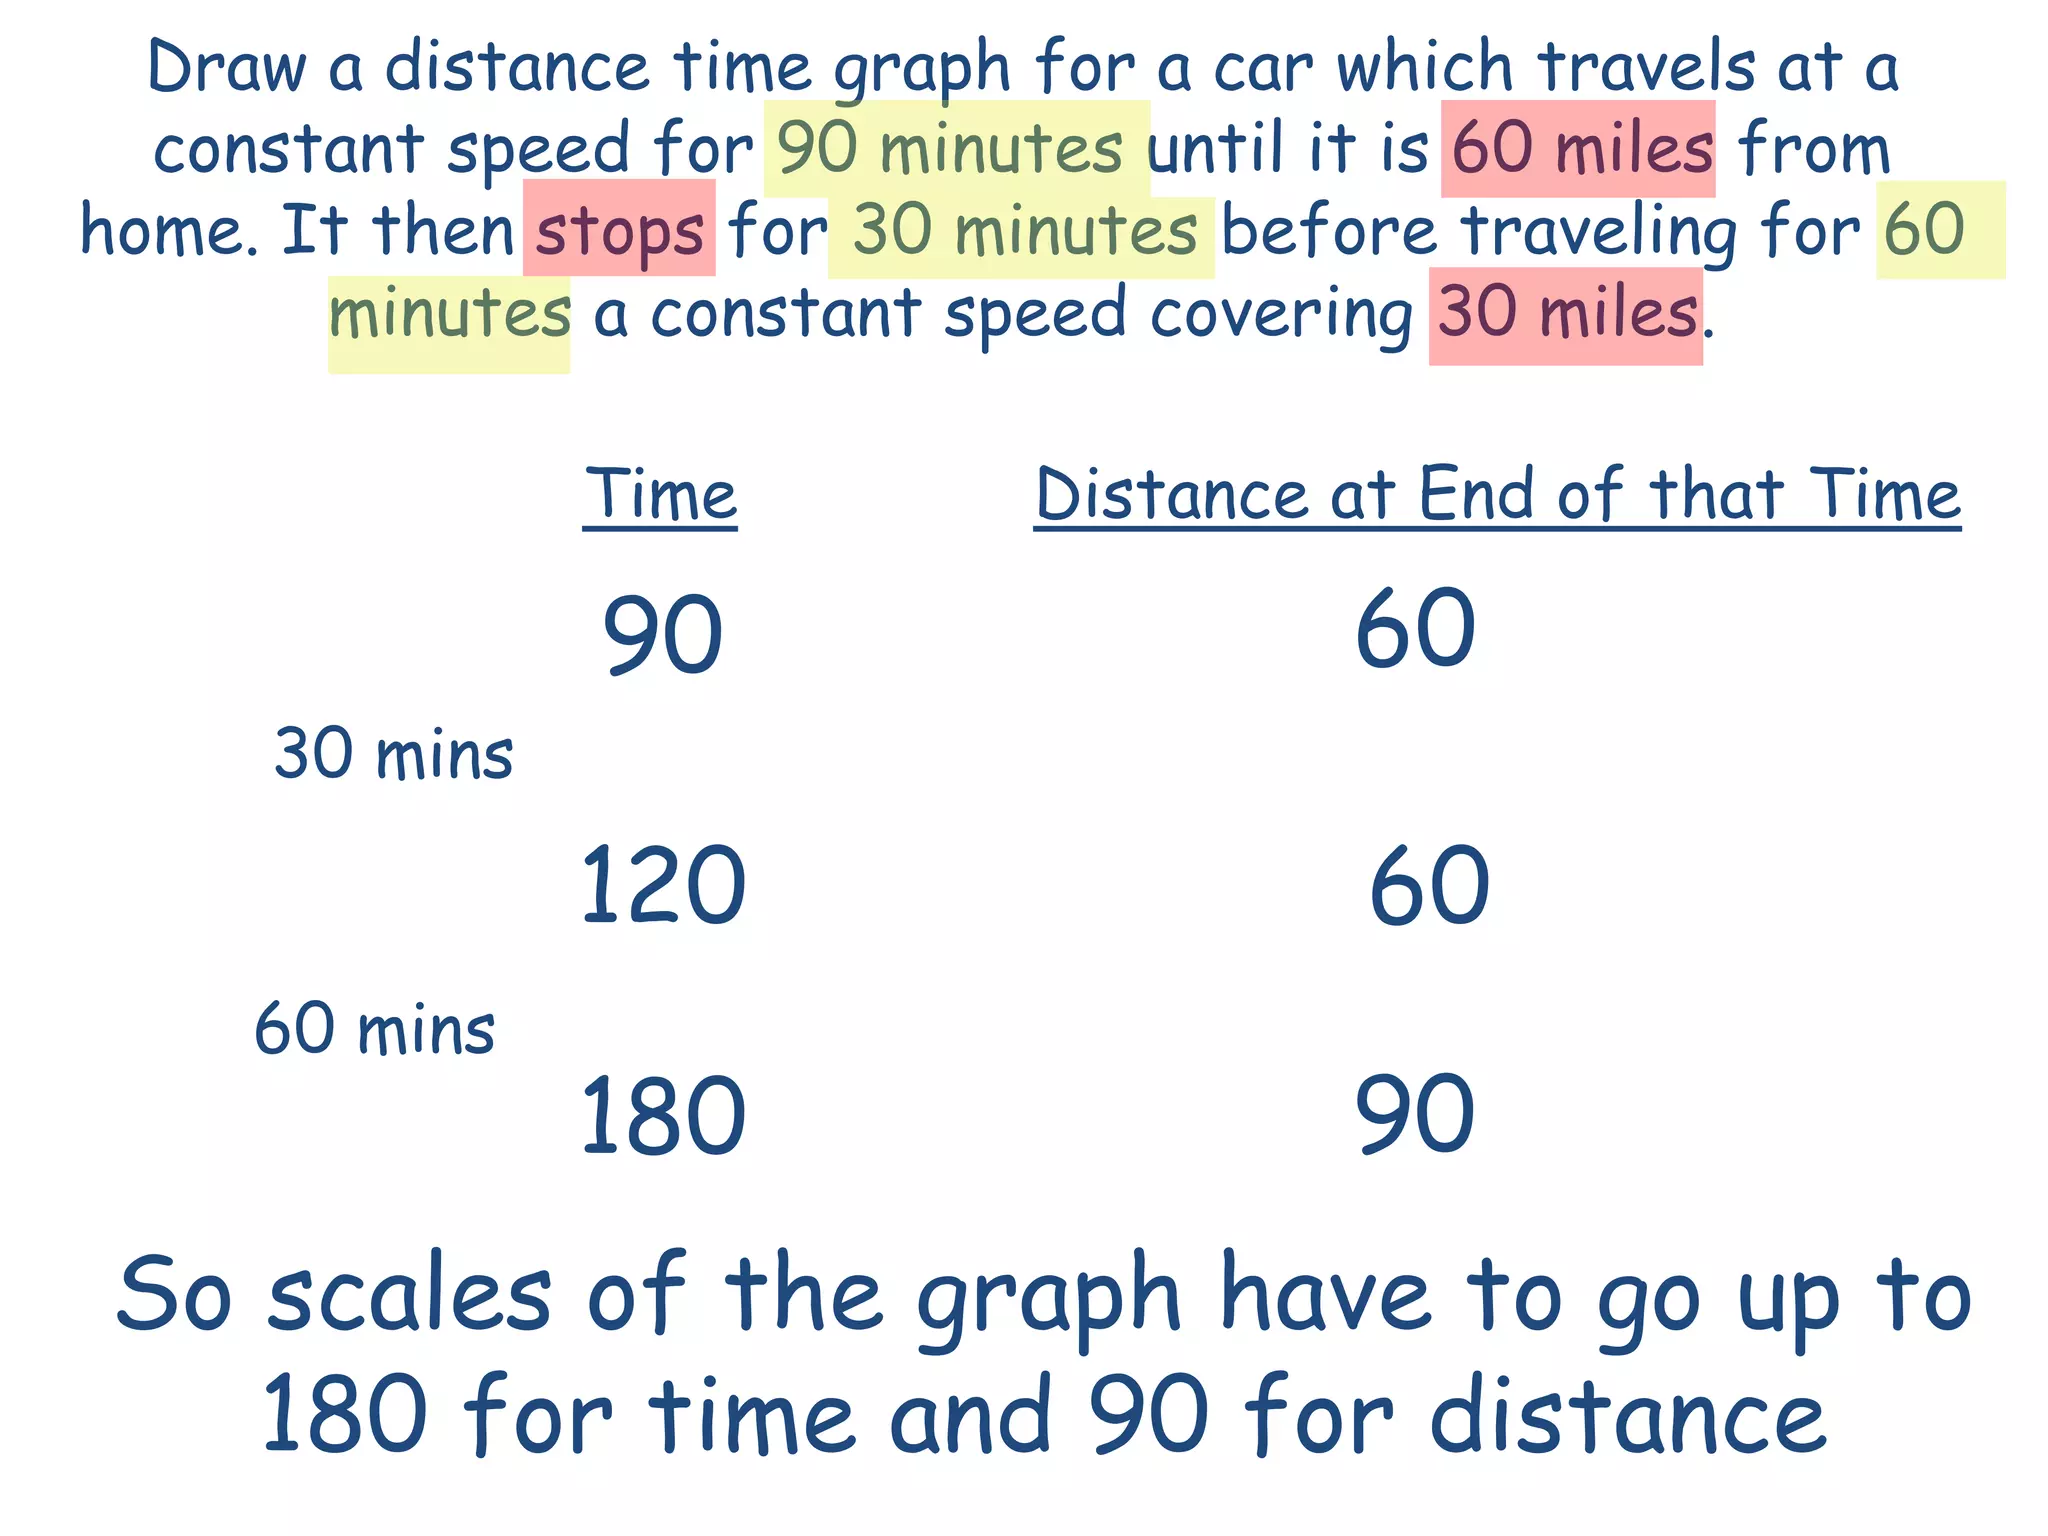
- Examples of distance-time graphs and descriptions of the motion they depict
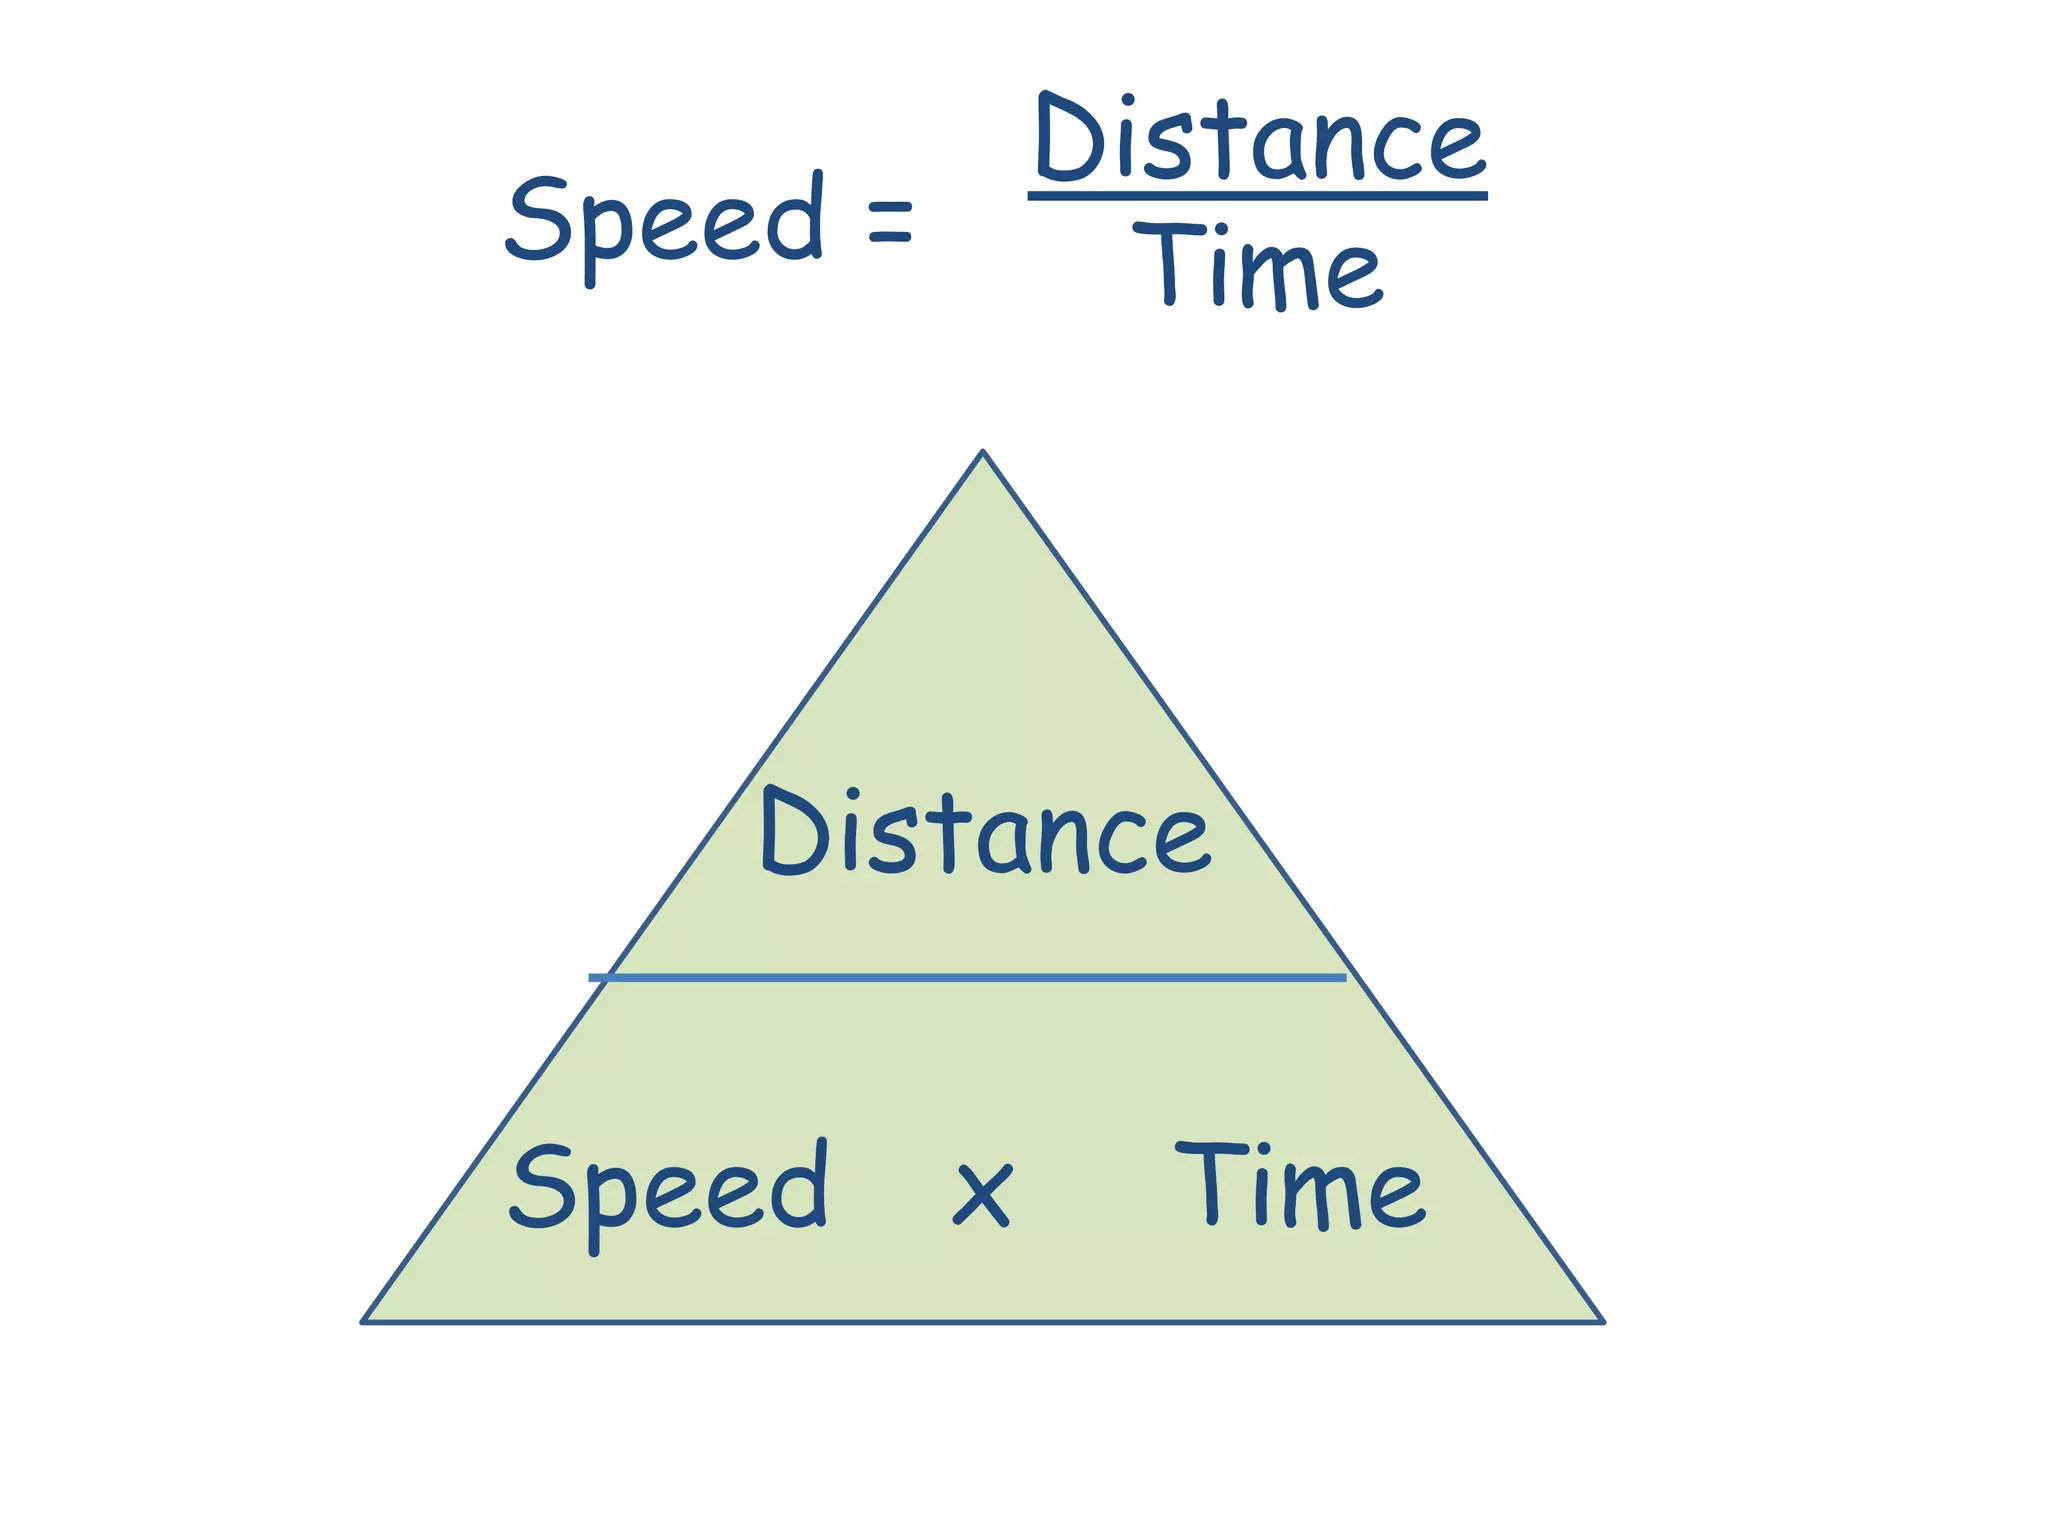
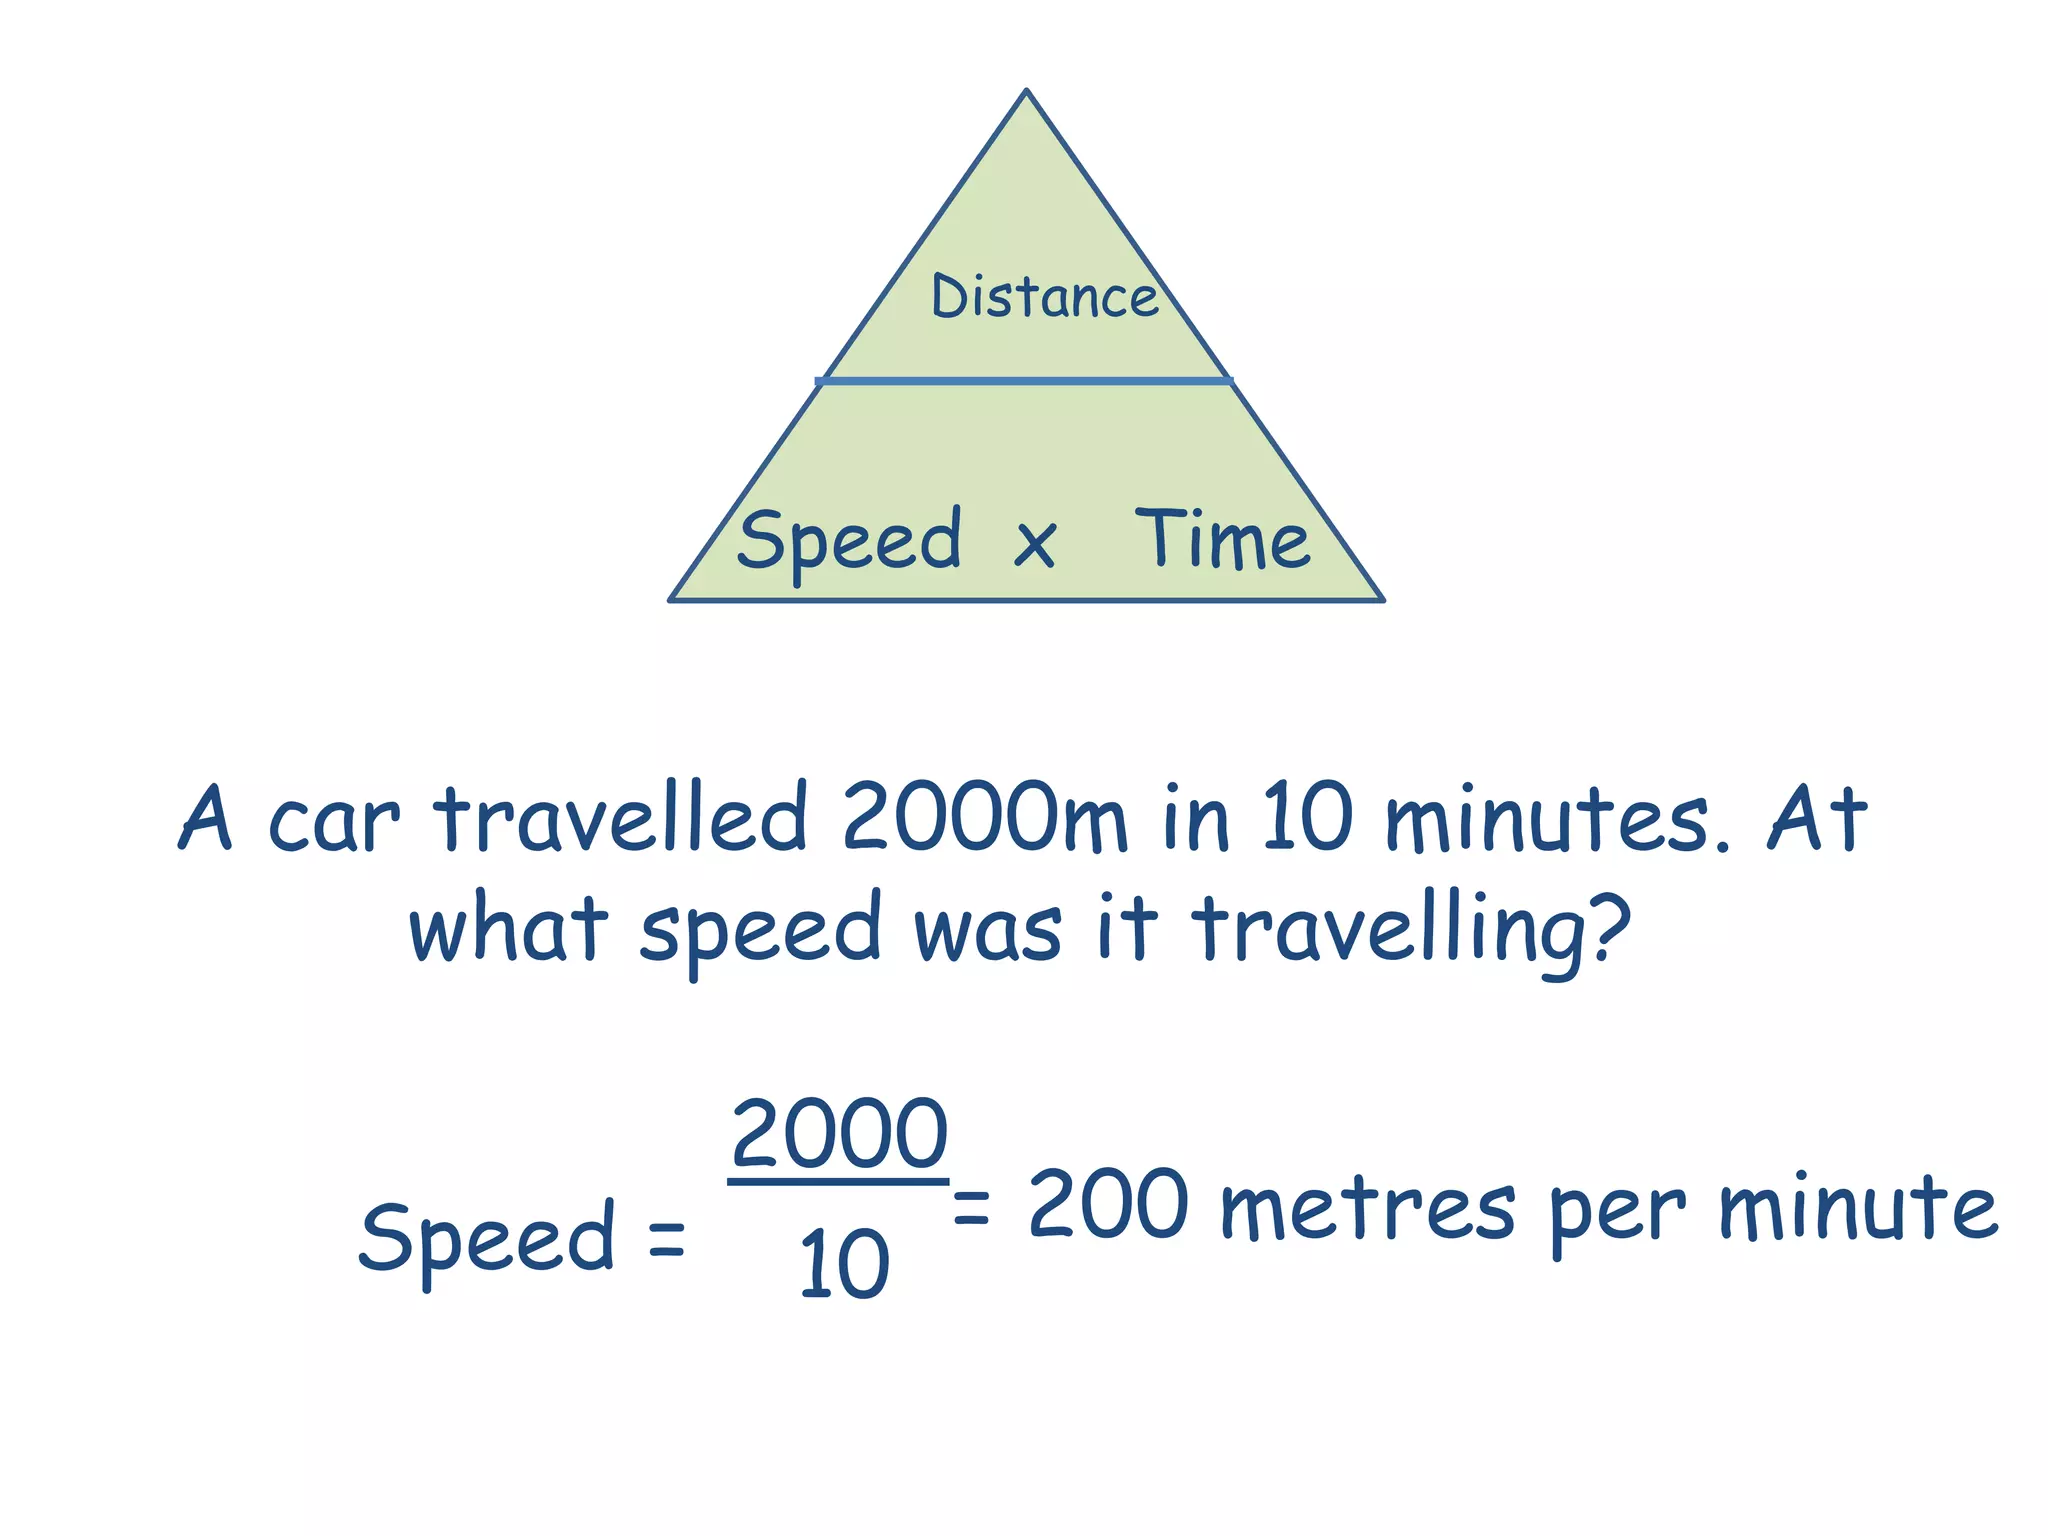
- How to calculate speed from a distance and time
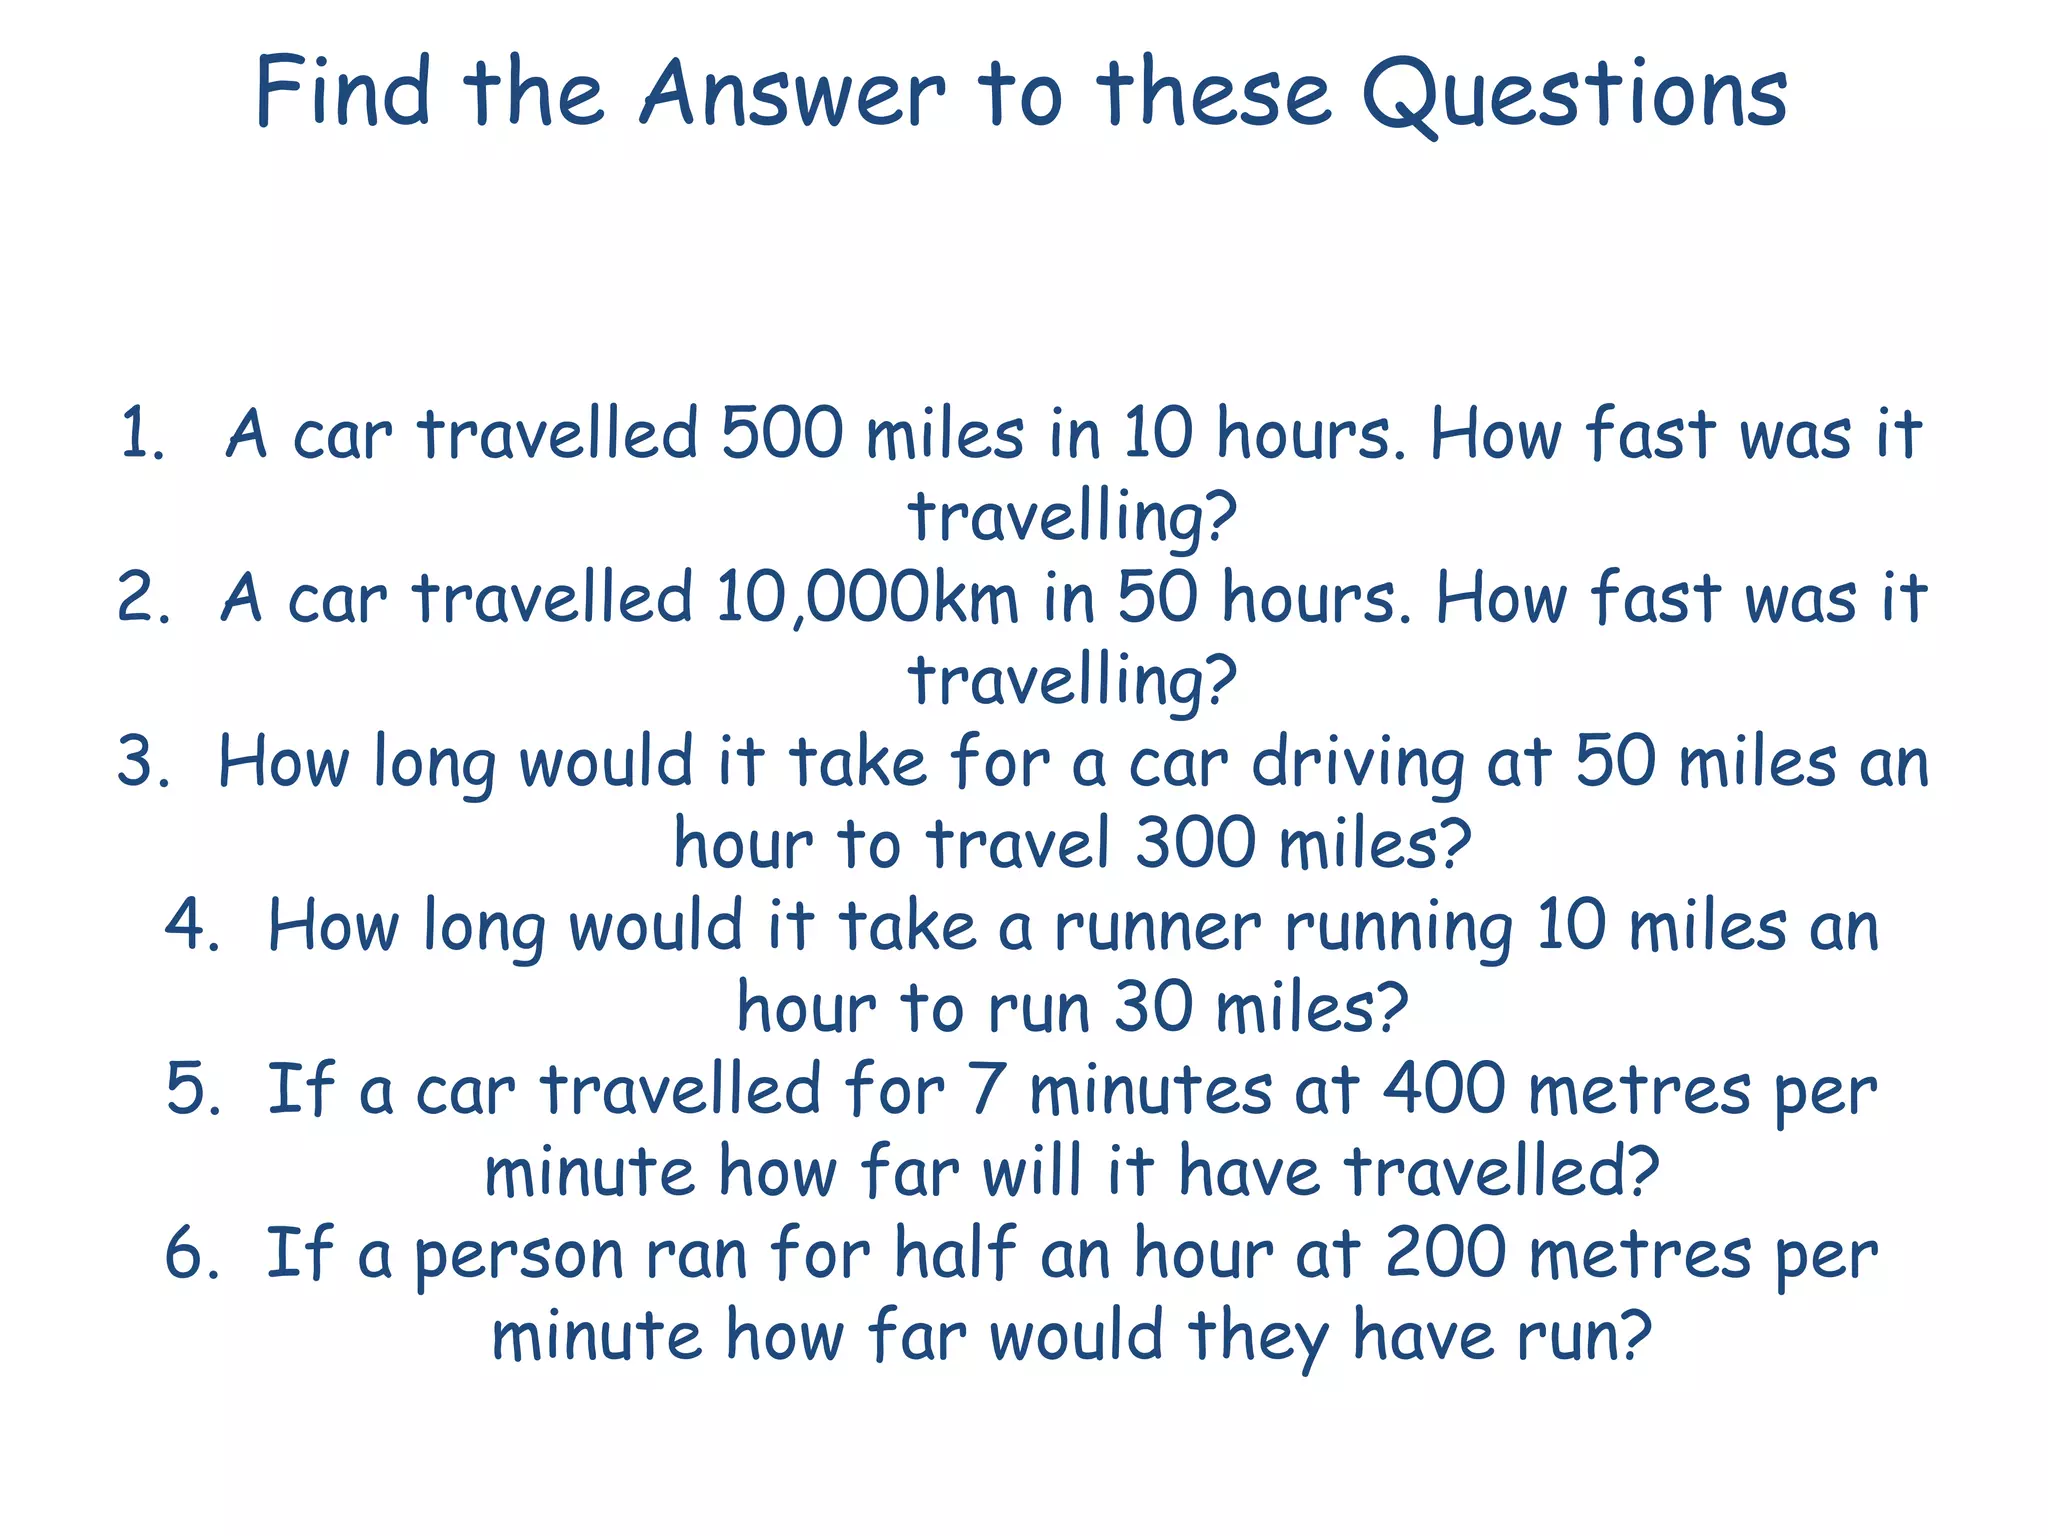
- Practice questions calculating speed and time from distances traveled