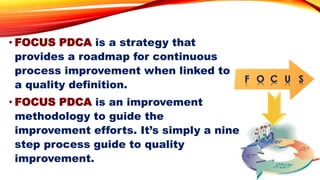
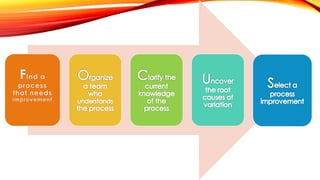
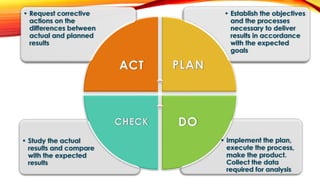
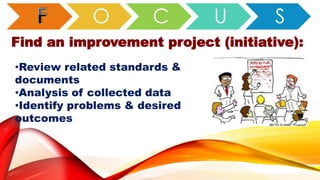
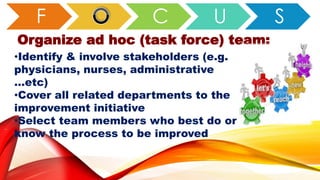
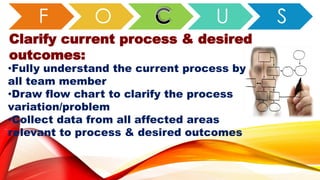
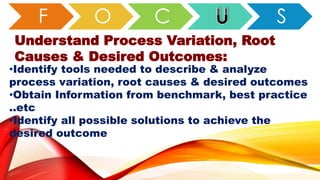
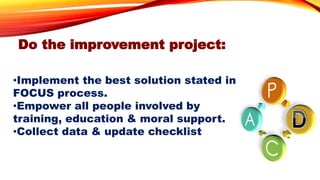
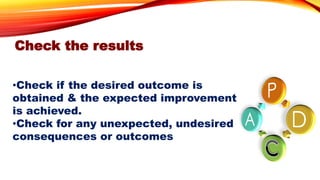
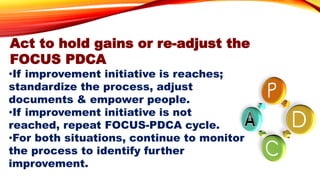
DR. MANAL ELSAYED ABDELAZIZ
B.Sc.Pharm, CPHQ, DTQM, CLSSGB
• FOCUS PDCA is a strategy that
provides a roadmap for continuous
process improvement when linked to
a quality definition.
• FOCUS PDCA is an improvement
methodology to guide the
improvement efforts. It’s simply a nine
step process guide to quality
improvement.
O C U S
Find an improvement project (initiative):
•Review related standards &
documents
•Analysis of collected data
•Identify problems & desired
outcomes
C U S
Organize ad hoc (task force) team:
•Identify & involve stakeholders (e.g.
physicians, nurses, administrative
…etc)
•Cover all related departments to the
improvement initiative
•Select team members who best do or
know the process to be improved
O U S
Clarify current process & desired
outcomes:
•Fully understand the current process by
all team member
•Draw flow chart to clarify the process
variation/problem
•Collect data from all affected areas
relevant to process & desired outcomes
O C S
Understand Process Variation, Root
Causes & Desired Outcomes:
•Identify tools needed to describe & analyze
process variation, root causes & desired outcomes
•Obtain Information from benchmark, best practice
..etc
•Identify all possible solutions to achieve the
desired outcome
•The cause-and-effect diagram is a tool
generally used to gather all possible causes as
an overview, The ultimate goal being to uncover
the root cause of a problem.
•The diagram is a visualization of relationships
between the outcome of a particular process,
the major categories of that process and causes
and sub causes.
• Steps:
Define the problem (effect) to
be solved.
Identify the key causes of the
problem or event.
Identify the reasons behind
the key causes.
Identify the most likely
causes.
++ CPR Failure
Rates
Place
Patient
Personnel
PoliciesEquipement
Lack of Training (ACLS)
Shortage of staff (Anesthesia)
Improper scheduling (Anesthesia)
Incorrect Policy
Poor compliance to the policy (Not
all the team attend the CPR Incident)
Dead On Arrival included
In the measurement
Crash Carts
Mal-distribution
Crash carts Policy
Not Followed (Open all
The time).
Lack of PPM of
Defibrillators
Lack of regular checks
On supplies
Lack of Bleeps
Missing Crash Carts
Nurse Shortage
Pharmacist
Shortage
Materials
Lack of Medications
No Numerical Locks
A Pareto chart, named after Vilfredo Pareto, It
Separates the "VITAL FEW" from the "USEFUL
MANY" (Pareto Principle) . It helps make our
improvement work effective and efficient.
•It’s a data based tool to answer this question:
Which variables out of many are occurring most?
Which variables of causes should we focus on?
20% EFFORT GIVING 80% RESULT
1 • Choose a problem to study
2 • Choose categories/ causes
3 • Select a unit of measure
4 • Choose a time period
5 • Gather data
6 • Compare data
7 • Construct a chart
8 • Show cumulative percents
9 • Interpret the results
O C U
Select the best practice procedure:
•Choose the best solution that will achieve desired
outcome
•Analyze alternative solutions related to process
improvement
•Develop approval with a summary of required
information about expected outcomes, resources
needed, time-frame, responsibilities ..etc
Plan for improvement project (initiative):
•Assign tasks with agreed criteria
checklist & set time frame
•Allocate resources, determine
responsibilities & gain support from all
who will be affected by
implementation.
•Establish monitoring system to collect
necessary data to keep project on the
track
•Brainstorming is a structured group
process used to create as many ideas as
possible in as short a time as possible.
Structured Brainstorming:
Everyone in the group gives an idea in
rotation or passes until the next round.
Unstructured Brainstorming:
Everyone in the group gives ideas as they
come to mind.
Lists generated may relate to:
•Problems or topics
•Components of a process
•Possible solutions Structure
•Define the
subject and
direction of
the session
1
•Allow time
for initial,
individual
thought
2 •Establish a
time limit for
the entire
session
3
•Request
ideas; keep
circling the
issue until all
ideas are
recorded
4 • Clarify all
ideas
generated to
assure
accuracy and
understanding
5
Do the improvement project:
•Implement the best solution stated in
FOCUS process.
•Empower all people involved by
training, education & moral support.
•Collect data & update checklist
Check the results
•Check if the desired outcome is
obtained & the expected improvement
is achieved.
•Check for any unexpected, undesired
consequences or outcomes
Act to hold gains or re-adjust the
FOCUS PDCA
•If improvement initiative is reaches;
standardize the process, adjust
documents & empower people.
•If improvement initiative is not
reached, repeat FOCUS-PDCA cycle.
•For both situations, continue to monitor
the process to identify further
improvement.
FOCUS PDCA

FOCUS PDCA

  • 1.
    DR. MANAL ELSAYEDABDELAZIZ B.Sc.Pharm, CPHQ, DTQM, CLSSGB
  • 3.
    • FOCUS PDCAis a strategy that provides a roadmap for continuous process improvement when linked to a quality definition. • FOCUS PDCA is an improvement methodology to guide the improvement efforts. It’s simply a nine step process guide to quality improvement.
  • 6.
    O C US Find an improvement project (initiative): •Review related standards & documents •Analysis of collected data •Identify problems & desired outcomes
  • 7.
    C U S Organizead hoc (task force) team: •Identify & involve stakeholders (e.g. physicians, nurses, administrative …etc) •Cover all related departments to the improvement initiative •Select team members who best do or know the process to be improved
  • 8.
    O U S Clarifycurrent process & desired outcomes: •Fully understand the current process by all team member •Draw flow chart to clarify the process variation/problem •Collect data from all affected areas relevant to process & desired outcomes
  • 9.
    O C S UnderstandProcess Variation, Root Causes & Desired Outcomes: •Identify tools needed to describe & analyze process variation, root causes & desired outcomes •Obtain Information from benchmark, best practice ..etc •Identify all possible solutions to achieve the desired outcome
  • 10.
    •The cause-and-effect diagramis a tool generally used to gather all possible causes as an overview, The ultimate goal being to uncover the root cause of a problem. •The diagram is a visualization of relationships between the outcome of a particular process, the major categories of that process and causes and sub causes.
  • 11.
    • Steps: Define theproblem (effect) to be solved. Identify the key causes of the problem or event. Identify the reasons behind the key causes. Identify the most likely causes.
  • 12.
    ++ CPR Failure Rates Place Patient Personnel PoliciesEquipement Lackof Training (ACLS) Shortage of staff (Anesthesia) Improper scheduling (Anesthesia) Incorrect Policy Poor compliance to the policy (Not all the team attend the CPR Incident) Dead On Arrival included In the measurement Crash Carts Mal-distribution Crash carts Policy Not Followed (Open all The time). Lack of PPM of Defibrillators Lack of regular checks On supplies Lack of Bleeps Missing Crash Carts Nurse Shortage Pharmacist Shortage Materials Lack of Medications No Numerical Locks
  • 13.
    A Pareto chart,named after Vilfredo Pareto, It Separates the "VITAL FEW" from the "USEFUL MANY" (Pareto Principle) . It helps make our improvement work effective and efficient. •It’s a data based tool to answer this question: Which variables out of many are occurring most? Which variables of causes should we focus on? 20% EFFORT GIVING 80% RESULT
  • 14.
    1 • Choosea problem to study 2 • Choose categories/ causes 3 • Select a unit of measure 4 • Choose a time period 5 • Gather data 6 • Compare data 7 • Construct a chart 8 • Show cumulative percents 9 • Interpret the results
  • 15.
    O C U Selectthe best practice procedure: •Choose the best solution that will achieve desired outcome •Analyze alternative solutions related to process improvement •Develop approval with a summary of required information about expected outcomes, resources needed, time-frame, responsibilities ..etc
  • 16.
    Plan for improvementproject (initiative): •Assign tasks with agreed criteria checklist & set time frame •Allocate resources, determine responsibilities & gain support from all who will be affected by implementation. •Establish monitoring system to collect necessary data to keep project on the track
  • 17.
    •Brainstorming is astructured group process used to create as many ideas as possible in as short a time as possible. Structured Brainstorming: Everyone in the group gives an idea in rotation or passes until the next round. Unstructured Brainstorming: Everyone in the group gives ideas as they come to mind.
  • 18.
    Lists generated mayrelate to: •Problems or topics •Components of a process •Possible solutions Structure •Define the subject and direction of the session 1 •Allow time for initial, individual thought 2 •Establish a time limit for the entire session 3 •Request ideas; keep circling the issue until all ideas are recorded 4 • Clarify all ideas generated to assure accuracy and understanding 5
  • 19.
    Do the improvementproject: •Implement the best solution stated in FOCUS process. •Empower all people involved by training, education & moral support. •Collect data & update checklist
  • 20.
    Check the results •Checkif the desired outcome is obtained & the expected improvement is achieved. •Check for any unexpected, undesired consequences or outcomes
  • 21.
    Act to holdgains or re-adjust the FOCUS PDCA •If improvement initiative is reaches; standardize the process, adjust documents & empower people. •If improvement initiative is not reached, repeat FOCUS-PDCA cycle. •For both situations, continue to monitor the process to identify further improvement.