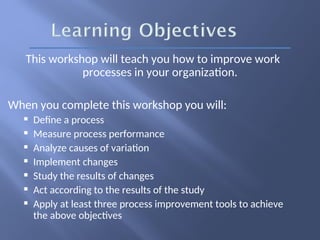
This workshop willteach you how to improve work
processes in your organization.
When you complete this workshop you will:
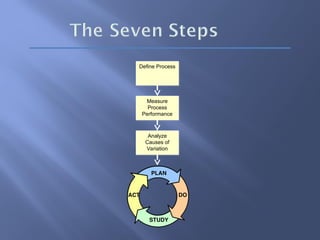
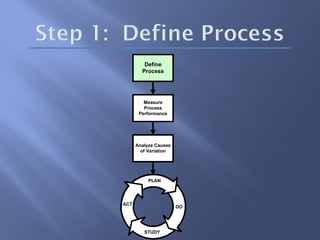
Define a process
Measure process performance
Analyze causes of variation
Implement changes
Study the results of changes
Act according to the results of the study
Apply at least three process improvement tools to achieve
the above objectives
3.
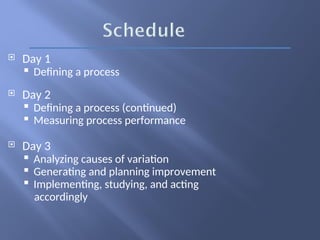
Day 1
Defining a process
Day 2
Defining a process (continued)
Measuring process performance
Day 3
Analyzing causes of variation
Generating and planning improvement
Implementing, studying, and acting
accordingly
4.
A systematic,data-based method
for improving the quality of work processes.
It uses team decision-making to improve processes
that affect the quality of products and services for a
customer.
5.
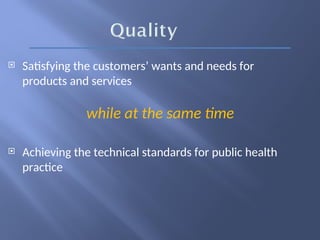
Satisfying thecustomers’ wants and needs for
products and services
while at the same time
achieving the technical standards for public health
practice
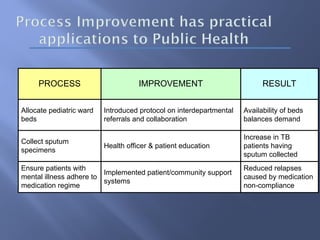
PROCESS IMPROVEMENT RESULT
Allocatepediatric ward
beds
Introduced protocol on interdepartmental
referrals and collaboration
Availability of beds
balances demand
Collect sputum
specimens
Health officer & patient education
Increase in TB
patients having
sputum collected
Ensure patients with
mental illness adhere to
medication regime
Implemented patient/community support
systems
Reduced relapses
caused by medication
non-compliance
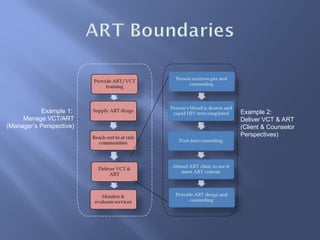
8.
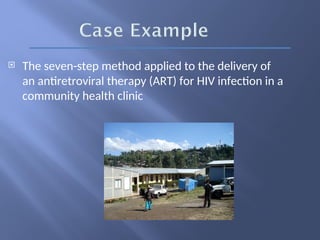
The seven-stepmethod applied to the delivery of
an antiretroviral therapy (ART) for HIV infection in a
community health clinic
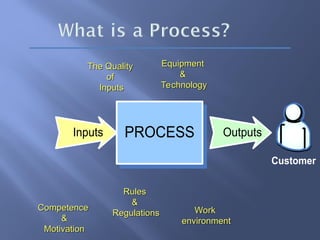
PROCESS Outputs
Inputs
Customer
The Quality
TheQuality
of
of
Inputs
Inputs
Rules
Rules
&
&
Regulations
Regulations
Equipment
Equipment
&
&
Technology
Technology
Competence
Competence
&
&
Motivation
Motivation
Work
Work
environment
environment
12.
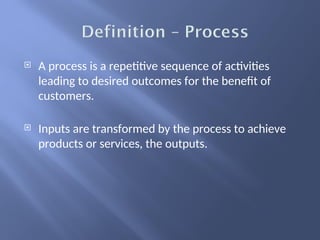
A processis a repetitive sequence of activities
leading to desired outcomes for the benefit of
customers.
Inputs are transformed by the process to achieve
products or services, the outputs.
13.
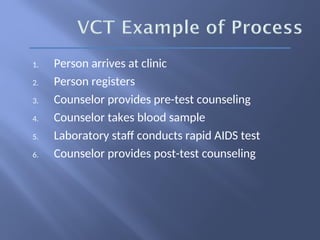
1. Person arrivesat clinic
2. Person registers
3. Counselor provides pre-test counseling
4. Counselor takes blood sample
5. Laboratory staff conducts rapid AIDS test
6. Counselor provides post-test counseling
14.
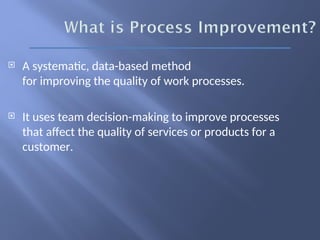
A systematic,data-based method
for improving the quality of work processes.
It uses team decision-making to improve processes
that affect the quality of services or products for a
customer.
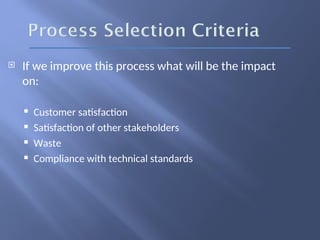
If weimprove this process what will be the impact
on:
Customer satisfaction
Satisfaction of other stakeholders
Waste
Compliance with technical standards
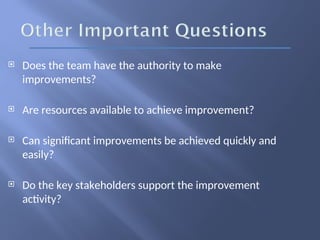
18.
Does theteam have the authority to make
improvements?
Are resources available to achieve improvement?
Can significant improvements be achieved quickly and
easily?
Do the key stakeholders support the improvement
activity?
A customeris any person or group who receives a
product or service
The term is used broadly—no financial transaction
need occur
Can be internal or external to organization
21.
1. Person arrivesat clinic
2. Person registers
3. Counselor provides pre-test counseling
4. Counselor takes blood sample
5. Laboratory staff conducts rapid AIDS test
6. Counselor provides post-test counseling
Products and servicescan be tangible or intangible - a
thing, information, knowledge, a procedure, or a
function
Examples:
Pharmaceuticals
Test results
Free condoms
Public health information
Outbreak investigation procedures
Medical protocols
Satisfying thecustomers’ wants and needs for
products and services
while at the same time
Achieving the technical standards for public health
practice
A stakeholder isone person, or group of persons,
having an interest or concern in a particular process
resulting from some direct or indirect involvement.
28.
Suppliers providegoods, services,
and information to the organization or process
They do not carry out the work
29.
Providers comprisekey staff including
professionals, managers, partners, and
subcontractors.
They carry out the process.
30.
Controllers define,regulate, and influence the
organization or process.
Controllers include regulators, legislators, funding
agencies, expert advisory committees, and trustees.
Technical standards are often set by the
“controllers”
31.
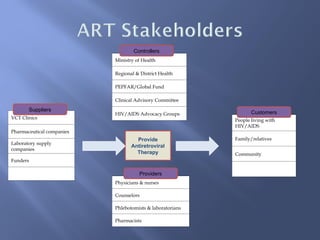
VCT Clinics
Pharmaceutical companies
Laboratorysupply
companies
Funders
People living with
HIV/AIDS
Family/relatives
Community
Physicians & nurses
Counselors
Phlebotomists & laboratorians
Pharmacists
Ministry of Health
Regional & District Health
PEPFAR/Global Fund
Clinical Advisory Committee
HIV/AIDS Advocacy Groups
Suppliers Customers
Controllers
Providers
Provide
Antiretroviral
Therapy
32.
E-mail
Surveys
Questionnaires
Observing stakeholders, especially customers
Visits
Experiencing the service as a customer
Read thesection on measuring good practices on
page 28 of your workbooks.
Use the notes section in your workbooks (page 29)
to record any questions you have as a result of your
reading.
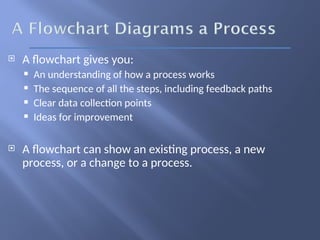
A flowchartgives you:
An understanding of how a process works
The sequence of all the steps, including feedback paths
Clear data collection points
Ideas for improvement
A flowchart can show an existing process, a new
process, or a change to a process.
40.
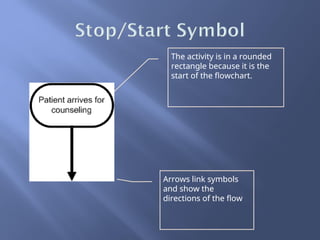
The activity isin a rounded
rectangle because it is the
start of the flowchart.
Arrows link symbols
and show the
directions of the flow
41.
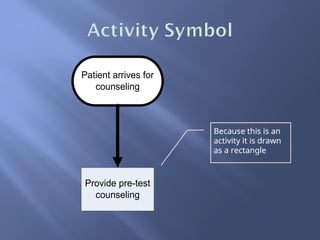
Because this isan
activity it is drawn
as a rectangle
Patient arrives for
counseling
Provide pre-test
counseling
42.
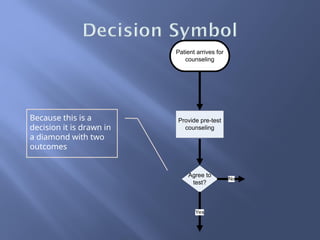
Because this isa
decision it is drawn in
a diamond with two
outcomes
Patient arrives for
counseling
Provide pre-test
counseling
Agree to
test?
Yes
No
43.
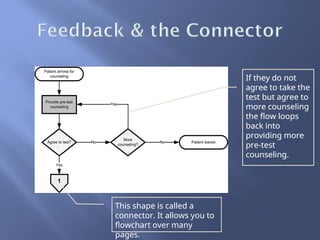
If they donot
agree to take the
test but agree to
more counseling
the flow loops
back into
providing more
pre-test
counseling.
This shape is called a
connector. It allows you to
flowchart over many
pages.
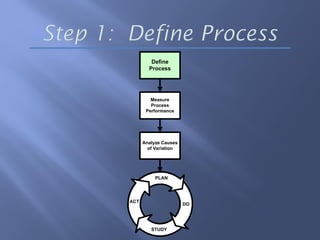
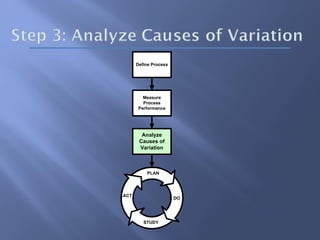
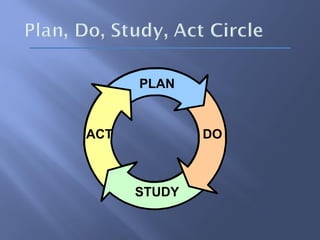
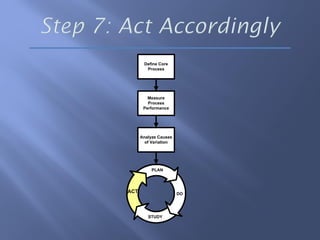
PLAN
ACT
STUDY
DO
Analyze Causes
of Variation
Measure
Process
Performance
Define
Process
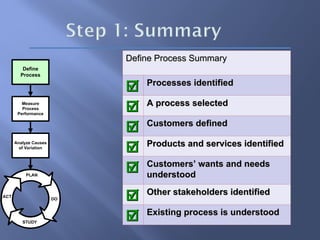
DefineProcess Summary
Define Process Summary
Processes identified
Processes identified
A process selected
A process selected
Customers defined
Customers defined
Products and services identified
Products and services identified
Customers’ wants and needs
Customers’ wants and needs
understood
understood
Other stakeholders identified
Other stakeholders identified
Existing process is understood
Existing process is understood
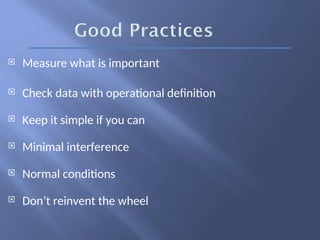
Measure whatis important
Check data with operational definition
Keep it simple if you can
Minimal interference
Normal conditions
Don’t reinvent the wheel
48.
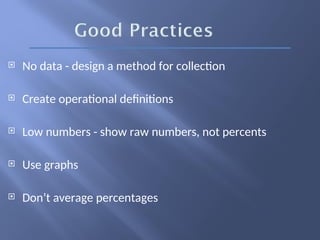
No data- design a method for collection
Create operational definitions
Low numbers - show raw numbers, not percents
Use graphs
Don’t average percentages
The customers’needs and reasonable expectations
Other key stakeholders’ requirements
The technical standards
From within the process
51.
Generated fromthe voice of the customers and
their wants and reasonable needs.
These typically include effective treatment, a safe
environment, timely care, confidentiality, respect
and dignity.
52.
Generated fromkey stakeholders’ wants.
Often it is the funding agencies’ measures receive
priority.
53.
Generated frombest practices as defined by
scientific research.
These measures are often disease-specific and
based on medical protocols
54.
Taken atkey points in the process
They are not usually of direct interest to customers
and other stakeholders.
They are selected because they have a significant
impact on the process outcomes.
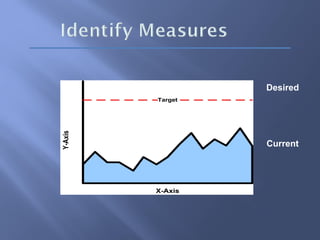
1. The differencebetween your actual and your
desired performance.
2. The feasibility of making a dramatic improvement.
3. The importance set by customers, and other
stakeholders, such as a funding agency.
4. The impact that an improvement could have on the
overall performance of the process.
5. The feasibility of measurement. Is it possible? Do
you have data? Will it take a lot of time?
Read thesections on measurement tools (check
sheet, stratification, Pareto) from pages 35 to 40 of
your workbooks.
Use the notes section in your workbooks to record
any questions you have as a result of your reading.
59.
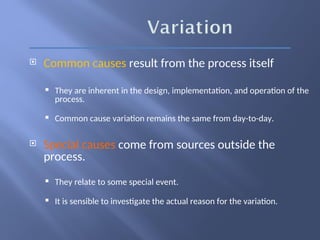
Common causesresult from the process itself
They are inherent in the design, implementation, and operation of the
process.
Common cause variation remains the same from day-to-day.
Special causes come from sources outside the
process.
They relate to some special event.
It is sensible to investigate the actual reason for the variation.
60.
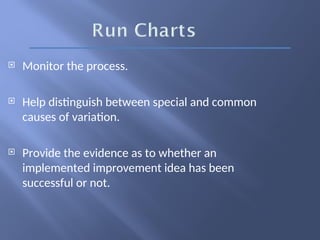
Monitor theprocess.
Help distinguish between special and common
causes of variation.
Provide the evidence as to whether an
implemented improvement idea has been
successful or not.
61.
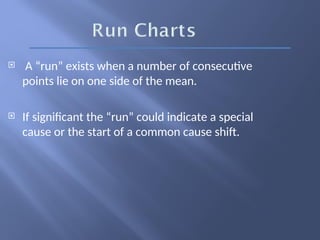
A “run”exists when a number of consecutive
points lie on one side of the mean.
If significant the “run” could indicate a special
cause or the start of a common cause shift.
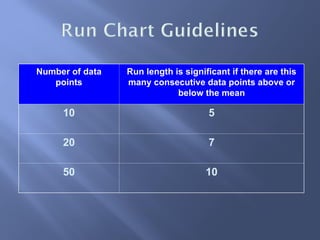
62.
Number of data
points
Runlength is significant if there are this
many consecutive data points above or
below the mean
10 5
20 7
50 10
63.
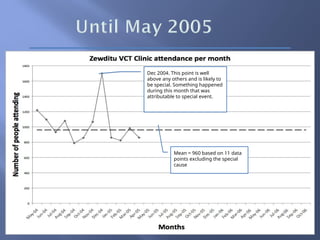
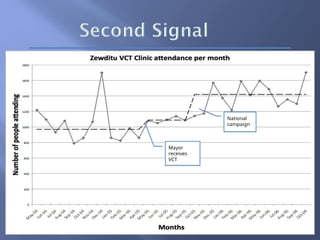
Dec 2004. Thispoint is well
above any others and is likely to
be special. Something happened
during this month that was
attributable to special event.
Mean = 960 based on 11 data
points excluding the special
cause
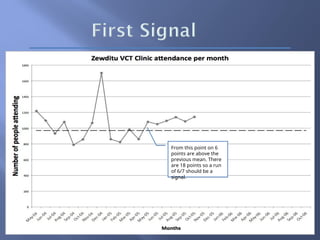
64.
From this pointon 6
points are above the
previous mean. There
are 18 points so a run
of 6/7 should be a
signal.
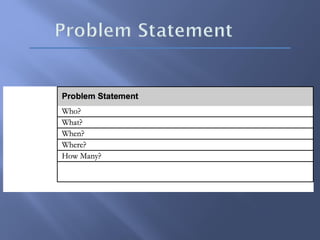
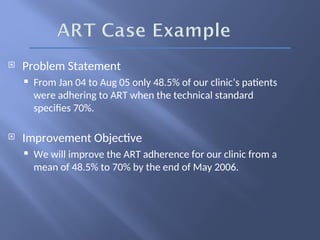
Problem Statement
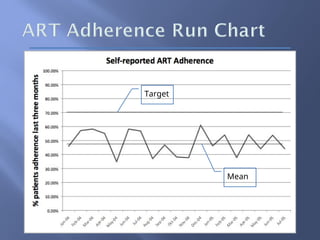
From Jan 04 to Aug 05 only 48.5% of our clinic’s patients
were adhering to ART when the technical standard
specifies 70%.
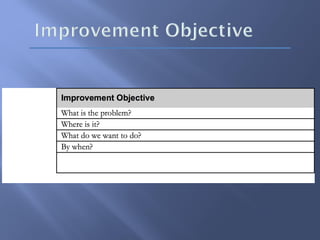
Improvement Objective
We will improve the ART adherence for our clinic from a
mean of 48.5% to 70% by the end of May 2006.
PLAN
ACT
STUDY
DO
Analyze Causes
of Variation
Measure
Process
Performance
DefineProcess
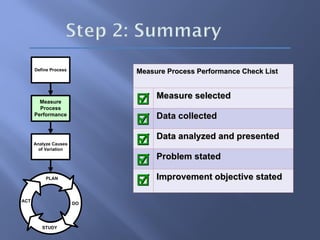
Measure Process Performance Check List
Measure Process Performance Check List
Measure selected
Measure selected
Data collected
Data collected
Data analyzed and presented
Data analyzed and presented
Problem stated
Problem stated
Improvement objective stated
Improvement objective stated
What werethe main learning points from
yesterday’s training?
What kinds of information does a flowchart
provide?
What are the four sources of measures?
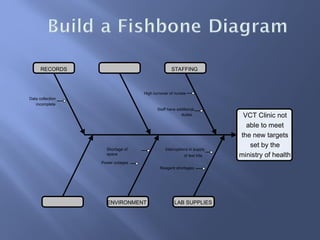
VCT Clinic not
ableto meet
the new targets
set by the
ministry of health
Power outages
RECORDS STAFFING
ENVIRONMENT LAB SUPPLIES
Data collection
incomplete
Staff have additional
duties
Shortage of
space
Interruptions in supply
of test kits
Reagent shortages
High turnover of nurses
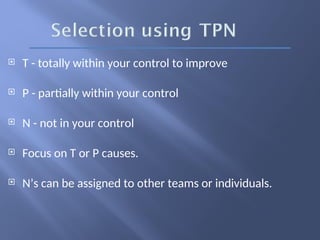
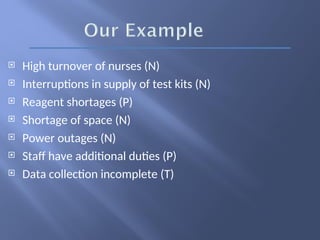
78.
T -totally within your control to improve
P - partially within your control
N - not in your control
Focus on T or P causes.
N’s can be assigned to other teams or individuals.
79.
High turnoverof nurses (N)
Interruptions in supply of test kits (N)
Reagent shortages (P)
Shortage of space (N)
Power outages (N)
Staff have additional duties (P)
Data collection incomplete (T)
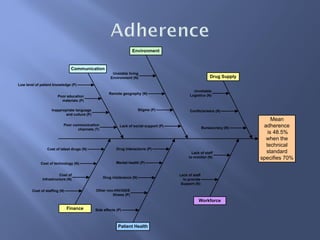
80.
Mean
adherence
is 48.5%
when the
technical
standard
specifies70%
Drug Supply
Environment
Communication
Workforce
Patient Health
Finance
Low level of patient knowledge (P)
Unstable living
Environment (N)
Remote geography (N)
Stigma (P)
Poor education
materials (P)
Poor communication
channels (T)
Lack of social support (P)
Inappropriate language
and culture (P)
Cost of staffing (N)
Drug interactions (P)
Mental health (P)
Side effects (P)
Other non-HIV/AIDS
Illness (P)
Lack of staff
to monitor (N)
Lack of staff
to provide
Support (N)
Unreliable
Logistics (N)
Bureaucracy (N)
Conflicts/wars (N)
Cost of latest drugs (N)
Cost of
Infrastructure (N)
Cost of technology (N)
Drug intolerance (N)
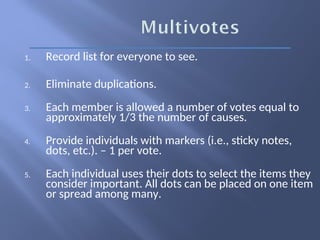
1. Record listfor everyone to see.
2. Eliminate duplications.
3. Each member is allowed a number of votes equal to
approximately 1/3 the number of causes.
4. Provide individuals with markers (i.e., sticky notes,
dots, etc.). – 1 per vote.
5. Each individual uses their dots to select the items they
consider important. All dots can be placed on one item
or spread among many.
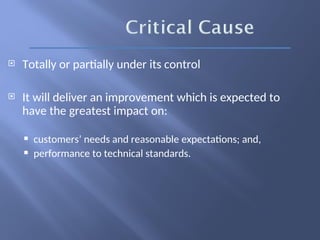
Totally orpartially under its control
It will deliver an improvement which is expected to
have the greatest impact on:
customers’ needs and reasonable expectations; and,
performance to technical standards.
85.
PLAN
ACT
STUDY
DO
Analyze
Causes of
Variation
Measure
Process
Performance
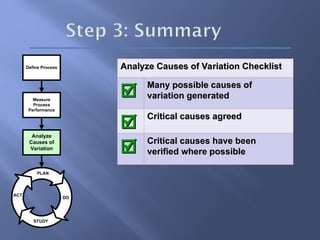
Define ProcessAnalyze Causes of Variation Checklist
Analyze Causes of Variation Checklist
Many possible causes of
Many possible causes of
variation generated
variation generated
Critical causes agreed
Critical causes agreed
Critical causes have been
Critical causes have been
verified where possible
verified where possible
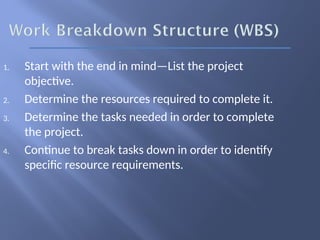
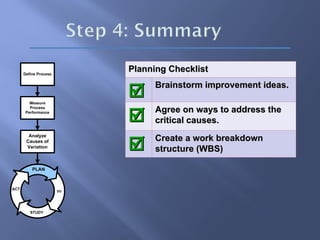
1. Start withthe end in mind—List the project
objective.
2. Determine the resources required to complete it.
3. Determine the tasks needed in order to complete
the project.
4. Continue to break tasks down in order to identify
specific resource requirements.
PLAN
ACT
STUDY
DO
Analyze Causes
of Variation
Measure
Process
Performance
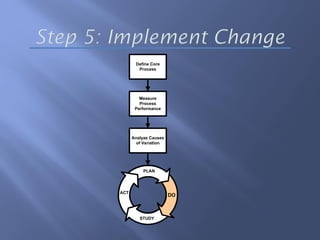
DefineCore
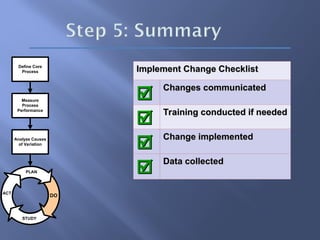
Process Implement Change Checklist
Implement Change Checklist
Changes communicated
Changes communicated
Training conducted if needed
Training conducted if needed
Change implemented
Change implemented
Data collected
Data collected
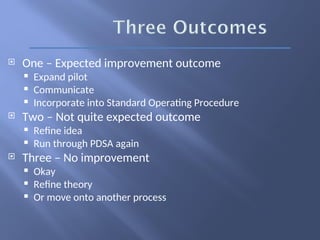
One –Expected improvement outcome
Expand pilot
Communicate
Incorporate into Standard Operating Procedure
Two – Not quite expected outcome
Refine idea
Run through PDSA again
Three – No improvement
Okay
Refine theory
Or move onto another process
99.
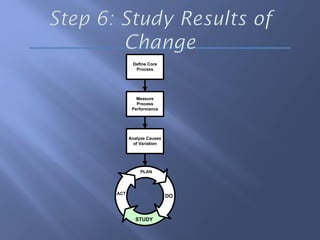
PLAN
ACT
STUDY
DO
Analyze Causes
of Variation
Measure
Process
Performance
DefineCore
Process
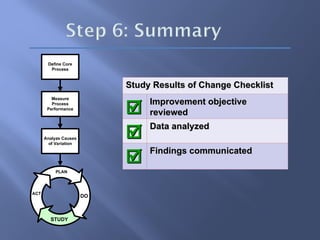
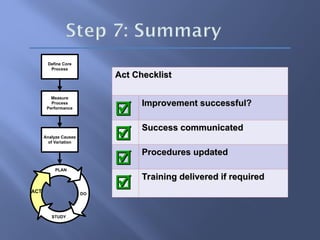
Act Checklist
Act Checklist
Improvement successful?
Improvement successful?
Success communicated
Success communicated
Procedures updated
Procedures updated
Training delivered if required
Training delivered if required
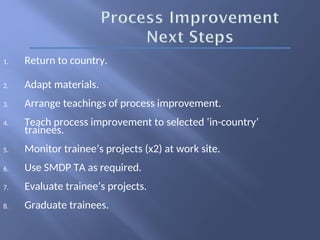
1. Return tocountry.
2. Adapt materials.
3. Arrange teachings of process improvement.
4. Teach process improvement to selected ‘in-country’
trainees.
5. Monitor trainee’s projects (x2) at work site.
6. Use SMDP TA as required.
7. Evaluate trainee’s projects.
8. Graduate trainees.
Editor's Notes
#12 ASK: “When I say process, what immediately comes to mind?
SAY: We have a sense of what it is – a method – or a series of steps – it repeats and a sequence of activity – hopefully leads to an outcome
You don’t have a system, unless you have a shared aim (Deming)
Transforming – taking things, adding value and outputting them.
Must distinguish between a process and an output.
#49 Time on X axis and Y axis measurement
How is the process performing
There is another term we want to introduce called operational definitions
#77 SAY: We’ll use a very important tool to ask why – the fishbone diagram.
DO: Explain the initial steps in using the fishbone diagram:
1. abbreviated problem statement written in “head” of the fish
2. team thinks of reasons and groups them based on their similarity
3. when team has finished coming up with ideas and sorting, the team labels the reasons that are similar in the “bones” of the fish.
p. 74