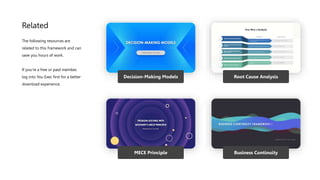
You Exec provides business resources that move your career
forward. Access our full library of presentations,
spreadsheet models, and business book summaries. We do
the work, you take the credit.
Errors & Omissions Liability (E&O): You Exec makes no
guarantee that the statements, analysis, projections,
estimates, graphs, reports, numbers, and any derivatives
sourced from this presentation are free of errors and
omissions. You Exec assumes no liability for erroneous
outcomes derived from this presentation.
Get the full version of this framework
and access our library of hundreds of
other business resources.
Join You Exec Plus today and take your career to
new heights. Receive premium business resources
in your inbox every week.
Start today
Feedback
Found an error, have suggestions?
• What are we trying to achieve with this process?
• What is the Background to the problem (be as specific as possible).
• Give an explanation which helps people to better understand the problem.
• State the importance of the problem.
• Draw a diagram of what the new process will look like.
• Identify WHERE the Root Cause is being eliminated.
• Define Target to support proposed improvement.
• Draw a diagram of current condition.
• Highlight the problem.
• Use data to explain the size of the problem.
• Collect and analyze data to identify root cause.
• Use 5 Whys, Fishbone Diagrams, Pareto Charts
• What actions must we take in future to sustain the improvement?
• Did we achieve at 7/30/90 days what we wanted?
• Is the problem eliminated and does the process show measurable improvement?
• Can we close this problem-solving process and achieve it as Complete/Closed?
• What specific actions are needed to eliminate the problem?
STEP 6: Implementation
• Check the result.
• Did the improvement work?
• Did it work as well as we predicted?
• Collect data and compare before and after.
PLAN
(1-4)
DO
(5-6)
CHECK
(7)
ACT
(8)
STEP 1: Subject/Background/History
STEP 4: Target Condition/Future State/Desired Outcome
STEP 2: Current Condition
STEP 3: Root Cause Analysis
STEP 8: Follow-up
STEP 5: Countermeasures/Suggested Actions/Changes
STEP 7: Evaluation
WHAT WHEN (DATE) WHO
Task A Jan 3, 20XX Tom Jerry
Task B March 8, 20XX Joan Appleseed
Task C Oct 25, 20XX Grant Parker
Effect on Project rate of return
Costs to fill gaps
Sources of required
facilities/equipment
Map of “facilities gap”
Finance department, prior
analysis
Operations, contractors,
interviews
Operations, trade publications
Facilities management, thrum-
mat line supervisors
Technical Specification
List of Facilities that meet new
criteria
Articles, Interviews
Facilities management,
interviews
Does the new process require special
facilities? NO
If it does require special facilities, can we
acquire them? YES
12 December
10 November
7 September
7 August
3 June
5 July
Diana
Jerome
Jane
Chin-Yang
Stephanie
Jorge
Issue/Hypothesis Analysis Data Sources Responsibility Due Date
The part is
produced in the
wrong size
• Wrong specification of the
material
• Poor storage conditions
• Worn out material
• Wrong size of the mold
− Blueprint mistake
− Production mistake
• Machine malfunction
− Employee’s fault
− Machine defect
• Wrong production procedure • Wrong production conditions
− Too hot
− Too cold
− Too humid
• Employee mistake
− Mistaken machine settings
− Mistake in production
procedures
MATERIAL MEASUREMENT MACHINE
METHOD ENVIRONMENT PEOPLE
Multiple fatalities, > 5. Large
effects on large external
inhabited zones- several
fatalities
Lethal effect on several persons
(several fatalities). Lethal external
effect - one fatality, several
physical injuries
Lethal effect on one person
and/or several permanent
invalidities. Permanent external
effects
Permanent injury, lost time
accident. Non-permanent external
effects
No permanent injury,
recordable with no lost
time/medical treatment. No
external effect
Extensive damage
>$8M
Major damage
$6M-$8M
Localized damage
$2M-$6M
Minor damage
$200K-$2M
Slight damage
< $200K
Major loss, not recoverable.
More than 3 days lost
production
Major loss. Up to 50% not
recoverable Up to 3 days
lost production.
Medium loss, not wholly
recoverable through
normal production < 24
hours lost production
Minor loss, recoverable
through normal production
2 to 8 hours lost
production
Little to no effect.
Production easily
recovered. < 2 hour lost
production.
Major pollution with sustained
environmental consequences
external to the site
Major pollution external to the
site. Evacuation of persons
Moderate pollution, within site
limits. Product liability
Spill or release of pollutant
requiring a declaration to
authorities but without
environmental consequences
Minor spill or release of pollutant,
not requiring a declaration
5 25
20
15
10
4 20
16
12
8
3 15
12
9
6
2 10
8
6
4
1 5
4
3
2
Disastrous
Moderate
Serious
Major
Catastrophic
5
1
2
3
4
< 1%
Remote
1%-5%
Extremely
Unlikely
5%-25%
Very
Unlikely
25%-50%
Unlikely
>50%
Likely
Severity &
Classification Safety
Equipment/
Maintenance Cost Production Environment
Probability
Assessment collecting, organizing, validating, and documenting client data
Analyze and synthesize data. Problem identification.
Planning/goal/outcome determining how to prevent, reduce, or
resolve the identified client problems
Implementation carry out the planned interventions.
Evaluation measuring the degree to which goal/outcomes have been achieved and
identifying factors that positively or negatively influence goal achievement.
70 100 0 0
68 97.1 2 2.9
55 78.6 15 21.4
70 100 0 0
66 94.3 4 5.7
N % N %
ITEMS DONE NOT DONE
Create a standard for starting with
preferred candidates, then switching
to min quals. Based on set
parameters
Communicate standard from #1
Leader #3 to meet with operations
managers and finalize success profile
Communicate the finalized success
profile to recruiting team
Schedule and attend meeting to
discuss roles and responsibilities
between HR & BL #1 dev. specialist
Align Success Profile to behavioral
interview questions, phone screen
Create a new assessment scoring
matrix that is PASS/FAIL oriented
01
02
03
04
05
06
07
Leader #1
Leader #2
Leader #3
Leader #4
Leader #5
Leader #6
Leader #7
10-Feb
17-Feb
7-Feb
14-Feb
10-Feb
14-Apr
28-Feb
10-Feb
2-Mar
7-Feb
14-Feb
10-Feb
14-Apr
28-Feb
10-Feb
7-Feb
10-Feb
28-Feb
C
D
C
A
C
A
C
10-Feb
7-Feb
10-Feb
28-Feb
Corrective Action
Item Responsible Start Date
Target
Completion
Completion
Date
Next
Follow Up
C
A
D
P
8%
15%
15%
62%
Plan Do Act Check
Get the full version of this
presentation with this slide
when you join You Exec Plus.
Start today
Get the full version of this
presentation with this slide
when you join You Exec Plus.
Start today
Get the full version of this
presentation with this slide
when you join You Exec Plus.
Start today
Get the full version of this
presentation with this slide
when you join You Exec Plus.
Start today
Get the full version of this
presentation with this slide
when you join You Exec Plus.
Start today
Related
Decision-Making Models Root Cause Analysis
MECE Principle Business Continuity
The following resources are
related to this framework and can
save you hours of work.
If you’re a free or paid member,
log into You Exec first for a better
download experience.

Problem Solving Frameworks

  • 1.
    You Exec providesbusiness resources that move your career forward. Access our full library of presentations, spreadsheet models, and business book summaries. We do the work, you take the credit. Errors & Omissions Liability (E&O): You Exec makes no guarantee that the statements, analysis, projections, estimates, graphs, reports, numbers, and any derivatives sourced from this presentation are free of errors and omissions. You Exec assumes no liability for erroneous outcomes derived from this presentation. Get the full version of this framework and access our library of hundreds of other business resources. Join You Exec Plus today and take your career to new heights. Receive premium business resources in your inbox every week. Start today Feedback Found an error, have suggestions?
  • 2.
    • What arewe trying to achieve with this process? • What is the Background to the problem (be as specific as possible). • Give an explanation which helps people to better understand the problem. • State the importance of the problem. • Draw a diagram of what the new process will look like. • Identify WHERE the Root Cause is being eliminated. • Define Target to support proposed improvement. • Draw a diagram of current condition. • Highlight the problem. • Use data to explain the size of the problem. • Collect and analyze data to identify root cause. • Use 5 Whys, Fishbone Diagrams, Pareto Charts • What actions must we take in future to sustain the improvement? • Did we achieve at 7/30/90 days what we wanted? • Is the problem eliminated and does the process show measurable improvement? • Can we close this problem-solving process and achieve it as Complete/Closed? • What specific actions are needed to eliminate the problem? STEP 6: Implementation • Check the result. • Did the improvement work? • Did it work as well as we predicted? • Collect data and compare before and after. PLAN (1-4) DO (5-6) CHECK (7) ACT (8) STEP 1: Subject/Background/History STEP 4: Target Condition/Future State/Desired Outcome STEP 2: Current Condition STEP 3: Root Cause Analysis STEP 8: Follow-up STEP 5: Countermeasures/Suggested Actions/Changes STEP 7: Evaluation WHAT WHEN (DATE) WHO Task A Jan 3, 20XX Tom Jerry Task B March 8, 20XX Joan Appleseed Task C Oct 25, 20XX Grant Parker
  • 3.
    Effect on Projectrate of return Costs to fill gaps Sources of required facilities/equipment Map of “facilities gap” Finance department, prior analysis Operations, contractors, interviews Operations, trade publications Facilities management, thrum- mat line supervisors Technical Specification List of Facilities that meet new criteria Articles, Interviews Facilities management, interviews Does the new process require special facilities? NO If it does require special facilities, can we acquire them? YES 12 December 10 November 7 September 7 August 3 June 5 July Diana Jerome Jane Chin-Yang Stephanie Jorge Issue/Hypothesis Analysis Data Sources Responsibility Due Date
  • 4.
    The part is producedin the wrong size • Wrong specification of the material • Poor storage conditions • Worn out material • Wrong size of the mold − Blueprint mistake − Production mistake • Machine malfunction − Employee’s fault − Machine defect • Wrong production procedure • Wrong production conditions − Too hot − Too cold − Too humid • Employee mistake − Mistaken machine settings − Mistake in production procedures MATERIAL MEASUREMENT MACHINE METHOD ENVIRONMENT PEOPLE
  • 5.
    Multiple fatalities, >5. Large effects on large external inhabited zones- several fatalities Lethal effect on several persons (several fatalities). Lethal external effect - one fatality, several physical injuries Lethal effect on one person and/or several permanent invalidities. Permanent external effects Permanent injury, lost time accident. Non-permanent external effects No permanent injury, recordable with no lost time/medical treatment. No external effect Extensive damage >$8M Major damage $6M-$8M Localized damage $2M-$6M Minor damage $200K-$2M Slight damage < $200K Major loss, not recoverable. More than 3 days lost production Major loss. Up to 50% not recoverable Up to 3 days lost production. Medium loss, not wholly recoverable through normal production < 24 hours lost production Minor loss, recoverable through normal production 2 to 8 hours lost production Little to no effect. Production easily recovered. < 2 hour lost production. Major pollution with sustained environmental consequences external to the site Major pollution external to the site. Evacuation of persons Moderate pollution, within site limits. Product liability Spill or release of pollutant requiring a declaration to authorities but without environmental consequences Minor spill or release of pollutant, not requiring a declaration 5 25 20 15 10 4 20 16 12 8 3 15 12 9 6 2 10 8 6 4 1 5 4 3 2 Disastrous Moderate Serious Major Catastrophic 5 1 2 3 4 < 1% Remote 1%-5% Extremely Unlikely 5%-25% Very Unlikely 25%-50% Unlikely >50% Likely Severity & Classification Safety Equipment/ Maintenance Cost Production Environment Probability
  • 6.
    Assessment collecting, organizing,validating, and documenting client data Analyze and synthesize data. Problem identification. Planning/goal/outcome determining how to prevent, reduce, or resolve the identified client problems Implementation carry out the planned interventions. Evaluation measuring the degree to which goal/outcomes have been achieved and identifying factors that positively or negatively influence goal achievement. 70 100 0 0 68 97.1 2 2.9 55 78.6 15 21.4 70 100 0 0 66 94.3 4 5.7 N % N % ITEMS DONE NOT DONE
  • 7.
    Create a standardfor starting with preferred candidates, then switching to min quals. Based on set parameters Communicate standard from #1 Leader #3 to meet with operations managers and finalize success profile Communicate the finalized success profile to recruiting team Schedule and attend meeting to discuss roles and responsibilities between HR & BL #1 dev. specialist Align Success Profile to behavioral interview questions, phone screen Create a new assessment scoring matrix that is PASS/FAIL oriented 01 02 03 04 05 06 07 Leader #1 Leader #2 Leader #3 Leader #4 Leader #5 Leader #6 Leader #7 10-Feb 17-Feb 7-Feb 14-Feb 10-Feb 14-Apr 28-Feb 10-Feb 2-Mar 7-Feb 14-Feb 10-Feb 14-Apr 28-Feb 10-Feb 7-Feb 10-Feb 28-Feb C D C A C A C 10-Feb 7-Feb 10-Feb 28-Feb Corrective Action Item Responsible Start Date Target Completion Completion Date Next Follow Up C A D P 8% 15% 15% 62% Plan Do Act Check
  • 8.
    Get the fullversion of this presentation with this slide when you join You Exec Plus. Start today
  • 9.
    Get the fullversion of this presentation with this slide when you join You Exec Plus. Start today
  • 10.
    Get the fullversion of this presentation with this slide when you join You Exec Plus. Start today
  • 11.
    Get the fullversion of this presentation with this slide when you join You Exec Plus. Start today
  • 12.
    Get the fullversion of this presentation with this slide when you join You Exec Plus. Start today
  • 13.
    Related Decision-Making Models RootCause Analysis MECE Principle Business Continuity The following resources are related to this framework and can save you hours of work. If you’re a free or paid member, log into You Exec first for a better download experience.