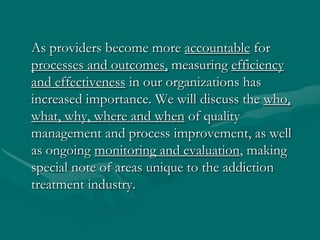
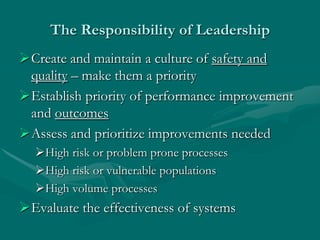
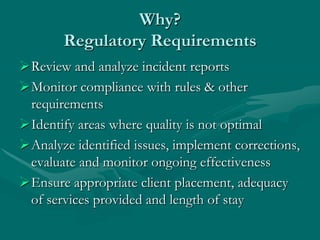
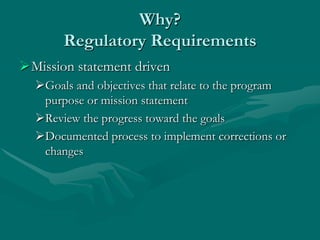
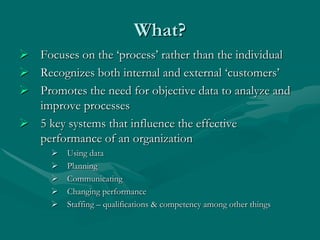
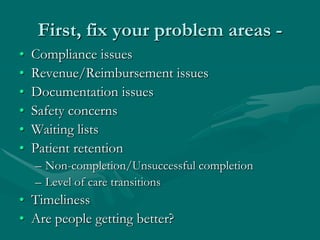
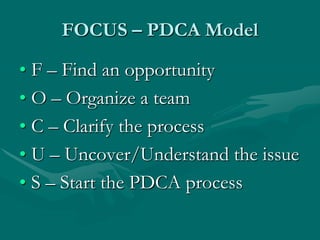
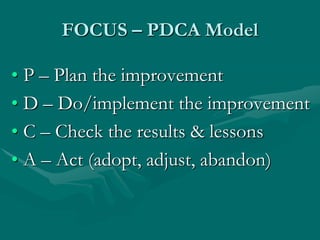
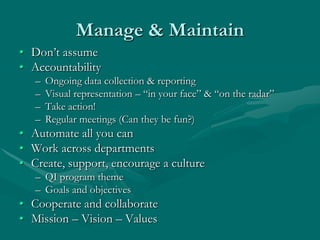
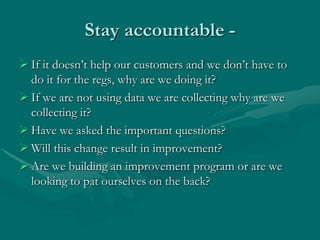
This document discusses quality management and process improvement in addiction treatment organizations. It outlines various quality improvement frameworks and explains why ongoing monitoring and evaluation is important as providers become more accountable for outcomes. The responsibilities of leadership in establishing a culture of safety, performance improvement, and outcome measurement are described. Effective quality management requires collecting and analyzing data to identify problem areas and opportunities for improvement. The PDCA (Plan-Do-Check-Act) cycle provides a model for ongoing quality improvement efforts.
2. As providers become more accountable for
processes and outcomes, measuring efficiency
and effectiveness in our organizations has
increased importance. We will discuss the who,
what, why, where and when of quality
management and process improvement, as well
as ongoing monitoring and evaluation, making
special note of areas unique to the addiction
treatment industry.
3. The Responsibility of Leadership
Create and maintain a culture of safety and
quality – make them a priority
Establish priority of performance improvement
and outcomes
Assess and prioritize improvements needed
High risk or problem prone processes
High risk or vulnerable populations
High volume processes
Evaluate the effectiveness of systems
4. Why?
The Future of Healthcare
More definitive research on what is effective treatment
Move toward payment based on outcomes
Expected to use objective tools to assess processes and
outcomes
Recovery Oriented Care
Show that chemical dependency treatment is effective -
measuring success by measuring individuals‟ recovery
Patient-centered focus on care
Expected to involve the patient. Not just in their care
decisions but in the processes of the care they receive.
Empower the patient
5. Why?
Regulatory Requirements
Review and analyze incident reports
Monitor compliance with rules & other
requirements
Identify areas where quality is not optimal
Analyze identified issues, implement corrections,
evaluate and monitor ongoing effectiveness
Ensure appropriate client placement, adequacy
of services provided and length of stay
6. Why?
Regulatory Requirements
Mission statement driven
Goals and objectives that relate to the program
purpose or mission statement
Review the progress toward the goals
Documented process to implement corrections or
changes
7. What?
Focuses on the „process‟ rather than the individual
Recognizes both internal and external „customers‟
Promotes the need for objective data to analyze and
improve processes
5 key systems that influence the effective
performance of an organization
Using data
Planning
Communicating
Changing performance
Staffing – qualifications & competency among other things
8. First, fix your problem areas -
• Compliance issues
• Revenue/Reimbursement issues
• Documentation issues
• Safety concerns
• Waiting lists
• Patient retention
– Non-completion/Unsuccessful completion
– Level of care transitions
• Timeliness
• Are people getting better?
9. Then move to improvement -
• Quality
• High risk processes (always, sometimes)
• Proactive vs reactive
• Prevention vs correction
• Increased efficiency
• Improved effectiveness
• Workflows
• Streamline processes
10. How?
• Everything starts with asking the right questions!
– What‟s important to you?
– Are you satisfied with the quality of your service?
– Are your customers satisfied?
• Look at everything through the customers‟
perspective.
– Who‟s your customer?
– What does your customer experience?
– What do you want your customer to experience?
11. How?
Empower employees
Leadership sets the stage
Line staff generally has better pulse on things
Encourage reporting
Use statistical tools
Benchmarking
Evidence based practices – guidelines, literature
Reflect your mission statement?
13. Data Collection
• Chart audits (qualitative/quantitative)
• Patient surveys
• Staff surveys
• Family member surveys
• Alumni surveys
• Referral source surveys
• Continuing care provider surveys
• AMA analysis
• Patient outcomes
• Risk management reports
14. Data Collection
• Sample size
• Statistical analysis – charts & graphs
– Line graphs – show data change over time
– Bar charts – show how many units have particular
characteristic
– Pie charts – show percentage of each contribution to
the whole
• Data should lead you to answers
• Beware of conclusions without data
16. FOCUS – PDCA Model
• F – Find an opportunity
• O – Organize a team
• C – Clarify the process
• U – Uncover/Understand the issue
• S – Start the PDCA process
17. FOCUS – PDCA Model
• P – Plan the improvement
• D – Do/implement the improvement
• C – Check the results & lessons
• A – Act (adopt, adjust, abandon)
18. Manage & Maintain
• Don‟t assume
• Accountability
– Ongoing data collection & reporting
– Visual representation – “in your face” & “on the radar”
– Take action!
– Regular meetings (Can they be fun?)
• Automate all you can
• Work across departments
• Create, support, encourage a culture
– QI program theme
– Goals and objectives
• Cooperate and collaborate
• Mission – Vision – Values
19. Stay accountable -
If it doesn‟t help our customers and we don‟t have to
do it for the regs, why are we doing it?
If we are not using data we are collecting why are we
collecting it?
Have we asked the important questions?
Will this change result in improvement?
Are we building an improvement program or are we
looking to pat ourselves on the back?
20. • Successes tend to disappear from view.
• Building on success is the secret to sustainability.