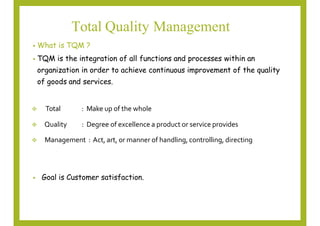
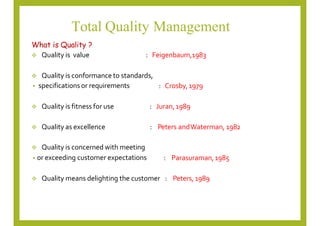
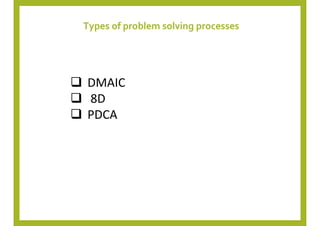
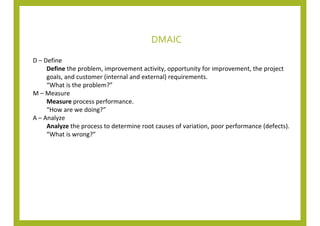
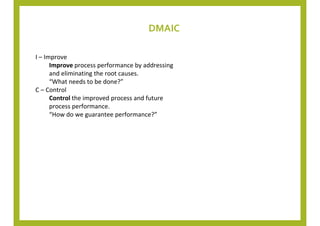
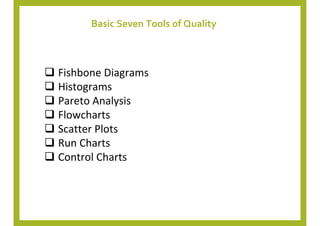
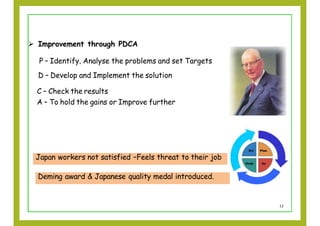
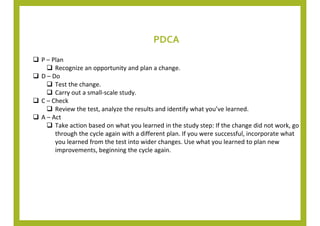
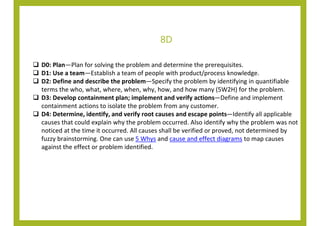
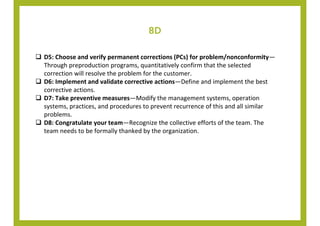
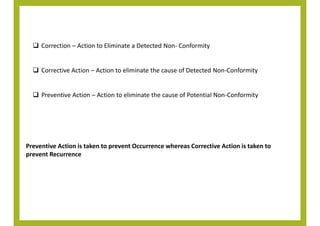
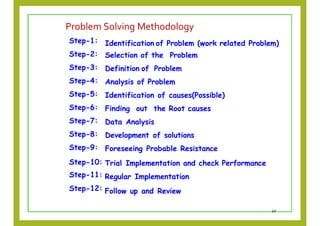
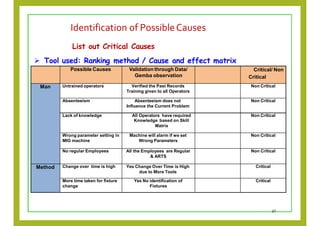
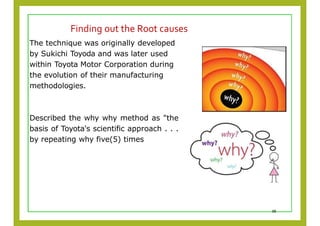
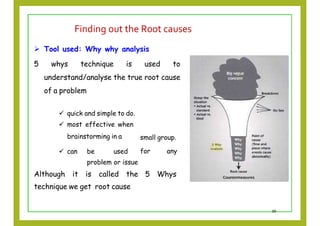
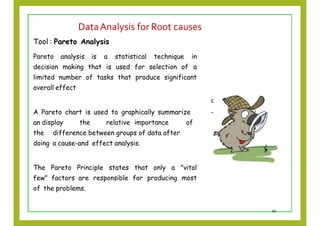
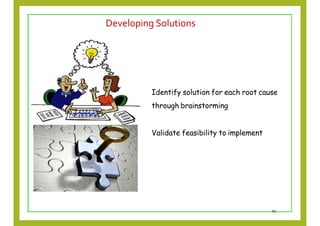
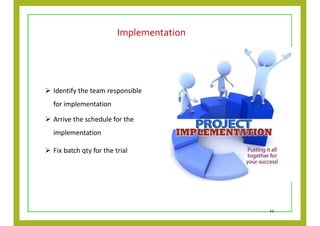
Welcome to all
Total Quality Management
• What is TQM ?
• TQM is the integration of all functions and processes within an
organization in order to achieve continuous improvement of the quality
of goods and services.
 Total
 Quality
: Make up of the whole
: Degree of excellence a product or service provides
 Management : Act, art, or manner of handling, controlling, directing
• Goal is Customer satisfaction.
Total Quality Management
 Quality is conformance to standards,
• specifications or requirements : Crosby,1979
 Quality is fitness for use : Juran,1989
Peters andWaterman, 1982
 Quality as excellence :
 Quality is concerned with meeting
• or exceeding customer expectations : Parasuraman,1985
 Quality means delighting the customer : Peters, 1989
What is Quality ?
 Quality is value : Feigenbaum,1983
Types of problem solving processes
 DMAIC
 8D
 PDCA
DMAIC
DMAIC (an acronym for Define, Measure, Analyze, Improve and Control) (pronounced də-MAY-
ick) refers to a data-driven improvement cycle used for improving, optimizing and stabilizing
business processes and designs.
DMAIC
D – Define
Define the problem, improvement activity, opportunity for improvement, the project
goals, and customer (internal and external) requirements.
“What is the problem?”
M – Measure
Measure process performance.
“How are we doing?”
A – Analyze
Analyze the process to determine root causes of variation, poor performance (defects).
“What is wrong?”
DMAIC
I – Improve
Improve process performance by addressing
and eliminating the root causes.
“What needs to be done?”
C – Control
Control the improved process and future
process performance.
“How do we guarantee performance?”
Basic Seven Tools of Quality
 Fishbone Diagrams
 Histograms
 Pareto Analysis
 Flowcharts
 Scatter Plots
 Run Charts
 Control Charts
 In 1924 - Shewhart’s control charts
 Shewhart became the first to recognize the variability
was the fact of industrial life.
 Father of Statistical Quality Control
9
1
 Discovered the work of Vilfredo Pareto (1848 -
1923) and expanded the Pareto Principle (80 : 20
Rule)
 Invited J.M.Juran for Managing for Quality in 1954
Quality of the products depends on
Man , Machine , Material, Method & Measurement
Dr. Juran says Quality as ‘Fitness For Use’
Dr. K.Ishikawa is known as the ‘Father of quality circle’.
3
 1949 – Ishikawa Joined JUSE.
Invented Cause & Effect diagram / Fish Bone
Diagram/Ishikawa Diagram
11
Workers felt easy to arrive Solutions for the causes
Worker are happy and formed circle and arrived the solutions
PDCA
PDCA (plan-do-check-act, sometimes seen as plan-do-check-adjust) is a repetitive
four-stage model for continuous improvement (CI) in business process
management.
 Improvement through PDCA
P – Identify, Analyse the problems and set Targets
D – Develop and Implement the solution
C – Check the results
A – To hold the gains or Improve further
12
Japan workers not satisfied –Feels threat to their job
Deming award & Japanese quality medal introduced.
PDCA
 P – Plan
 Recognize an opportunity and plan a change.
 D – Do
 Test the change.
 Carry out a small-scale study.
 C – Check
 Review the test, analyze the results and identify what you’ve learned.
 A – Act
 Take action based on what you learned in the study step: If the change did not work, go
through the cycle again with a different plan. If you were successful, incorporate what
you learned from the test into wider changes. Use what you learned to plan new
improvements, beginning the cycle again.
8D
The Eight Disciplines of Problem Solving (8D) is a problem solving methodology designed to find
the root cause of a problem, devise a short-term fix and implement a long-term solution to
prevent recurring problems.
8D
 D0: Plan—Plan for solving the problem and determine the prerequisites.
 D1: Use a team—Establish a team of people with product/process knowledge.
 D2: Define and describe the problem—Specify the problem by identifying in quantifiable
terms the who, what, where, when, why, how, and how many (5W2H) for the problem.
 D3: Develop containment plan; implement and verify actions—Define and implement
containment actions to isolate the problem from any customer.
 D4: Determine, identify, and verify root causes and escape points—Identify all applicable
causes that could explain why the problem occurred. Also identify why the problem was not
noticed at the time it occurred. All causes shall be verified or proved, not determined by
fuzzy brainstorming. One can use 5 Whys and cause and effect diagrams to map causes
against the effect or problem identified.
8D
 D5: Choose and verify permanent corrections (PCs) for problem/nonconformity—
Through preproduction programs, quantitatively confirm that the selected
correction will resolve the problem for the customer.
 D6: Implement and validate corrective actions—Define and implement the best
corrective actions.
 D7: Take preventive measures—Modify the management systems, operation
systems, practices, and procedures to prevent recurrence of this and all similar
problems.
 D8: Congratulate your team—Recognize the collective efforts of the team. The
team needs to be formally thanked by the organization.
 Correction – Action to Eliminate a Detected Non- Conformity
 Corrective Action – Action to eliminate the cause of Detected Non-Conformity
 Preventive Action – Action to eliminate the cause of Potential Non-Conformity
Preventive Action is taken to prevent Occurrence whereas Corrective Action is taken to
prevent Recurrence
Problem Solving
Methodology and Tools & Techniques
19
• A problem is an obstacle , impediment,
difficulty or challenge to achieve a
desired goal
 a state of difficulty that needs
to be resolved.
 a discrepancy between existing
and a desired state of affairs.
20
About Problems
About Problem Solving
Problem Solving is the process of
tackling problems in a systematic and
rational way.
Problem Solving Process
21
About Problem Solving
Problem Solving is about to identify
problems, causes and solution:
Thinking Differently-Concepts
Talking Differently -Vocabulary
Doing Differently -Tools
22
Why to solve Problems
Problems are solved to
•improve effectiveness and
efficiency of processes
•become a “World Class Company”
•improve the customer satisfaction
•reduce COPQ
•improve the bottom line measures of
the business
23
Problem Solving Methodology
24
Step-1:
Step-2:
Step-3:
Step-4:
Step-5:
Step-6:
Step-7:
Step-8:
Step-9:
Identification of Problem (work related Problem)
Selection of the Problem
Definition of Problem
Analysis of Problem
Identification of causes(Possible)
Finding out the Root causes
Data Analysis
Development of solutions
Foreseeing Probable Resistance
Step-10: Trial Implementation and check Performance
Step-11: Regular Implementation
Step-12: Follow up and Review
Problem Analysis
Understanding the problem
Critical step of the problem solving
is to understand the problem fully
as possible in the context in which
way it occurs .
Understand by what means and
ways the problem is creating.
Can understand contributors for
the problem
25
Step-4: ProblemAnalysis
Step-4b: Understanding the problem
Tool used: 4W 1H
4W 1H is a technique used to understand the
problem and collect Key Information about the
problem
It is an amazing tool in different situations
where one needs to clarify or understands
something in more depth.
26
Step-4: ProblemAnalysis
Step-4b: Understanding the problem
What is the problem -- Purpose
( We have to write our problem in detail)
Where is it happening -- Place
( On the product/process which location/area the problem is occurring)
When is it happening -- Sequence/Pattern
( At what time it is happening/How it is Happening)
Who is effected -- Person
( The Persons who are effecting while doing this process)
How does it happen & many times -- Means
( How the Problem is Occurring/How many times it is Happening)
27
Identification of PossibleCauses
Tool used : Brain storming, Cause & Effect diagram
28
Identification of PossibleCauses
 Brainstorming Methods
 Free wheeling or Unstructured
 Slip Method
 Round Robin or Structured process
29
Methods of Brainstorming
Brainstorming can be done in three ways
1.Free Wheeling or Unstructured
No hold ,no bar (piece) system. No limit on number of
ideas at a time.
2. Slip Method
When you need the involvement of a large groups this
method is essential for earning innovative ideas.ssential
3. Round Robin or Structured Method
a) Gather a group which is willing to work together.
b) Select a leader. A leader is there in Quality Circle.
c) He should have control over the group to encourage ideas.
Generally , In Quality circles , we preferred this brainstorming Method.
There are four basic rules in brainstorming :
•No criticism: Criticism of ideas are withheld during the brainstorming session
as the purpose is on generating varied and unusual ideals and extending or
adding to these ideas. Criticism is reserved for the evaluation stage of the
process. This allows the members to feel comfortable with the idea of generating
unusual ideas.
•Welcome unusual ideas: Unusual ideas are welcomed as it is
normally easier to "tame down" than to "tame up" as new ways of
thinking and looking at the world may provide better solutions.
•Quantity Wanted: The greater the number of ideas generated, the
greater the chance of producing a radical and effective solution.
•Combine and improve ideas: Not only are a variety of ideals wanted,
but also ways to combine ideas in order to make them better.
Identification of PossibleCauses
33
List out all possible causes for problem
Tool used: Cause and Effect Diagram
Cause and Effect Diagrams help you to think through causes of a problem
thoroughly.
• A cause-and-effect analysis generates possible causes of problems.
• This tool provides a means of generating ideas about why the problem is
occurring and possible effects of that cause.
• It allows problem solvers to broaden their thinking and look at the overall
picture of a problem.
• It can reflect either causes that block the way to the desired state or
helpful factors needed to reach the desired state.
Step-5: Identification of PossibleCauses
34
Types of Cause & Effect Diagram
Dispersion Method
Cause Enumeration
Production Process Classification
Dispersion Method is simple method where the causes are
dispersed under Man, Machine, Method & Material Headers
Cause Enumeration is a method where the causes are listed down
based on the Effect selected
Production Process Classification is a method where all the causes
are listed down in the Process Selected
60
Step-5: Identification of Possible Causes
Step-5a: List out all possible causes for problem
 Tool used: Cause and Effect Diagram
Men
Material Method
P
allet missing
rejections
Measurement
Operator fatigue
Plates scrap segregation
Lack of awareness
Untrained operator
Un skilled operator kills
More bottom paste
Paddles improper rotation
Insufficient paste
feeding
Center strip flexibility
Plates getting damaged
Pasting belt tension
variation
belt length uneven
Improper machine
alignment
Plate thickness
low
Environment Machine
Variation in Air pressure
Compressor problem
Hopper knurling roller
damage
Caps screw hitting the
roller
More width of center strip
Insufficient paste feed on grid
Improper feeding of the grids
Feeder problem
CCS water temp.low
Environmentinfluence
Paste d
ensity variation
Plates damaged at the flash
drier Plate traveling
Squeezing roller scraper
worn out
Improper squeezing
s
Lack of
Identification of PossibleCauses
List out Critical Causes
 Tool used: Ranking method / Cause and effect matrix
Possible Causes Validation through Data/
Gemba observation
Critical/ Non
Critical
Man Untrained operators Verified the Past Records
Training given to all Operators
Non Critical
Absenteeism Absenteeism does not
Influence the Current Problem
Non Critical
Lack of knowledge All Operators have required
Knowledge based on Skill
Matrix
Non Critical
Wrong parameter setting in
MIG machine
Machine will alarm if we set
Wrong Parameters
Non Critical
No regular Employees All the Employees are Regular
& ARTS
Non Critical
Method Change over time is high Yes Change Over Time is High
due to More Tools
Critical
More time taken for fixture
change
Yes No identification of
Fixtures
Critical
37
Finding out the Root causes
The technique was originally developed
by Sukichi Toyoda and was later used
within Toyota Motor Corporation during
the evolution of their manufacturing
methodologies.
Described the why why method as "the
basis of Toyota's scientific approach . . .
by repeating why five(5) times
38
Finding out the Root causes
 Tool used: Why why analysis
5 whys technique is used to
understand/analyse the true root cause
of a problem
small group.
for any
5 Whys
 quick and simple to do.
 most effective when
brainstorming in a
 can be used
problem or issue
Although it is called the
technique we get root cause
39
DataAnalysis for Root causes
A Pareto chart is used to graphically summarize
an display the relative importance of
the difference between groups of data after
doing a cause-and effect analysis.
The Pareto Principle states that only a "vital
few" factors are responsible for producing most
of the problems.
Tool : Pareto Analysis
Pareto analysis is a statistical technique in
decision making that is used for selection of a
limited number of tasks that produce significant
overall effect
d s
-
40
Developing Solutions
Identify solution for each root cause
through brainstorming
Validate feasibility to implement
41
Team Acceptance for Solutions implementation
Team accepted the solutions for implementation
42
Implementation
 Identify the team responsible
for implementation
 Arrive the schedule for the
implementation
 Fix batch qty for the trial
43
 Dr.walter Andrew Shehwart , an American Physicist and Engineer and Statistician .
 He is father of “Statistical Quality Control”.
 He joined in western electrical company as an inspection Engineer in Inspection
Engineering department , till that time , Quality is just about the removing the defective
items from the Finished goods .
 In 1924, he gave his boss at AT&T, George Edwards, a short note that represent the
methodology for creating the control chart.
 Shehwart’s insist the need of reducing the variation in a manufacturing process.
 Dr.walter Andrew Shewhart -- Father of Statistical Quality Control.
 Dr.William Edwards Deming
 Dr.Joseph Moses Juran
 Dr.Kaoru Ishikawa
 Prof.Prasanta Chandra Mahalnobis
 Crosby
 Shigeo shingo
 Taguchi
46

Problem Solving Tools.pptx and basix 7Qc Tools and QCC -12 Steps Problem solving method

  • 1.
  • 2.
    Total Quality Management •What is TQM ? • TQM is the integration of all functions and processes within an organization in order to achieve continuous improvement of the quality of goods and services.  Total  Quality : Make up of the whole : Degree of excellence a product or service provides  Management : Act, art, or manner of handling, controlling, directing • Goal is Customer satisfaction.
  • 3.
    Total Quality Management Quality is conformance to standards, • specifications or requirements : Crosby,1979  Quality is fitness for use : Juran,1989 Peters andWaterman, 1982  Quality as excellence :  Quality is concerned with meeting • or exceeding customer expectations : Parasuraman,1985  Quality means delighting the customer : Peters, 1989 What is Quality ?  Quality is value : Feigenbaum,1983
  • 4.
    Types of problemsolving processes  DMAIC  8D  PDCA
  • 5.
    DMAIC DMAIC (an acronymfor Define, Measure, Analyze, Improve and Control) (pronounced də-MAY- ick) refers to a data-driven improvement cycle used for improving, optimizing and stabilizing business processes and designs.
  • 6.
    DMAIC D – Define Definethe problem, improvement activity, opportunity for improvement, the project goals, and customer (internal and external) requirements. “What is the problem?” M – Measure Measure process performance. “How are we doing?” A – Analyze Analyze the process to determine root causes of variation, poor performance (defects). “What is wrong?”
  • 7.
    DMAIC I – Improve Improveprocess performance by addressing and eliminating the root causes. “What needs to be done?” C – Control Control the improved process and future process performance. “How do we guarantee performance?”
  • 8.
    Basic Seven Toolsof Quality  Fishbone Diagrams  Histograms  Pareto Analysis  Flowcharts  Scatter Plots  Run Charts  Control Charts
  • 9.
     In 1924- Shewhart’s control charts  Shewhart became the first to recognize the variability was the fact of industrial life.  Father of Statistical Quality Control 9
  • 10.
    1  Discovered thework of Vilfredo Pareto (1848 - 1923) and expanded the Pareto Principle (80 : 20 Rule)  Invited J.M.Juran for Managing for Quality in 1954 Quality of the products depends on Man , Machine , Material, Method & Measurement Dr. Juran says Quality as ‘Fitness For Use’ Dr. K.Ishikawa is known as the ‘Father of quality circle’. 3
  • 11.
     1949 –Ishikawa Joined JUSE. Invented Cause & Effect diagram / Fish Bone Diagram/Ishikawa Diagram 11 Workers felt easy to arrive Solutions for the causes Worker are happy and formed circle and arrived the solutions
  • 12.
    PDCA PDCA (plan-do-check-act, sometimesseen as plan-do-check-adjust) is a repetitive four-stage model for continuous improvement (CI) in business process management.
  • 13.
     Improvement throughPDCA P – Identify, Analyse the problems and set Targets D – Develop and Implement the solution C – Check the results A – To hold the gains or Improve further 12 Japan workers not satisfied –Feels threat to their job Deming award & Japanese quality medal introduced.
  • 14.
    PDCA  P –Plan  Recognize an opportunity and plan a change.  D – Do  Test the change.  Carry out a small-scale study.  C – Check  Review the test, analyze the results and identify what you’ve learned.  A – Act  Take action based on what you learned in the study step: If the change did not work, go through the cycle again with a different plan. If you were successful, incorporate what you learned from the test into wider changes. Use what you learned to plan new improvements, beginning the cycle again.
  • 15.
    8D The Eight Disciplinesof Problem Solving (8D) is a problem solving methodology designed to find the root cause of a problem, devise a short-term fix and implement a long-term solution to prevent recurring problems.
  • 16.
    8D  D0: Plan—Planfor solving the problem and determine the prerequisites.  D1: Use a team—Establish a team of people with product/process knowledge.  D2: Define and describe the problem—Specify the problem by identifying in quantifiable terms the who, what, where, when, why, how, and how many (5W2H) for the problem.  D3: Develop containment plan; implement and verify actions—Define and implement containment actions to isolate the problem from any customer.  D4: Determine, identify, and verify root causes and escape points—Identify all applicable causes that could explain why the problem occurred. Also identify why the problem was not noticed at the time it occurred. All causes shall be verified or proved, not determined by fuzzy brainstorming. One can use 5 Whys and cause and effect diagrams to map causes against the effect or problem identified.
  • 17.
    8D  D5: Chooseand verify permanent corrections (PCs) for problem/nonconformity— Through preproduction programs, quantitatively confirm that the selected correction will resolve the problem for the customer.  D6: Implement and validate corrective actions—Define and implement the best corrective actions.  D7: Take preventive measures—Modify the management systems, operation systems, practices, and procedures to prevent recurrence of this and all similar problems.  D8: Congratulate your team—Recognize the collective efforts of the team. The team needs to be formally thanked by the organization.
  • 18.
     Correction –Action to Eliminate a Detected Non- Conformity  Corrective Action – Action to eliminate the cause of Detected Non-Conformity  Preventive Action – Action to eliminate the cause of Potential Non-Conformity Preventive Action is taken to prevent Occurrence whereas Corrective Action is taken to prevent Recurrence
  • 19.
    Problem Solving Methodology andTools & Techniques 19
  • 20.
    • A problemis an obstacle , impediment, difficulty or challenge to achieve a desired goal  a state of difficulty that needs to be resolved.  a discrepancy between existing and a desired state of affairs. 20 About Problems
  • 21.
    About Problem Solving ProblemSolving is the process of tackling problems in a systematic and rational way. Problem Solving Process 21
  • 22.
    About Problem Solving ProblemSolving is about to identify problems, causes and solution: Thinking Differently-Concepts Talking Differently -Vocabulary Doing Differently -Tools 22
  • 23.
    Why to solveProblems Problems are solved to •improve effectiveness and efficiency of processes •become a “World Class Company” •improve the customer satisfaction •reduce COPQ •improve the bottom line measures of the business 23
  • 24.
    Problem Solving Methodology 24 Step-1: Step-2: Step-3: Step-4: Step-5: Step-6: Step-7: Step-8: Step-9: Identificationof Problem (work related Problem) Selection of the Problem Definition of Problem Analysis of Problem Identification of causes(Possible) Finding out the Root causes Data Analysis Development of solutions Foreseeing Probable Resistance Step-10: Trial Implementation and check Performance Step-11: Regular Implementation Step-12: Follow up and Review
  • 25.
    Problem Analysis Understanding theproblem Critical step of the problem solving is to understand the problem fully as possible in the context in which way it occurs . Understand by what means and ways the problem is creating. Can understand contributors for the problem 25
  • 26.
    Step-4: ProblemAnalysis Step-4b: Understandingthe problem Tool used: 4W 1H 4W 1H is a technique used to understand the problem and collect Key Information about the problem It is an amazing tool in different situations where one needs to clarify or understands something in more depth. 26
  • 27.
    Step-4: ProblemAnalysis Step-4b: Understandingthe problem What is the problem -- Purpose ( We have to write our problem in detail) Where is it happening -- Place ( On the product/process which location/area the problem is occurring) When is it happening -- Sequence/Pattern ( At what time it is happening/How it is Happening) Who is effected -- Person ( The Persons who are effecting while doing this process) How does it happen & many times -- Means ( How the Problem is Occurring/How many times it is Happening) 27
  • 28.
    Identification of PossibleCauses Toolused : Brain storming, Cause & Effect diagram 28
  • 29.
    Identification of PossibleCauses Brainstorming Methods  Free wheeling or Unstructured  Slip Method  Round Robin or Structured process 29
  • 30.
    Methods of Brainstorming Brainstormingcan be done in three ways 1.Free Wheeling or Unstructured No hold ,no bar (piece) system. No limit on number of ideas at a time. 2. Slip Method When you need the involvement of a large groups this method is essential for earning innovative ideas.ssential
  • 31.
    3. Round Robinor Structured Method a) Gather a group which is willing to work together. b) Select a leader. A leader is there in Quality Circle. c) He should have control over the group to encourage ideas. Generally , In Quality circles , we preferred this brainstorming Method.
  • 32.
    There are fourbasic rules in brainstorming : •No criticism: Criticism of ideas are withheld during the brainstorming session as the purpose is on generating varied and unusual ideals and extending or adding to these ideas. Criticism is reserved for the evaluation stage of the process. This allows the members to feel comfortable with the idea of generating unusual ideas. •Welcome unusual ideas: Unusual ideas are welcomed as it is normally easier to "tame down" than to "tame up" as new ways of thinking and looking at the world may provide better solutions. •Quantity Wanted: The greater the number of ideas generated, the greater the chance of producing a radical and effective solution. •Combine and improve ideas: Not only are a variety of ideals wanted, but also ways to combine ideas in order to make them better.
  • 33.
    Identification of PossibleCauses 33 Listout all possible causes for problem Tool used: Cause and Effect Diagram Cause and Effect Diagrams help you to think through causes of a problem thoroughly. • A cause-and-effect analysis generates possible causes of problems. • This tool provides a means of generating ideas about why the problem is occurring and possible effects of that cause. • It allows problem solvers to broaden their thinking and look at the overall picture of a problem. • It can reflect either causes that block the way to the desired state or helpful factors needed to reach the desired state.
  • 34.
    Step-5: Identification ofPossibleCauses 34 Types of Cause & Effect Diagram Dispersion Method Cause Enumeration Production Process Classification Dispersion Method is simple method where the causes are dispersed under Man, Machine, Method & Material Headers Cause Enumeration is a method where the causes are listed down based on the Effect selected Production Process Classification is a method where all the causes are listed down in the Process Selected
  • 36.
    60 Step-5: Identification ofPossible Causes Step-5a: List out all possible causes for problem  Tool used: Cause and Effect Diagram Men Material Method P allet missing rejections Measurement Operator fatigue Plates scrap segregation Lack of awareness Untrained operator Un skilled operator kills More bottom paste Paddles improper rotation Insufficient paste feeding Center strip flexibility Plates getting damaged Pasting belt tension variation belt length uneven Improper machine alignment Plate thickness low Environment Machine Variation in Air pressure Compressor problem Hopper knurling roller damage Caps screw hitting the roller More width of center strip Insufficient paste feed on grid Improper feeding of the grids Feeder problem CCS water temp.low Environmentinfluence Paste d ensity variation Plates damaged at the flash drier Plate traveling Squeezing roller scraper worn out Improper squeezing s Lack of
  • 37.
    Identification of PossibleCauses Listout Critical Causes  Tool used: Ranking method / Cause and effect matrix Possible Causes Validation through Data/ Gemba observation Critical/ Non Critical Man Untrained operators Verified the Past Records Training given to all Operators Non Critical Absenteeism Absenteeism does not Influence the Current Problem Non Critical Lack of knowledge All Operators have required Knowledge based on Skill Matrix Non Critical Wrong parameter setting in MIG machine Machine will alarm if we set Wrong Parameters Non Critical No regular Employees All the Employees are Regular & ARTS Non Critical Method Change over time is high Yes Change Over Time is High due to More Tools Critical More time taken for fixture change Yes No identification of Fixtures Critical 37
  • 38.
    Finding out theRoot causes The technique was originally developed by Sukichi Toyoda and was later used within Toyota Motor Corporation during the evolution of their manufacturing methodologies. Described the why why method as "the basis of Toyota's scientific approach . . . by repeating why five(5) times 38
  • 39.
    Finding out theRoot causes  Tool used: Why why analysis 5 whys technique is used to understand/analyse the true root cause of a problem small group. for any 5 Whys  quick and simple to do.  most effective when brainstorming in a  can be used problem or issue Although it is called the technique we get root cause 39
  • 40.
    DataAnalysis for Rootcauses A Pareto chart is used to graphically summarize an display the relative importance of the difference between groups of data after doing a cause-and effect analysis. The Pareto Principle states that only a "vital few" factors are responsible for producing most of the problems. Tool : Pareto Analysis Pareto analysis is a statistical technique in decision making that is used for selection of a limited number of tasks that produce significant overall effect d s - 40
  • 41.
    Developing Solutions Identify solutionfor each root cause through brainstorming Validate feasibility to implement 41
  • 42.
    Team Acceptance forSolutions implementation Team accepted the solutions for implementation 42
  • 43.
    Implementation  Identify theteam responsible for implementation  Arrive the schedule for the implementation  Fix batch qty for the trial 43
  • 44.
     Dr.walter AndrewShehwart , an American Physicist and Engineer and Statistician .  He is father of “Statistical Quality Control”.  He joined in western electrical company as an inspection Engineer in Inspection Engineering department , till that time , Quality is just about the removing the defective items from the Finished goods .  In 1924, he gave his boss at AT&T, George Edwards, a short note that represent the methodology for creating the control chart.  Shehwart’s insist the need of reducing the variation in a manufacturing process.
  • 45.
     Dr.walter AndrewShewhart -- Father of Statistical Quality Control.  Dr.William Edwards Deming  Dr.Joseph Moses Juran  Dr.Kaoru Ishikawa  Prof.Prasanta Chandra Mahalnobis  Crosby  Shigeo shingo  Taguchi
  • 46.