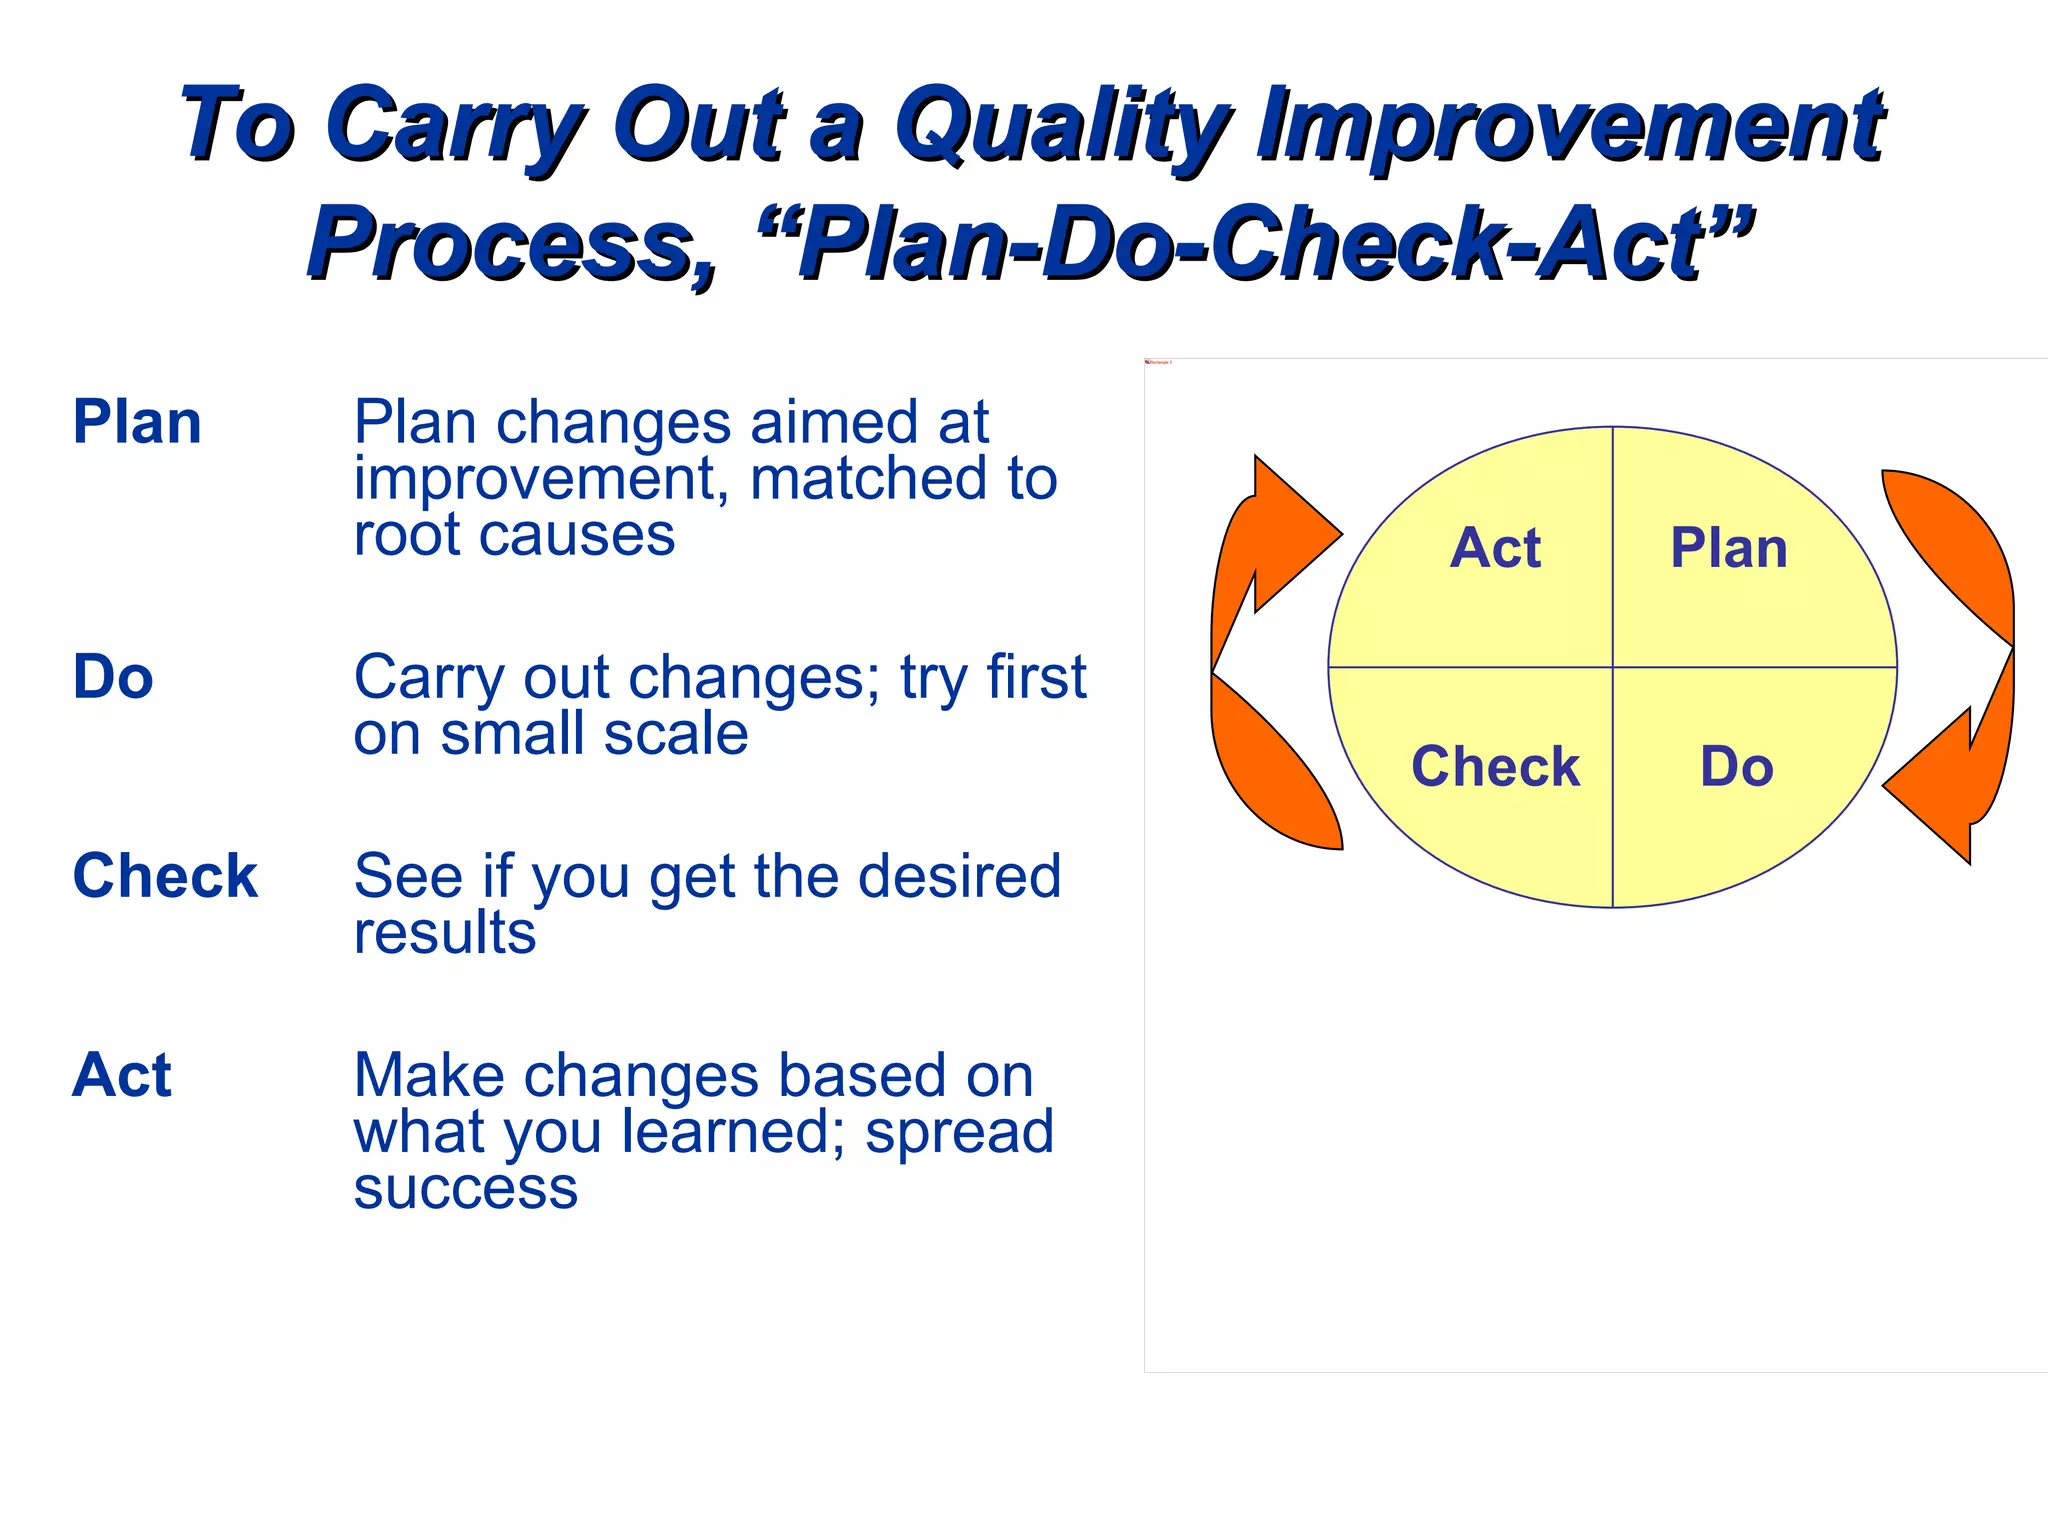
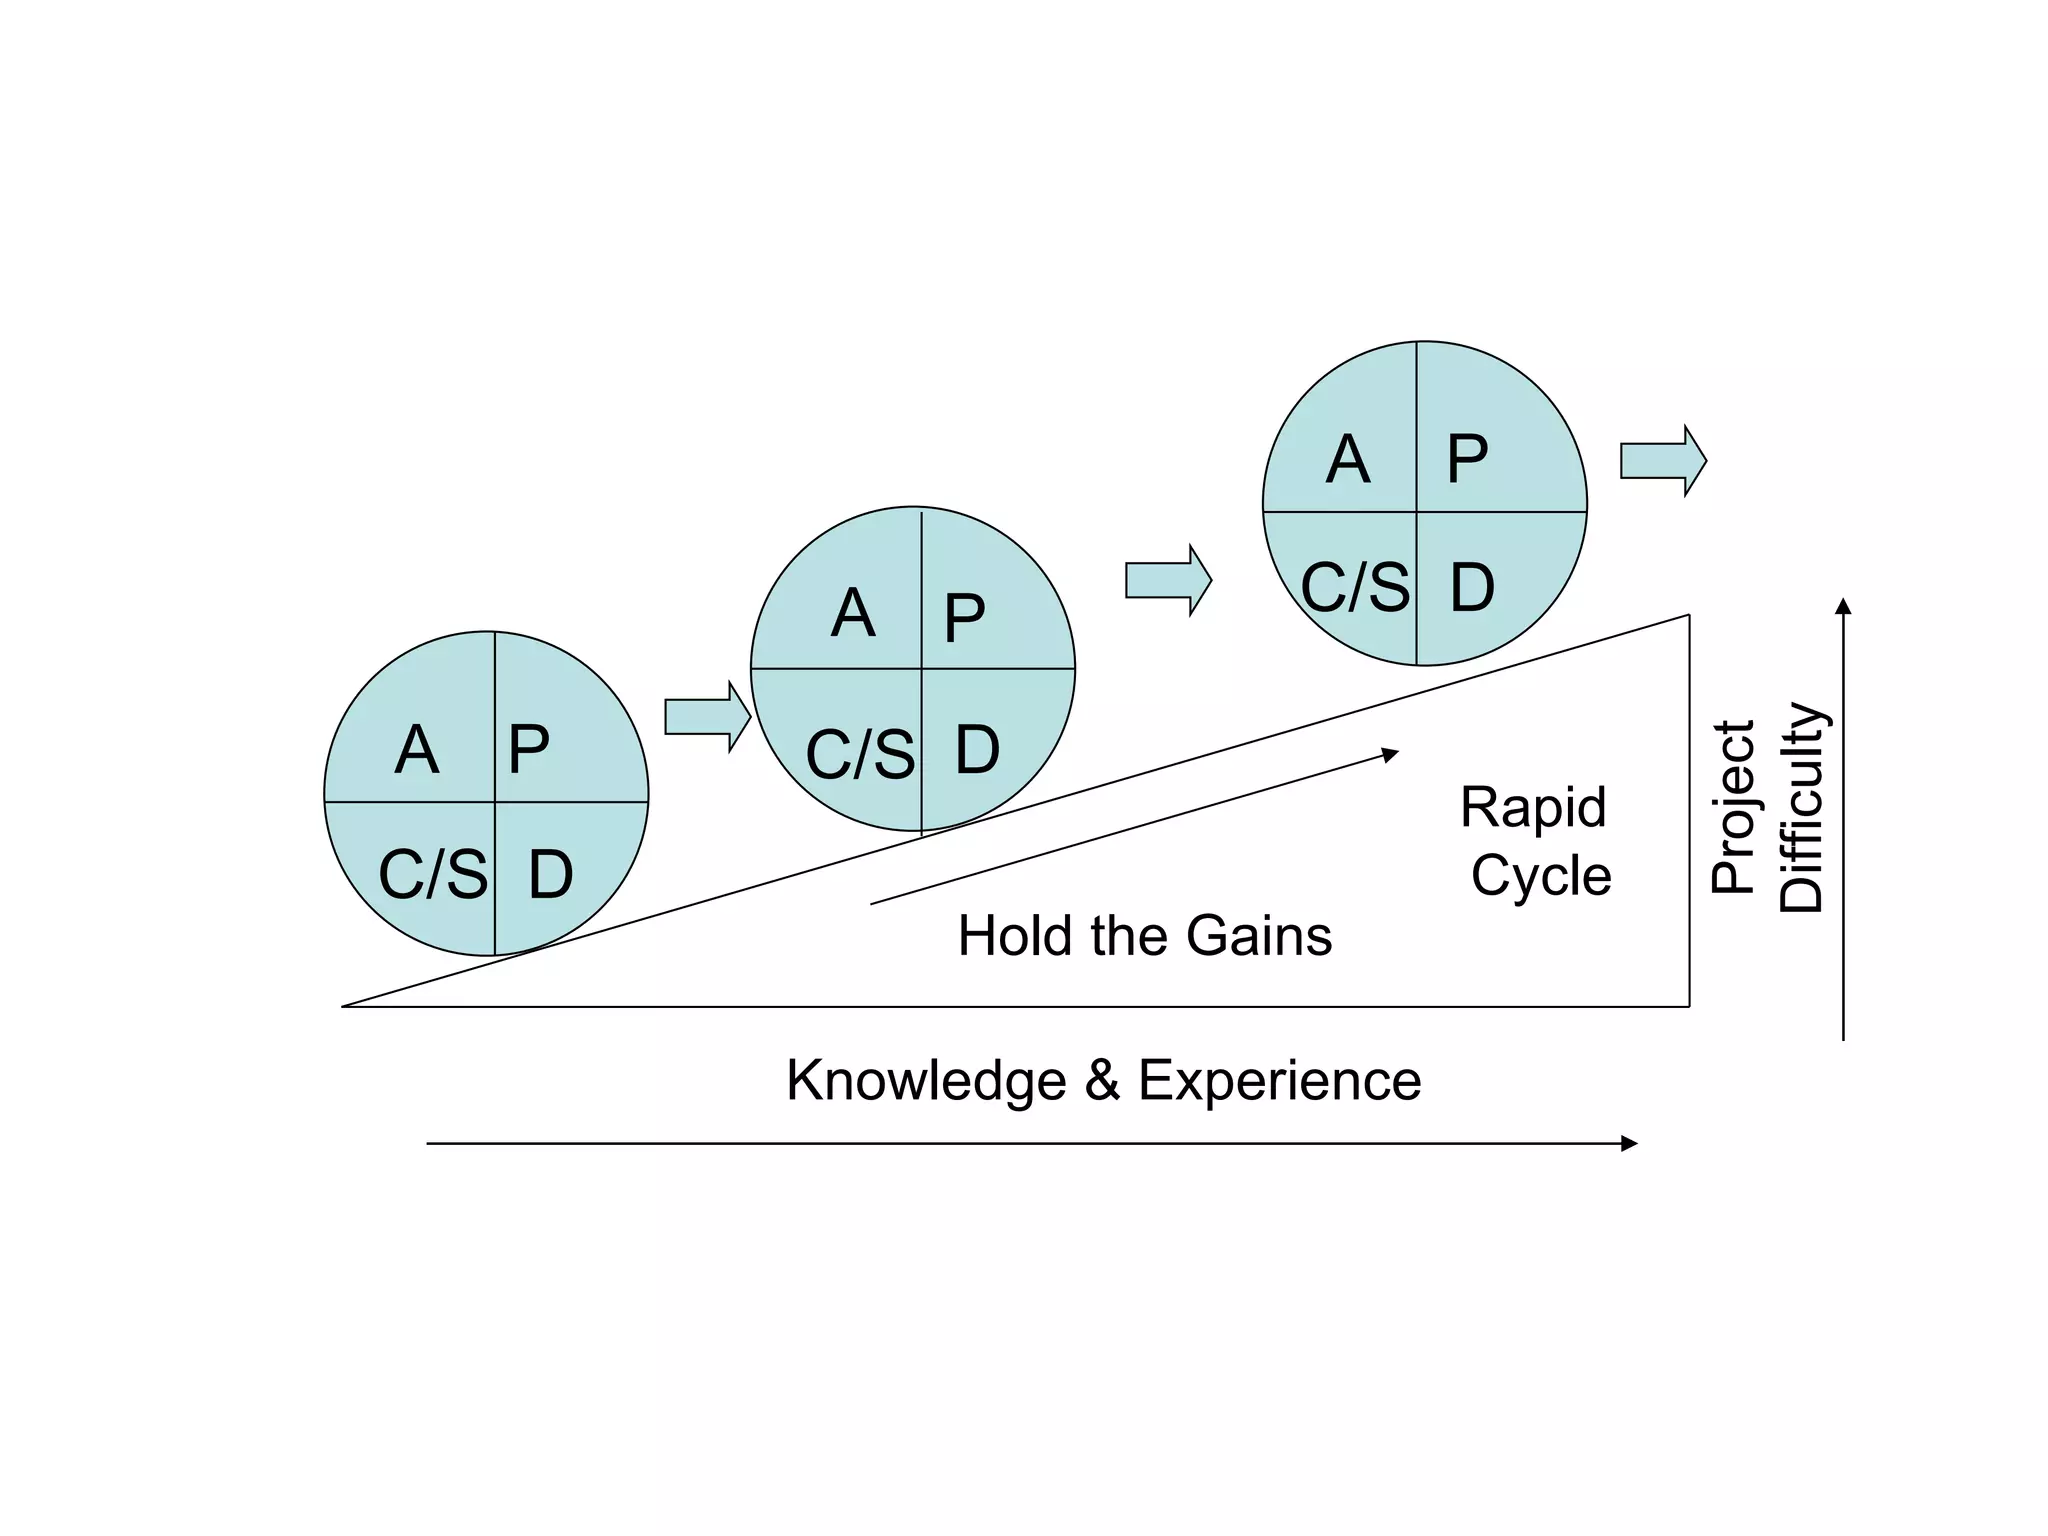
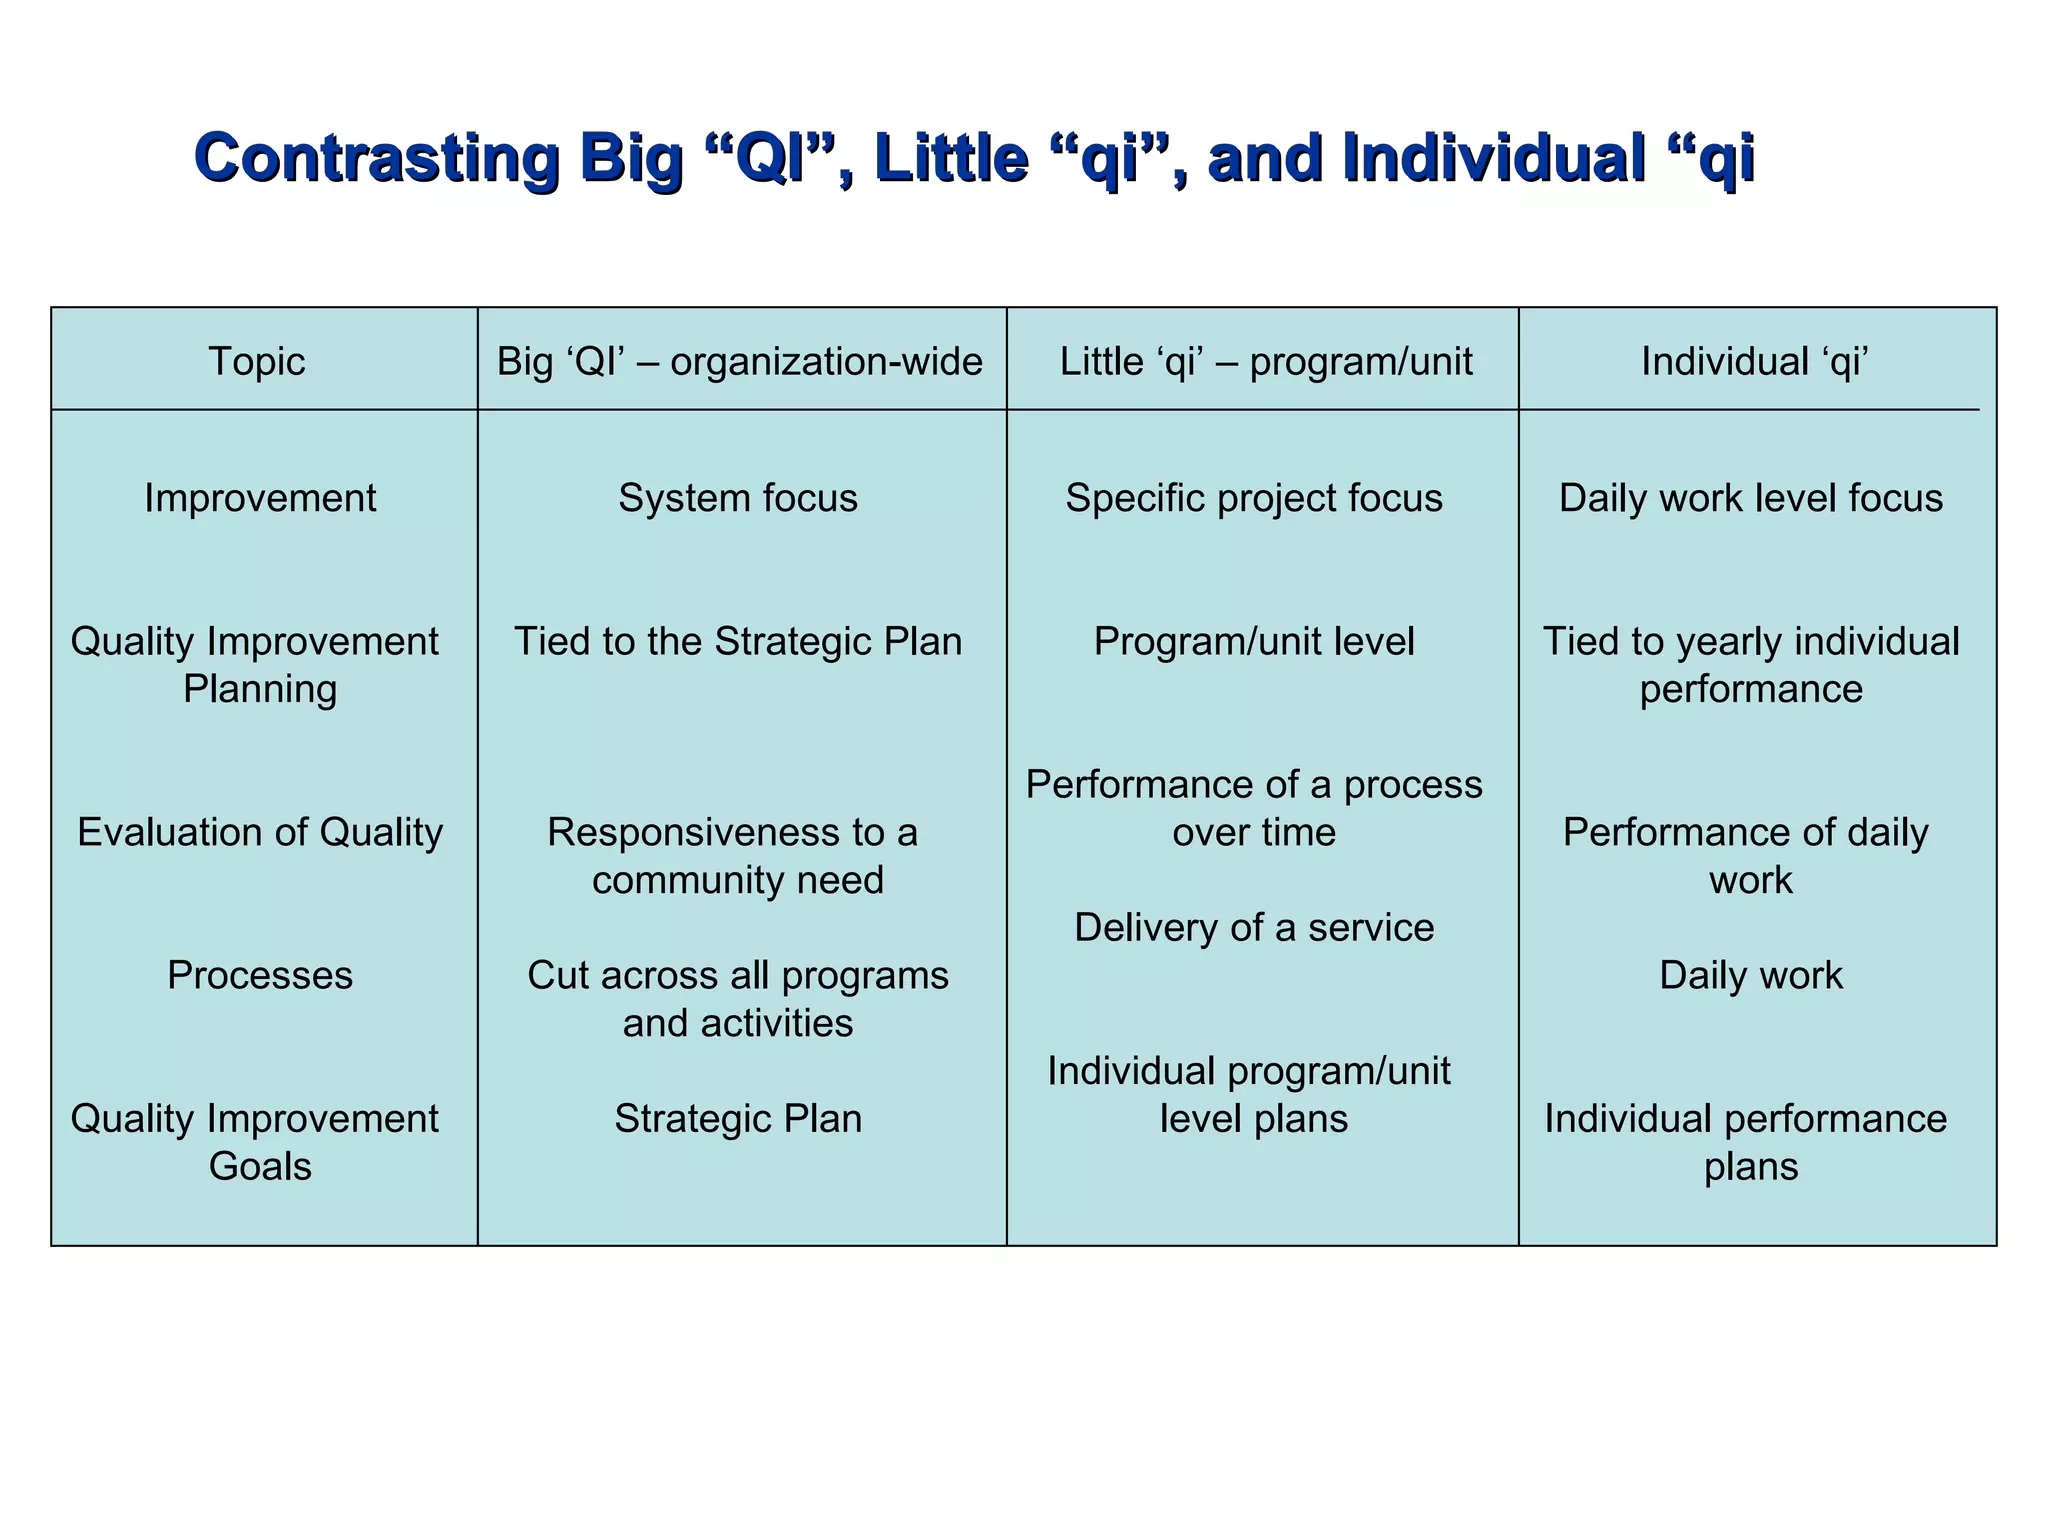
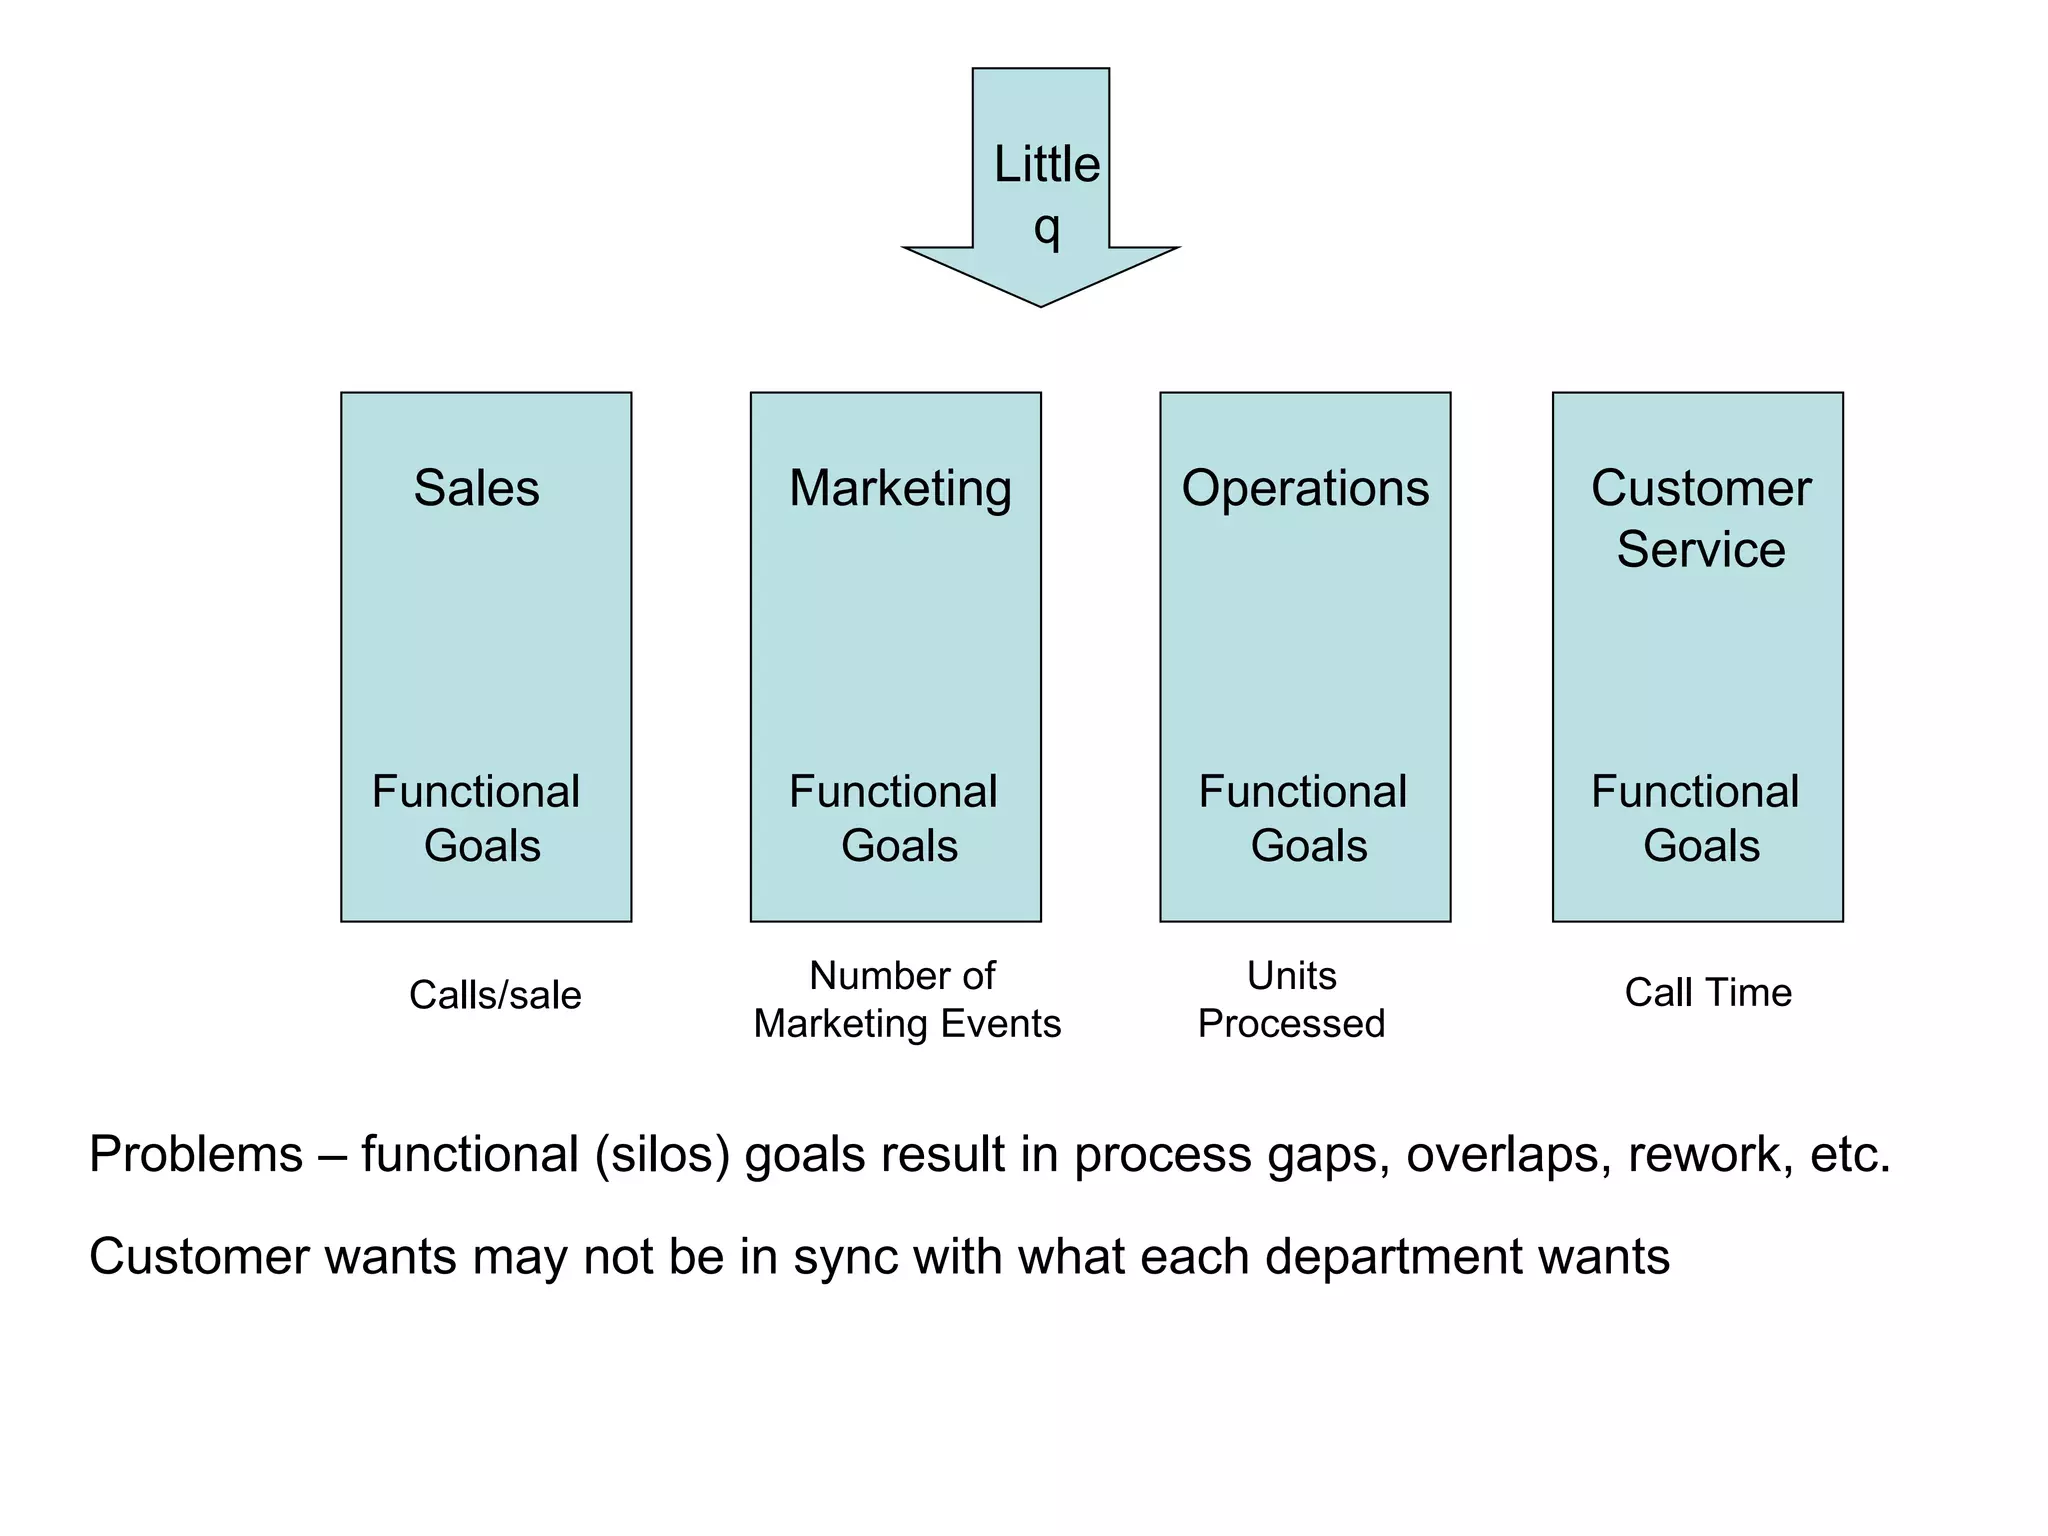
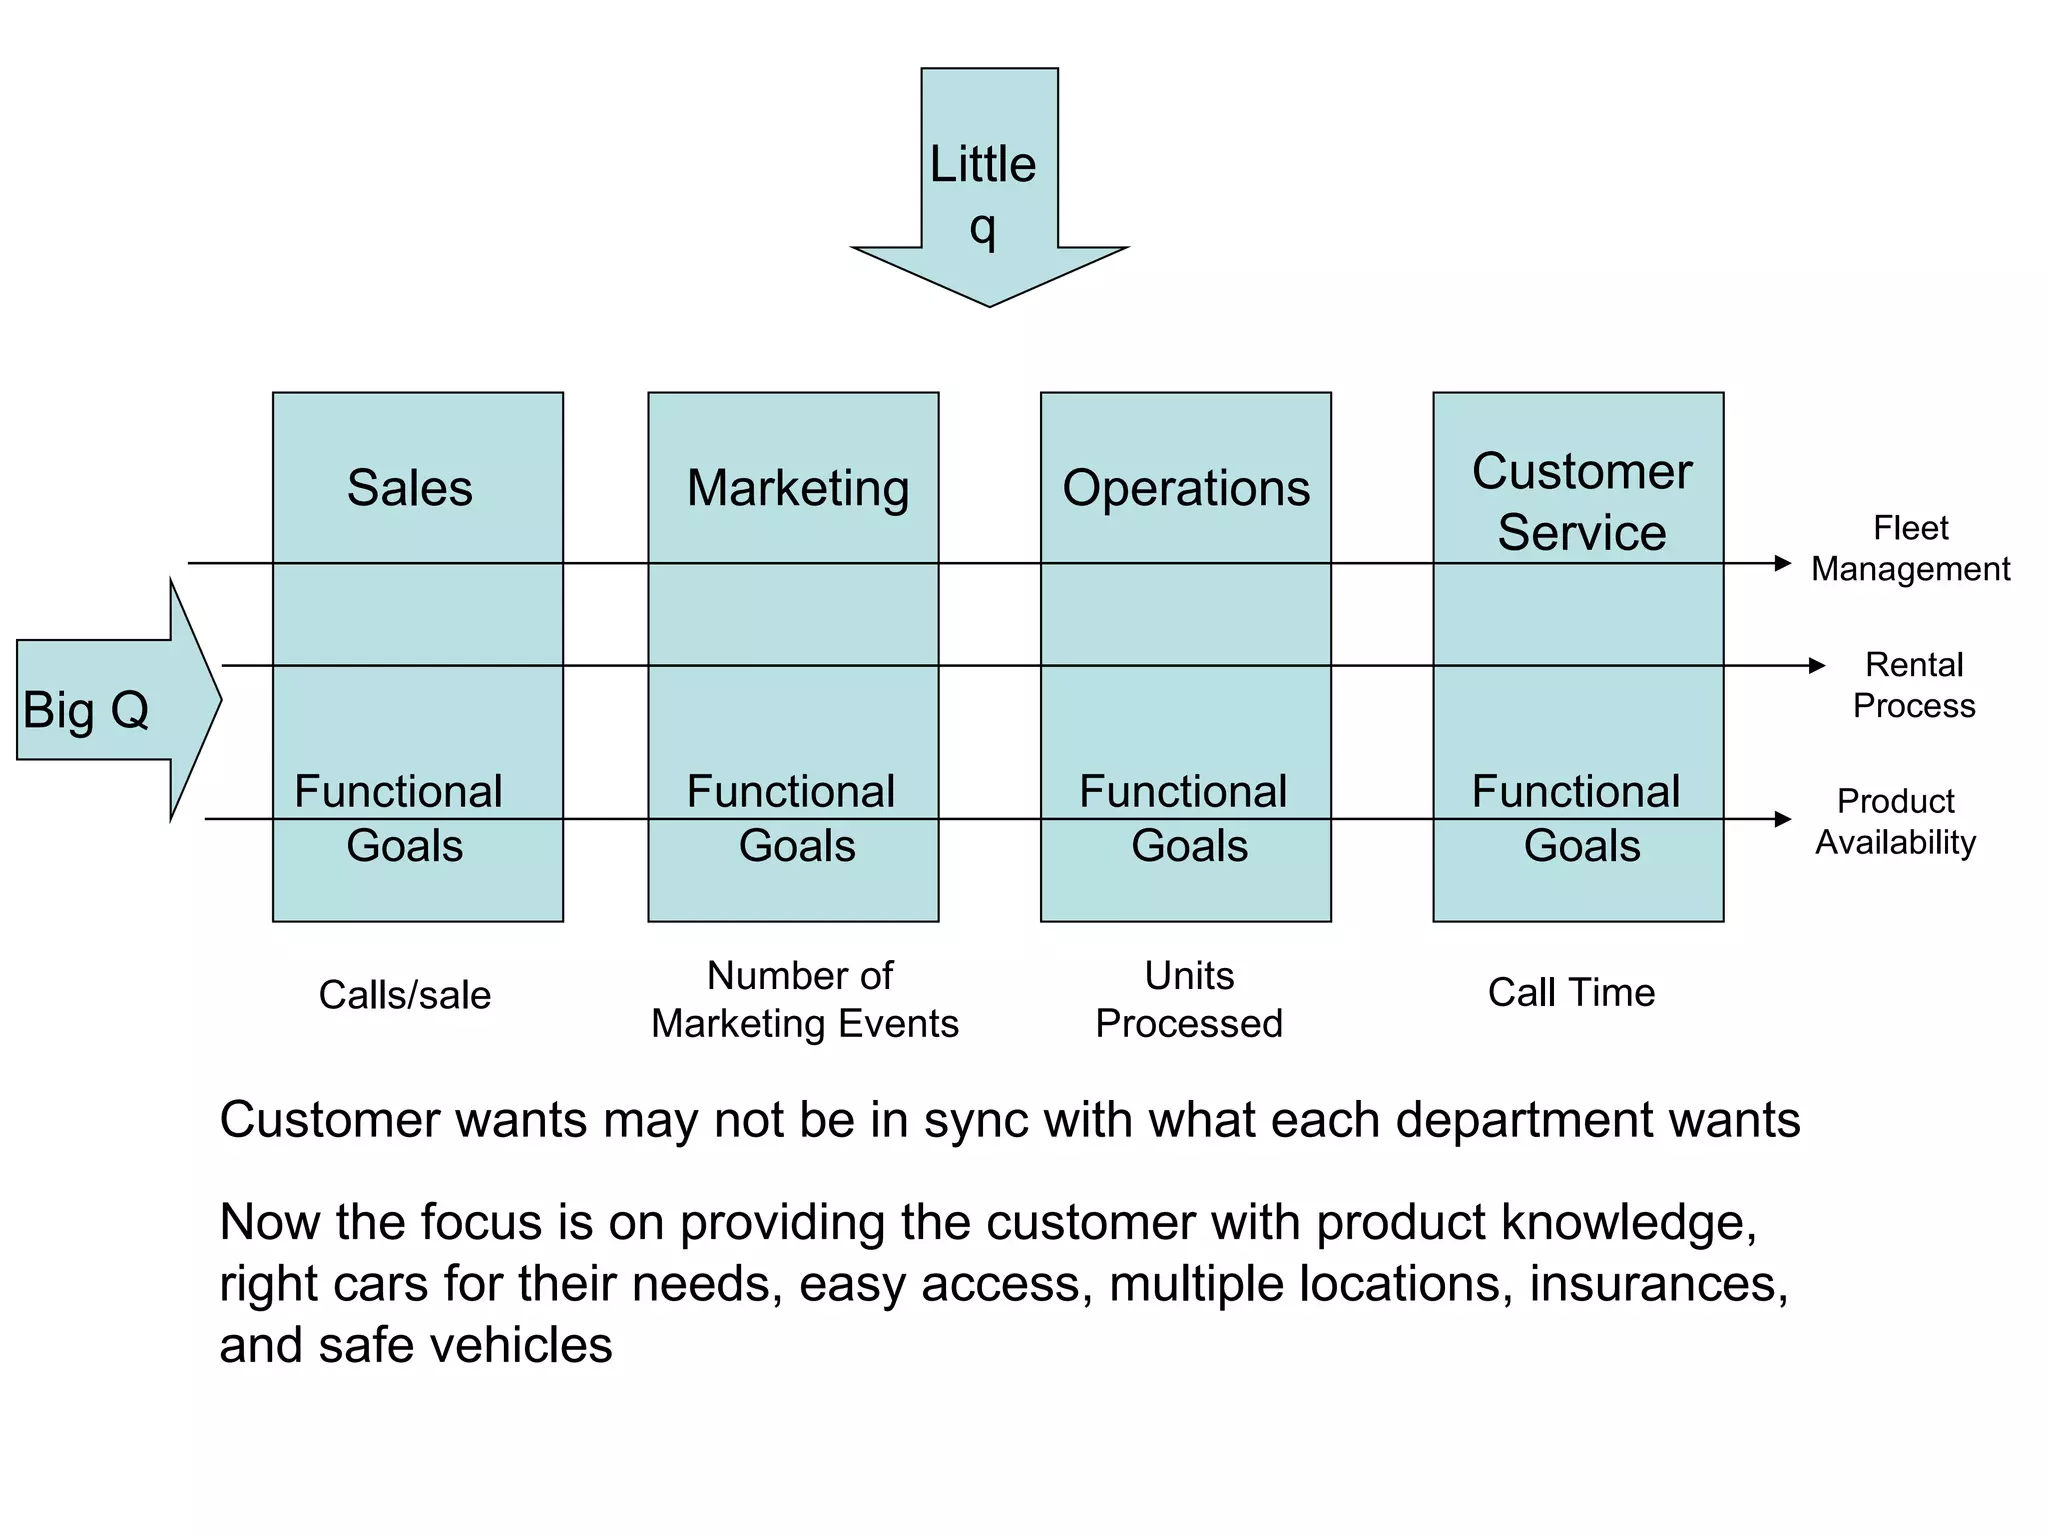
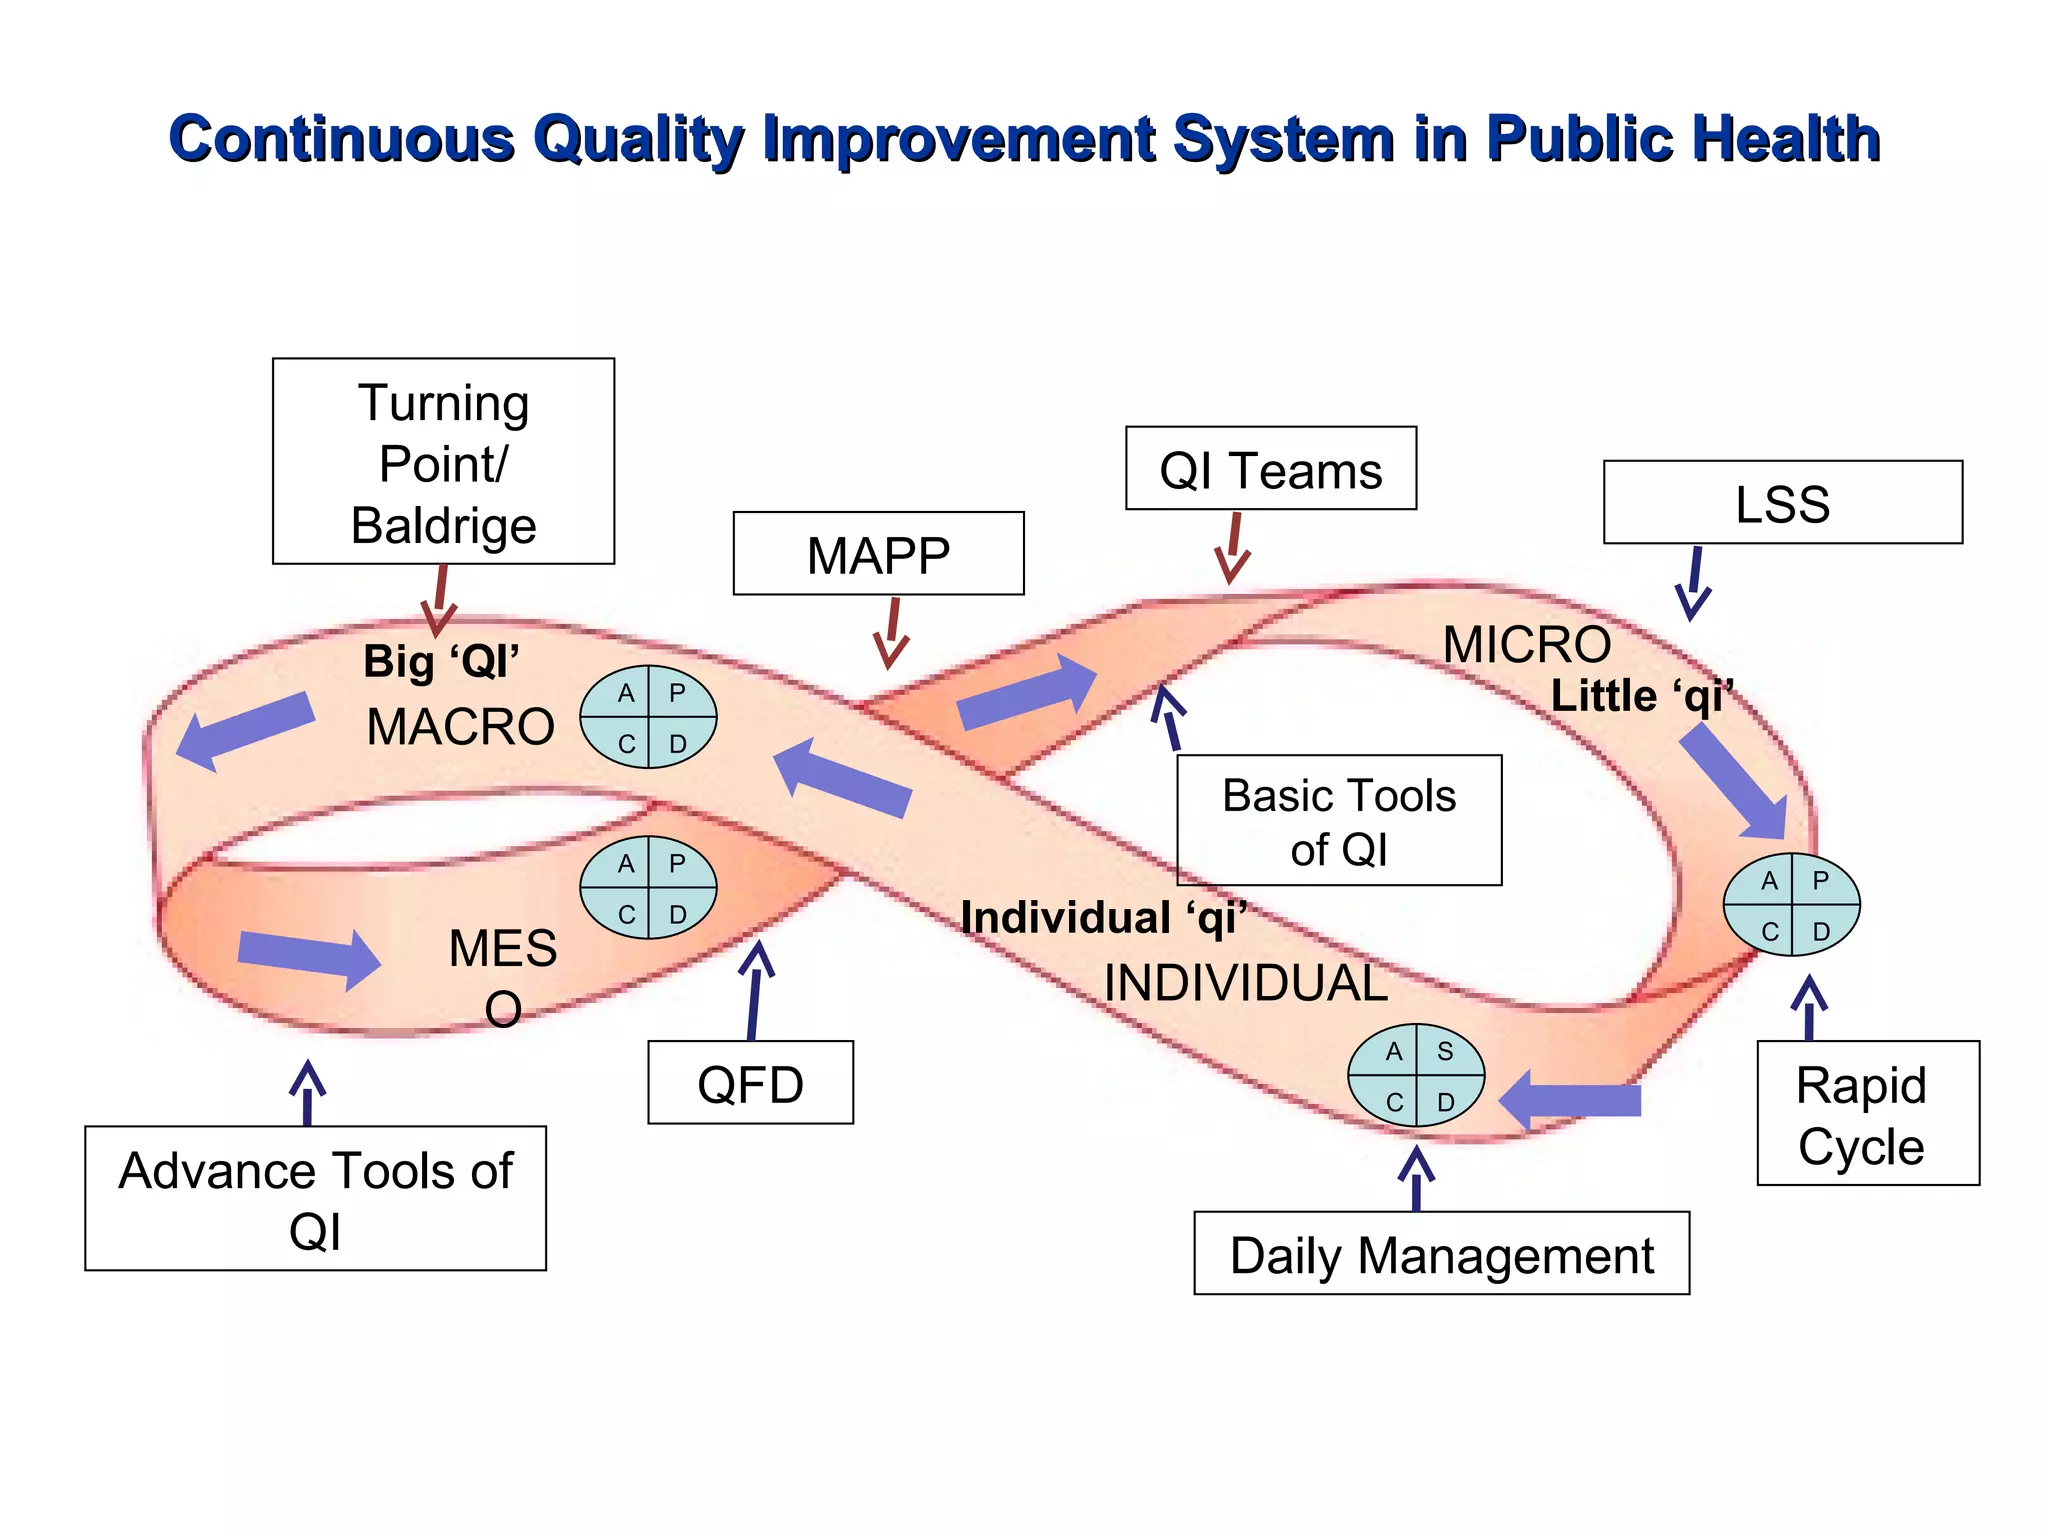
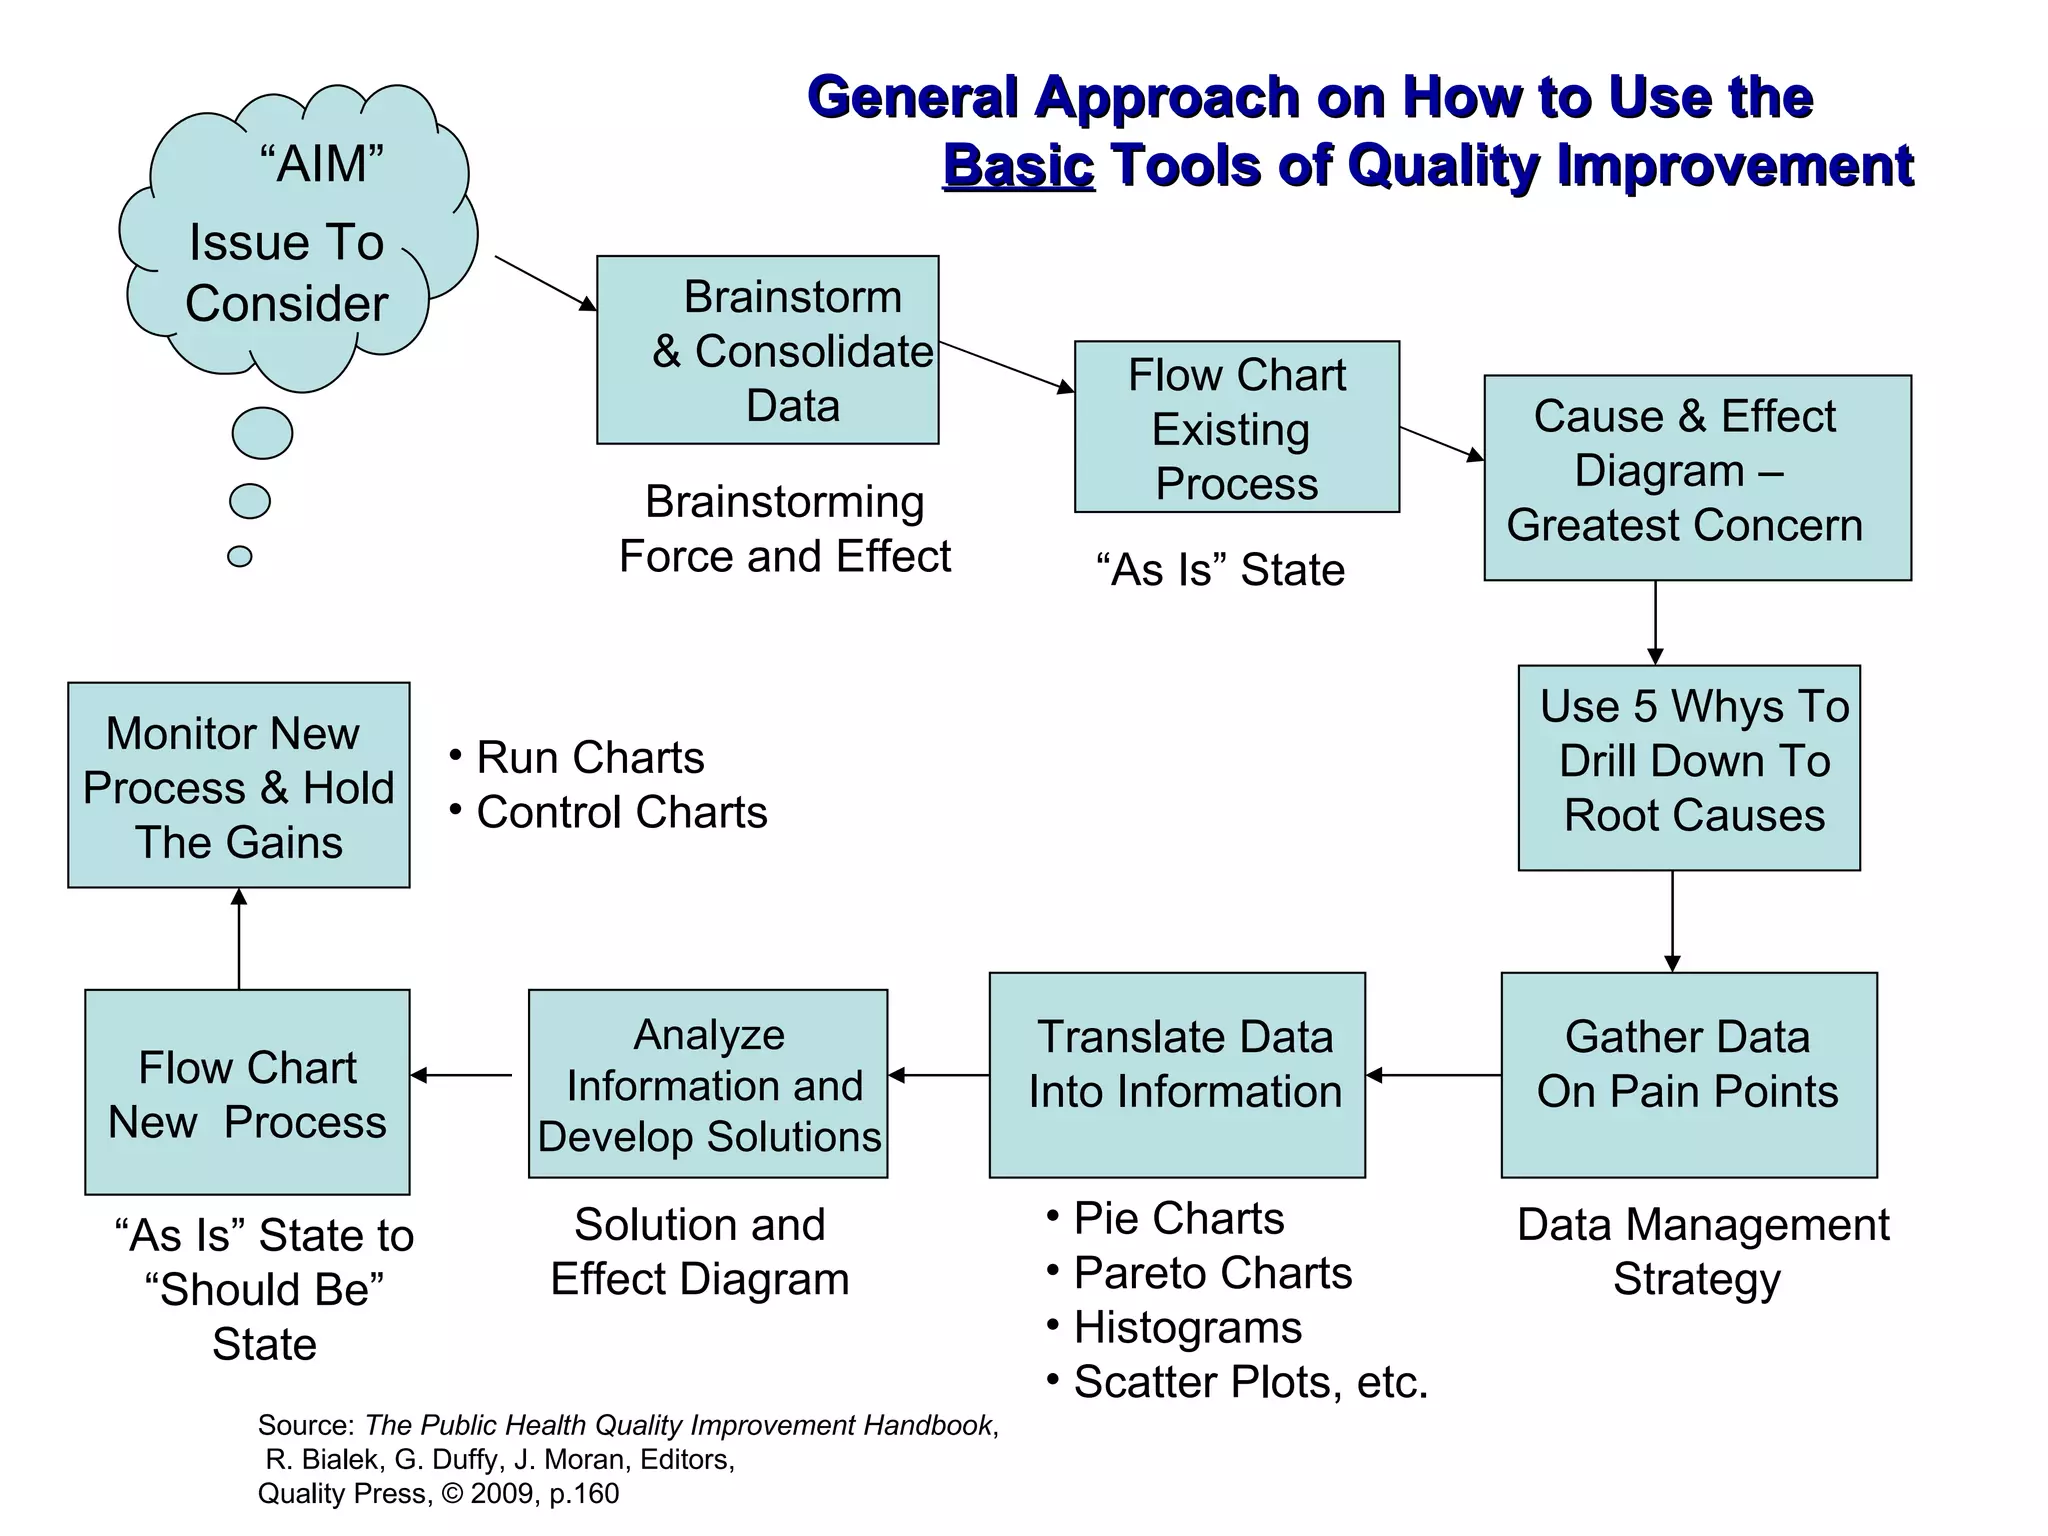
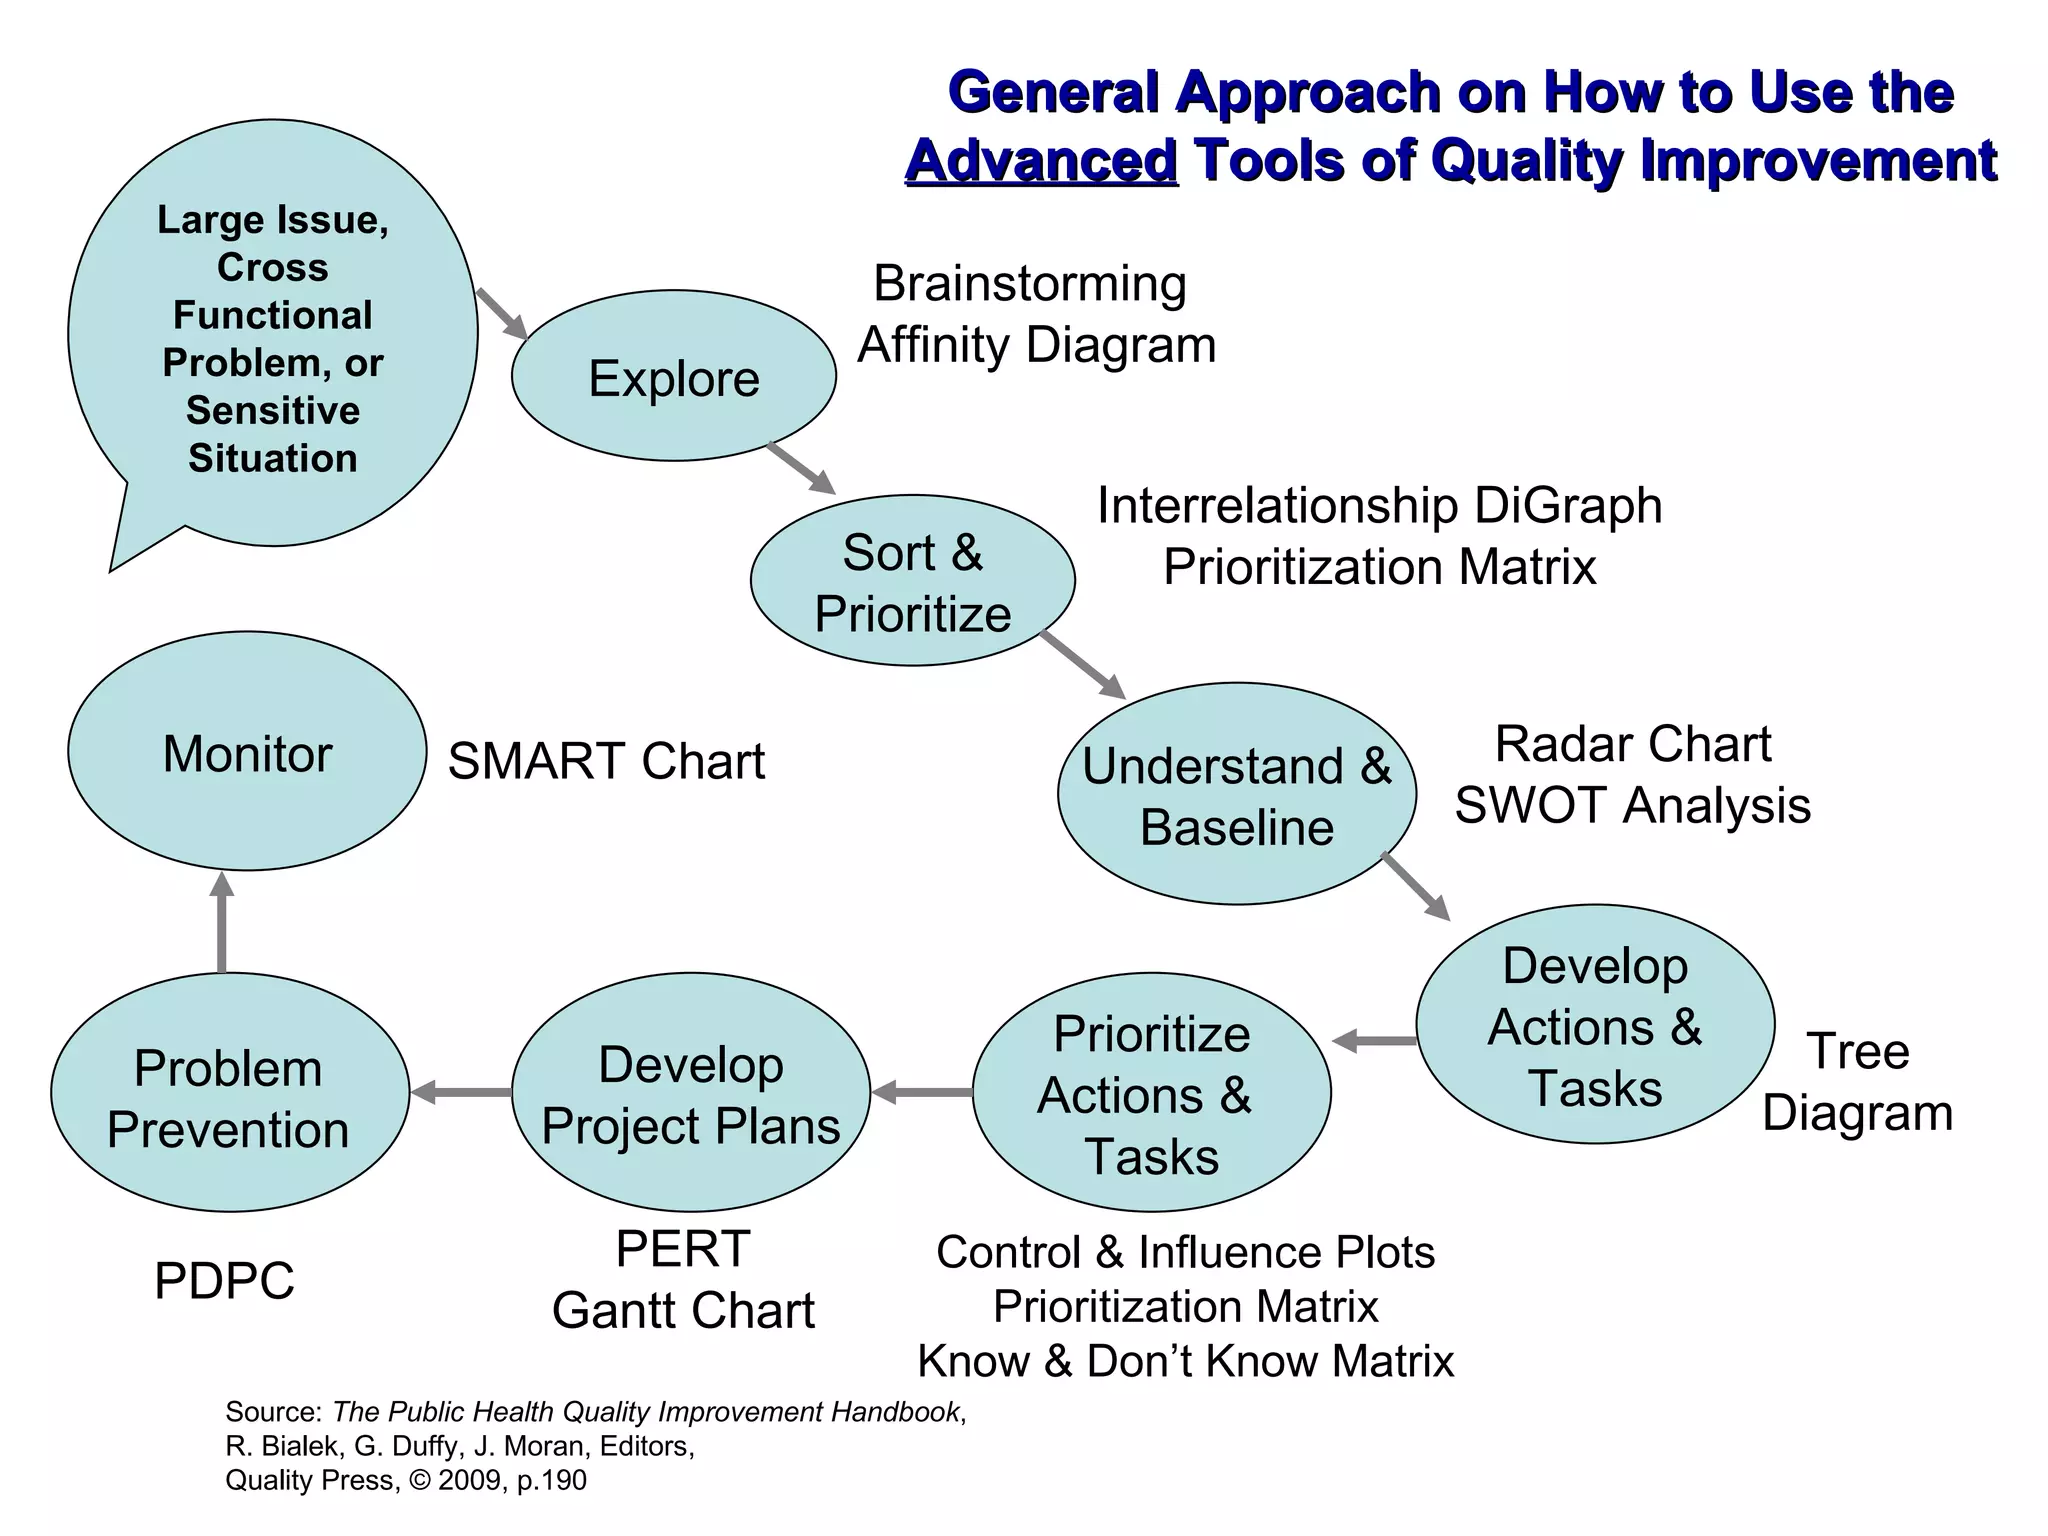
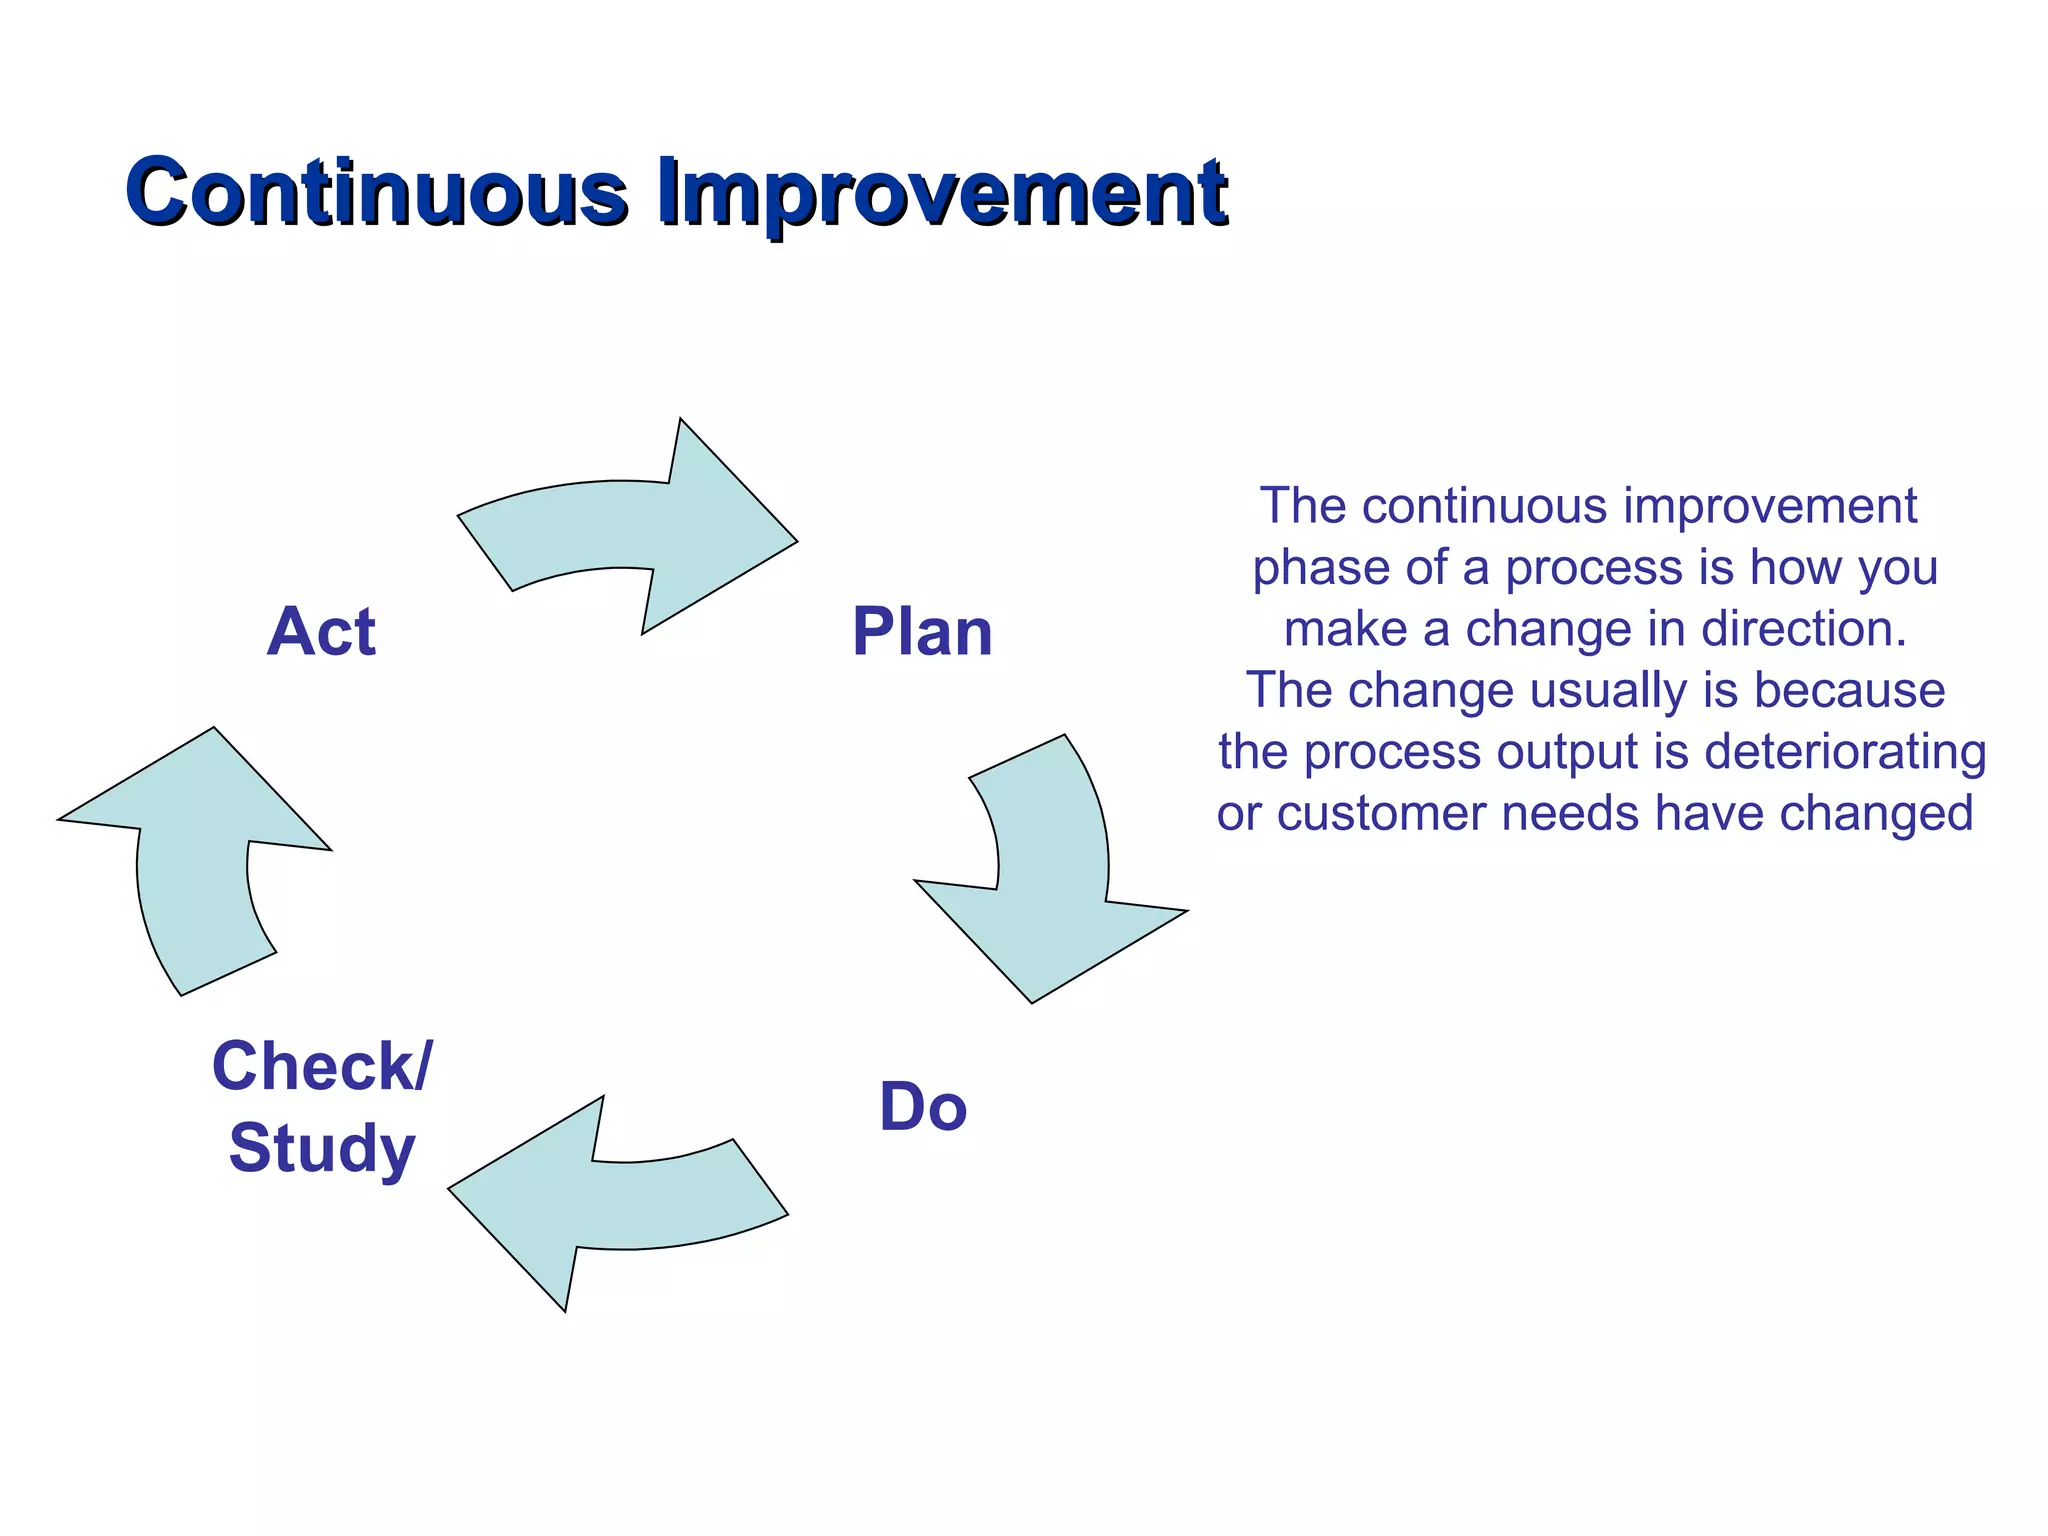
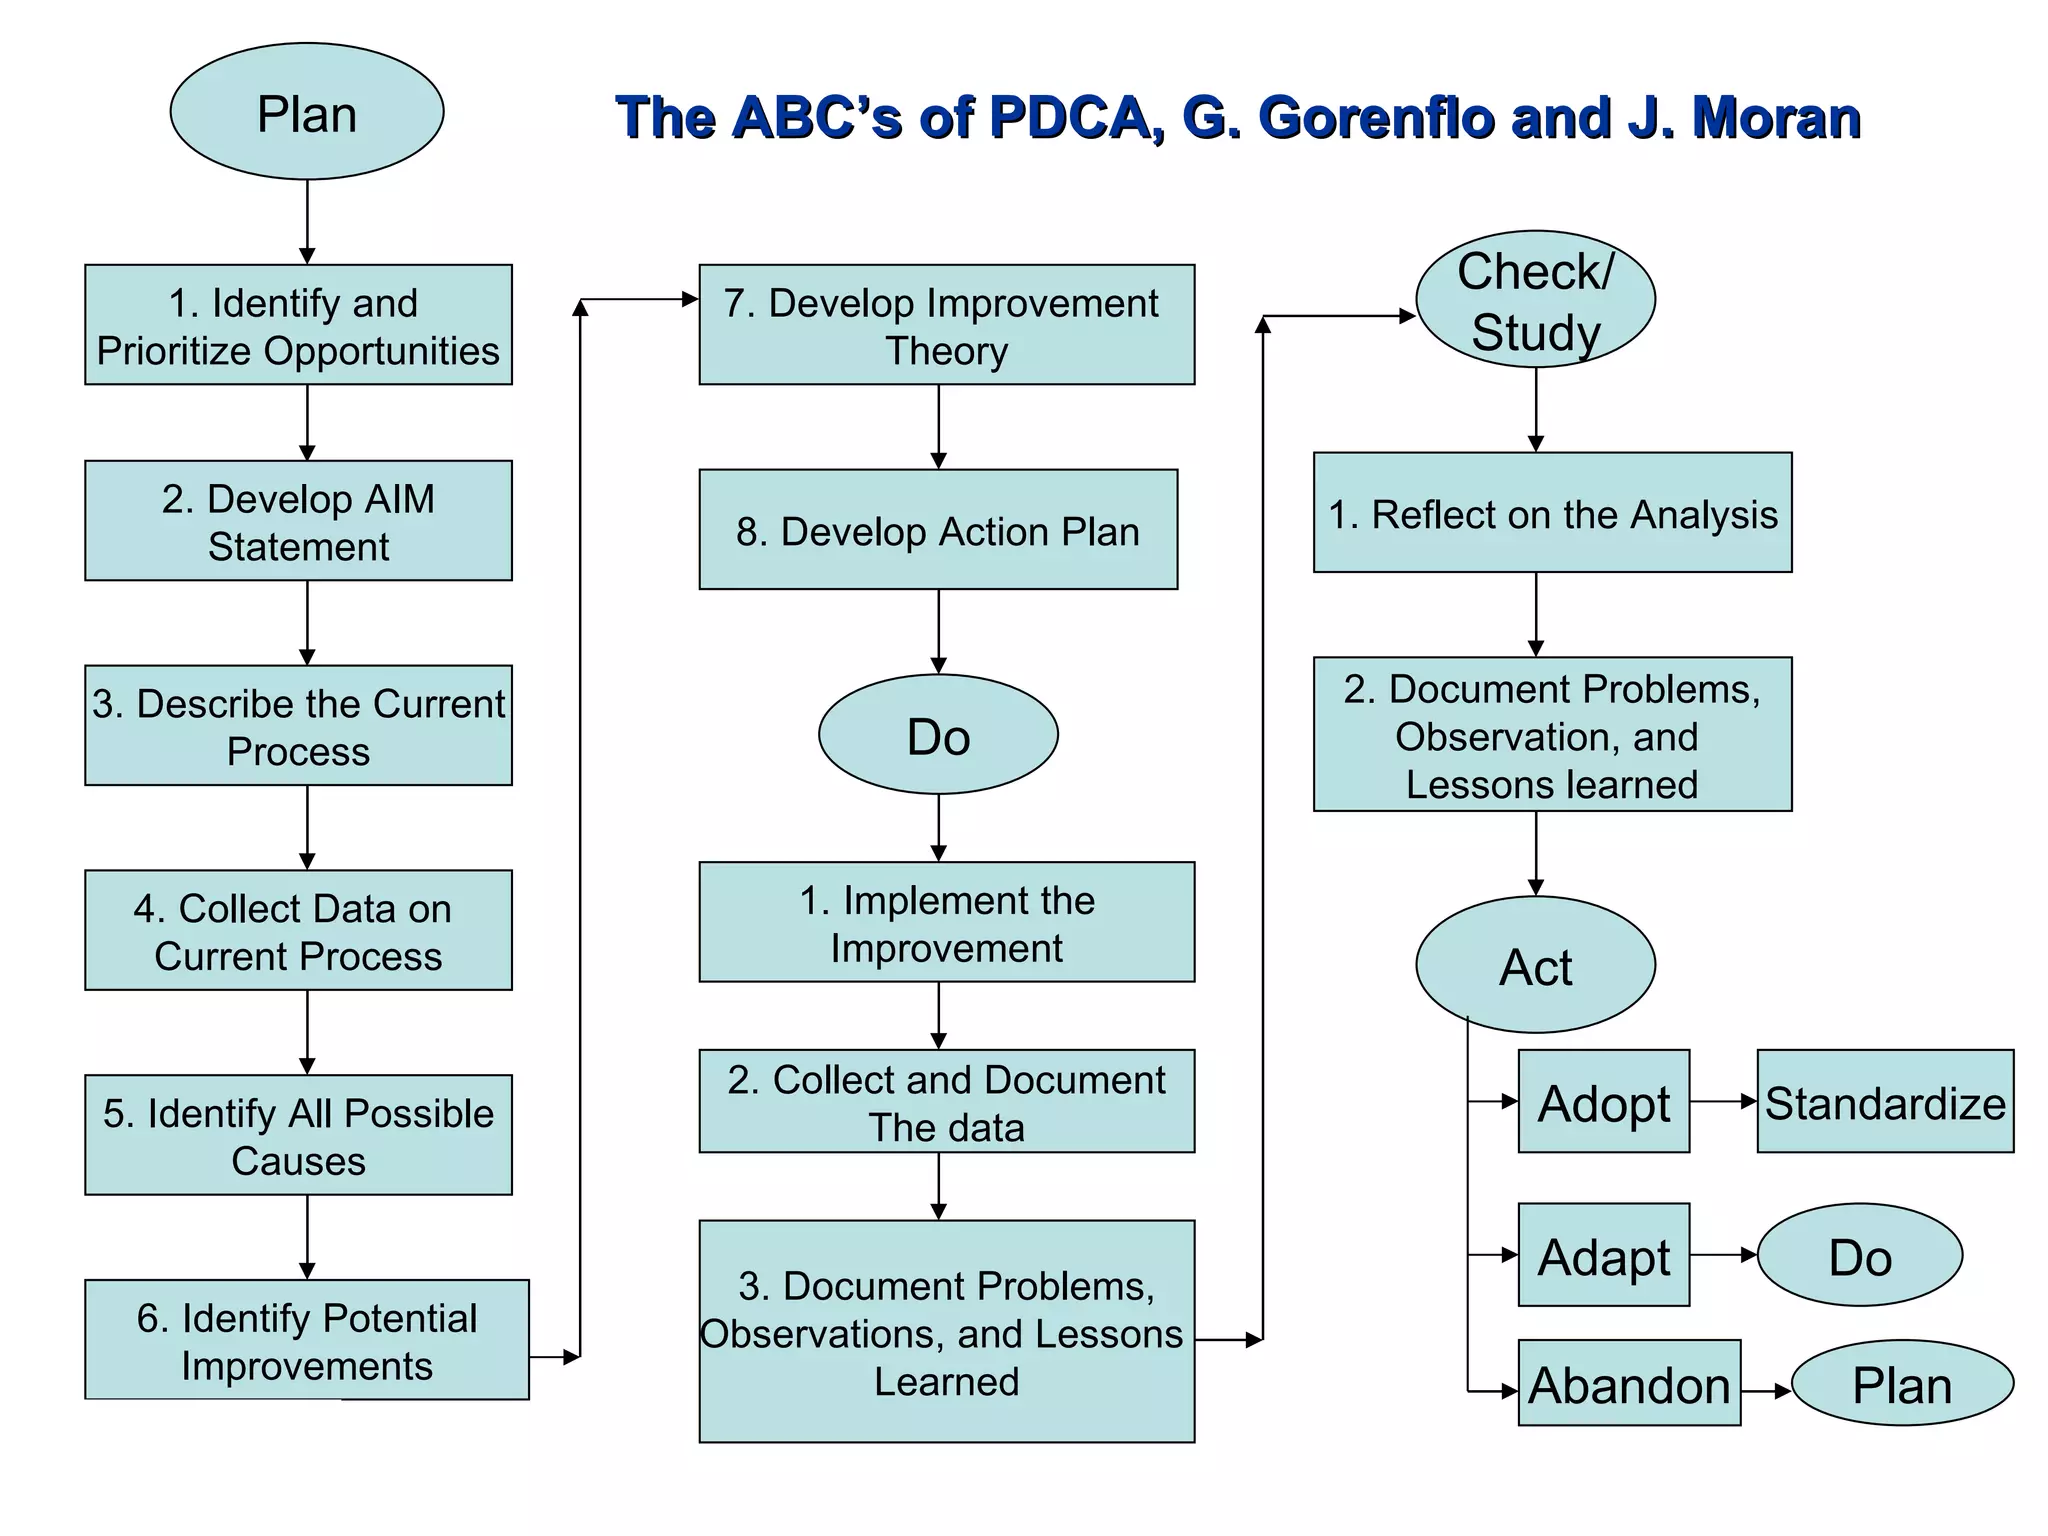
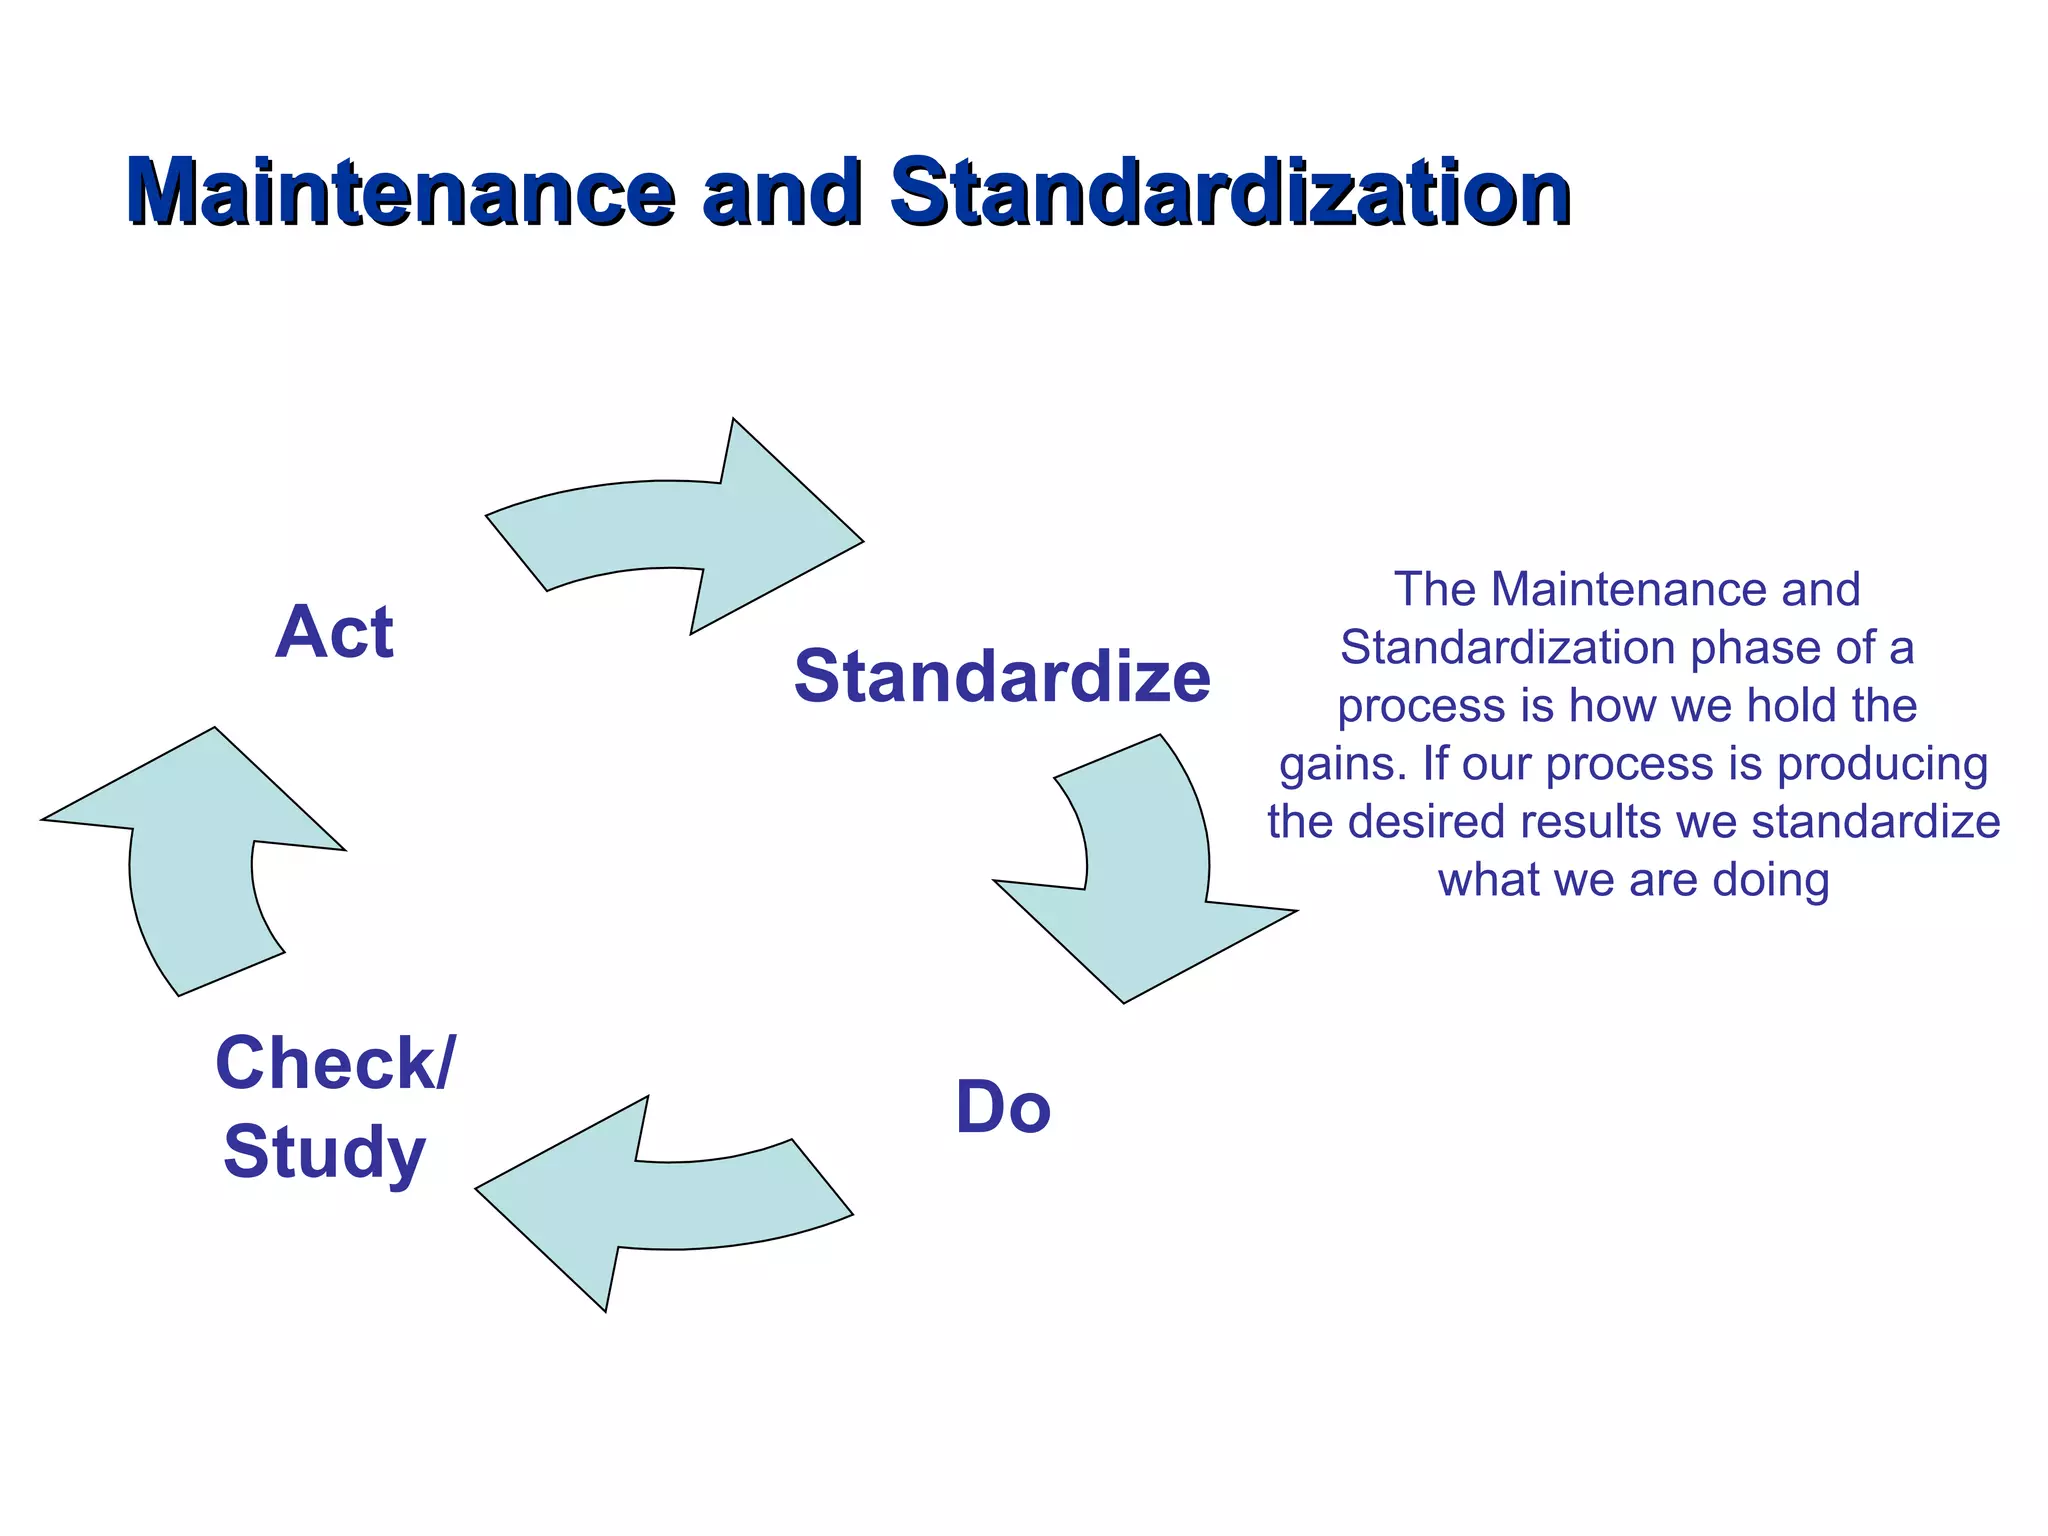
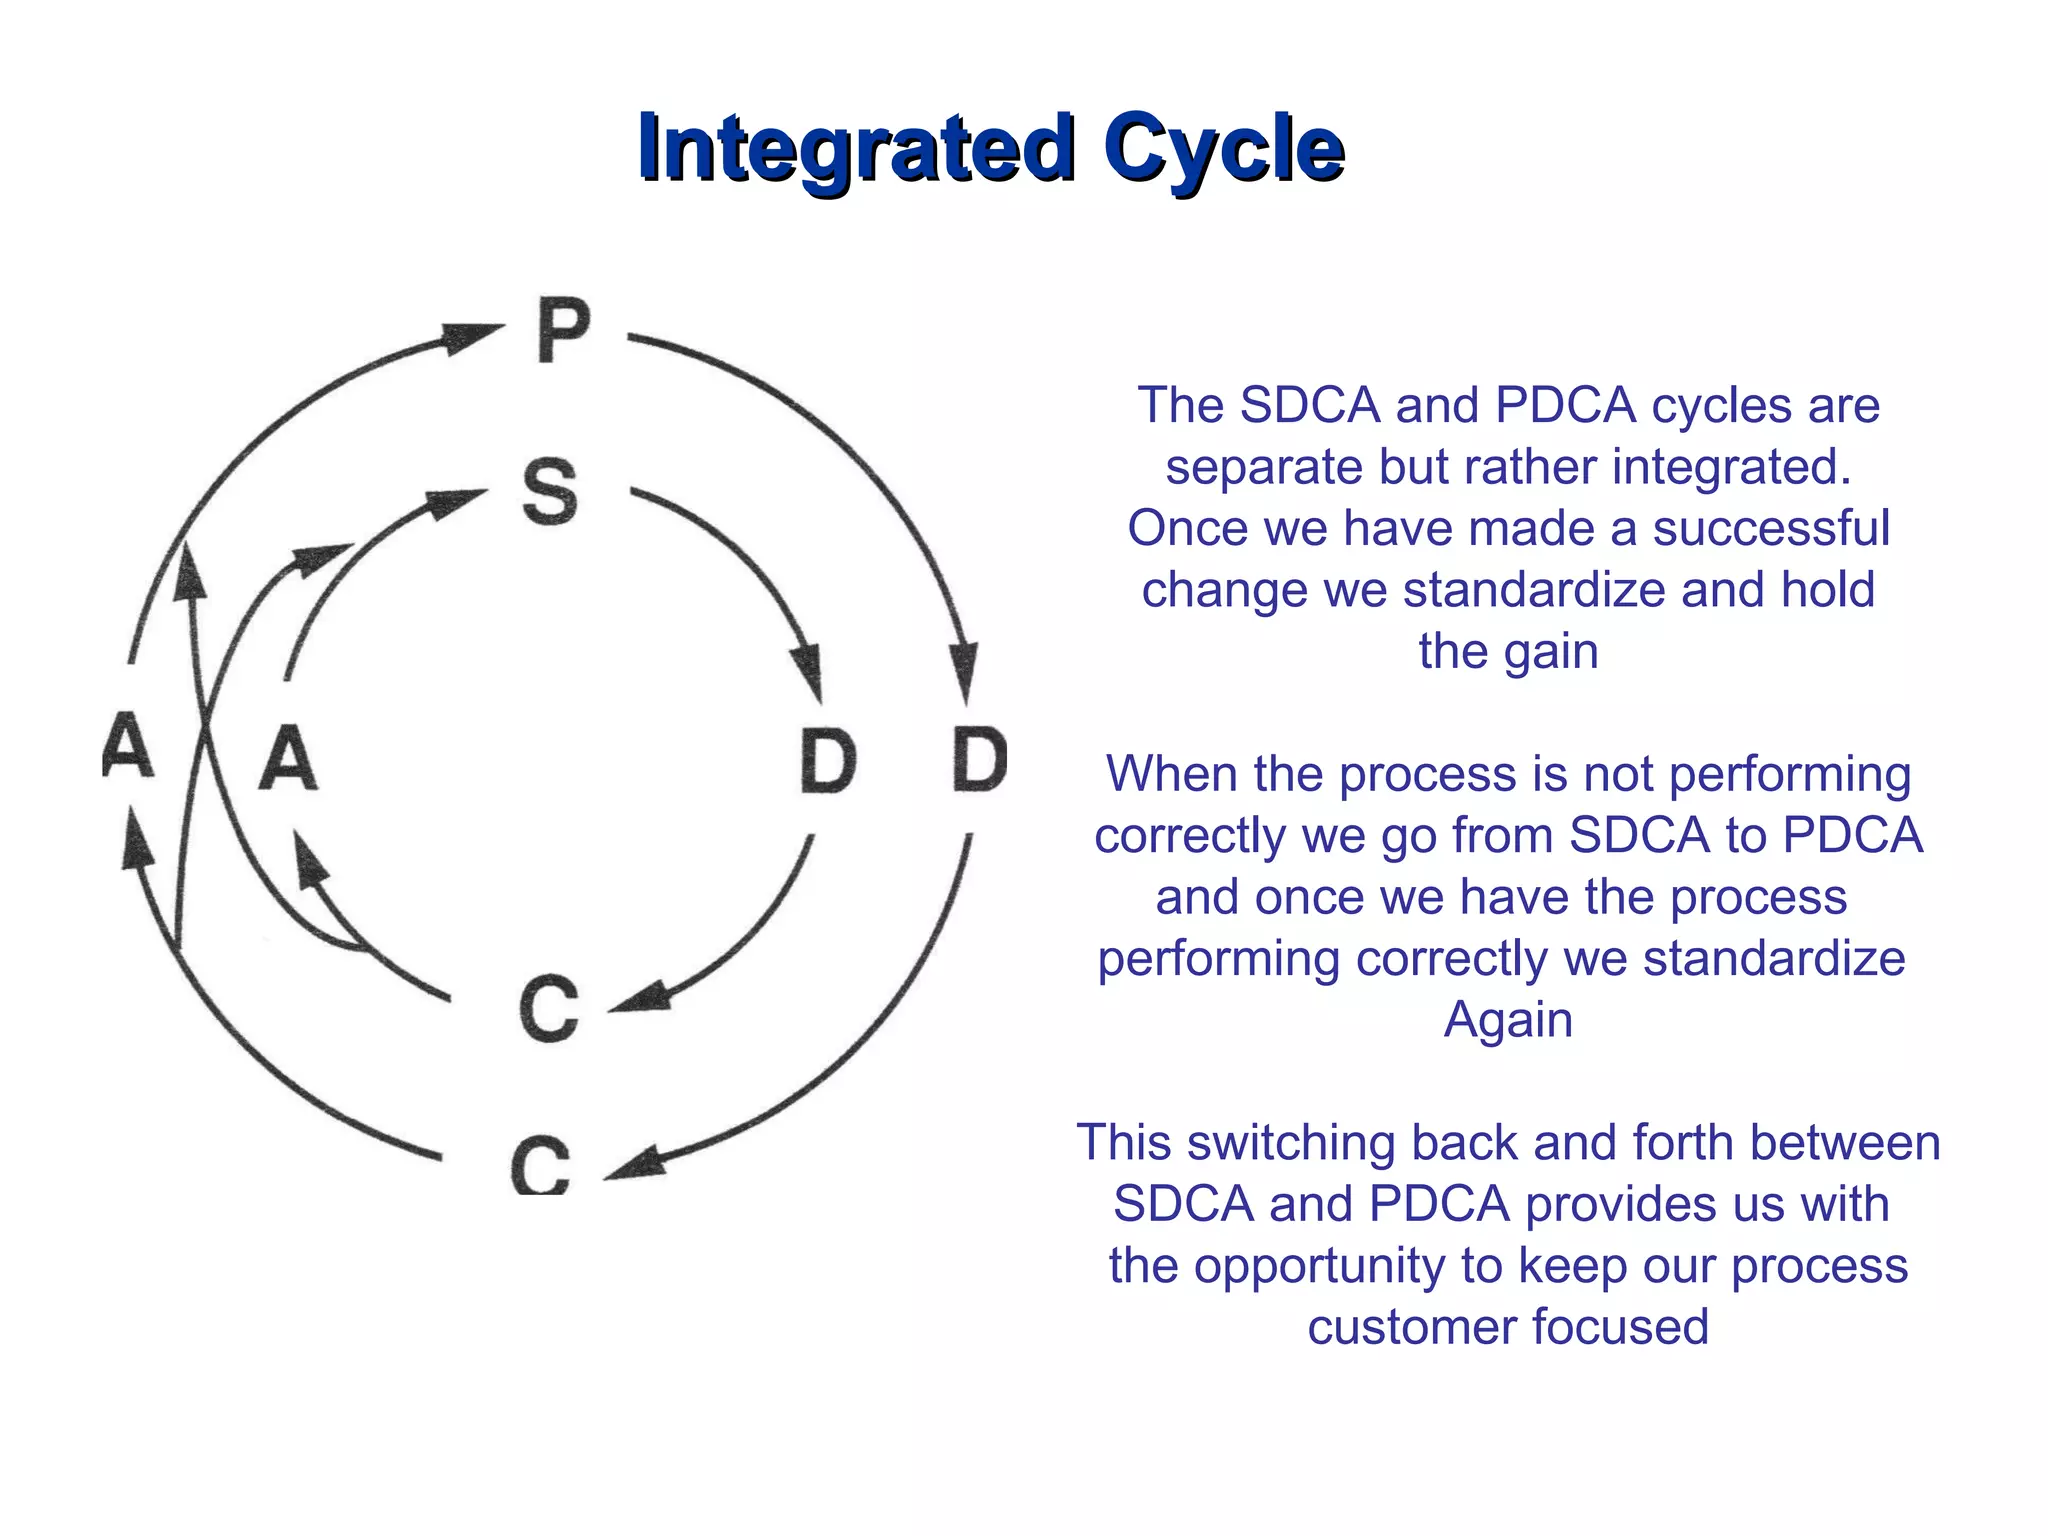
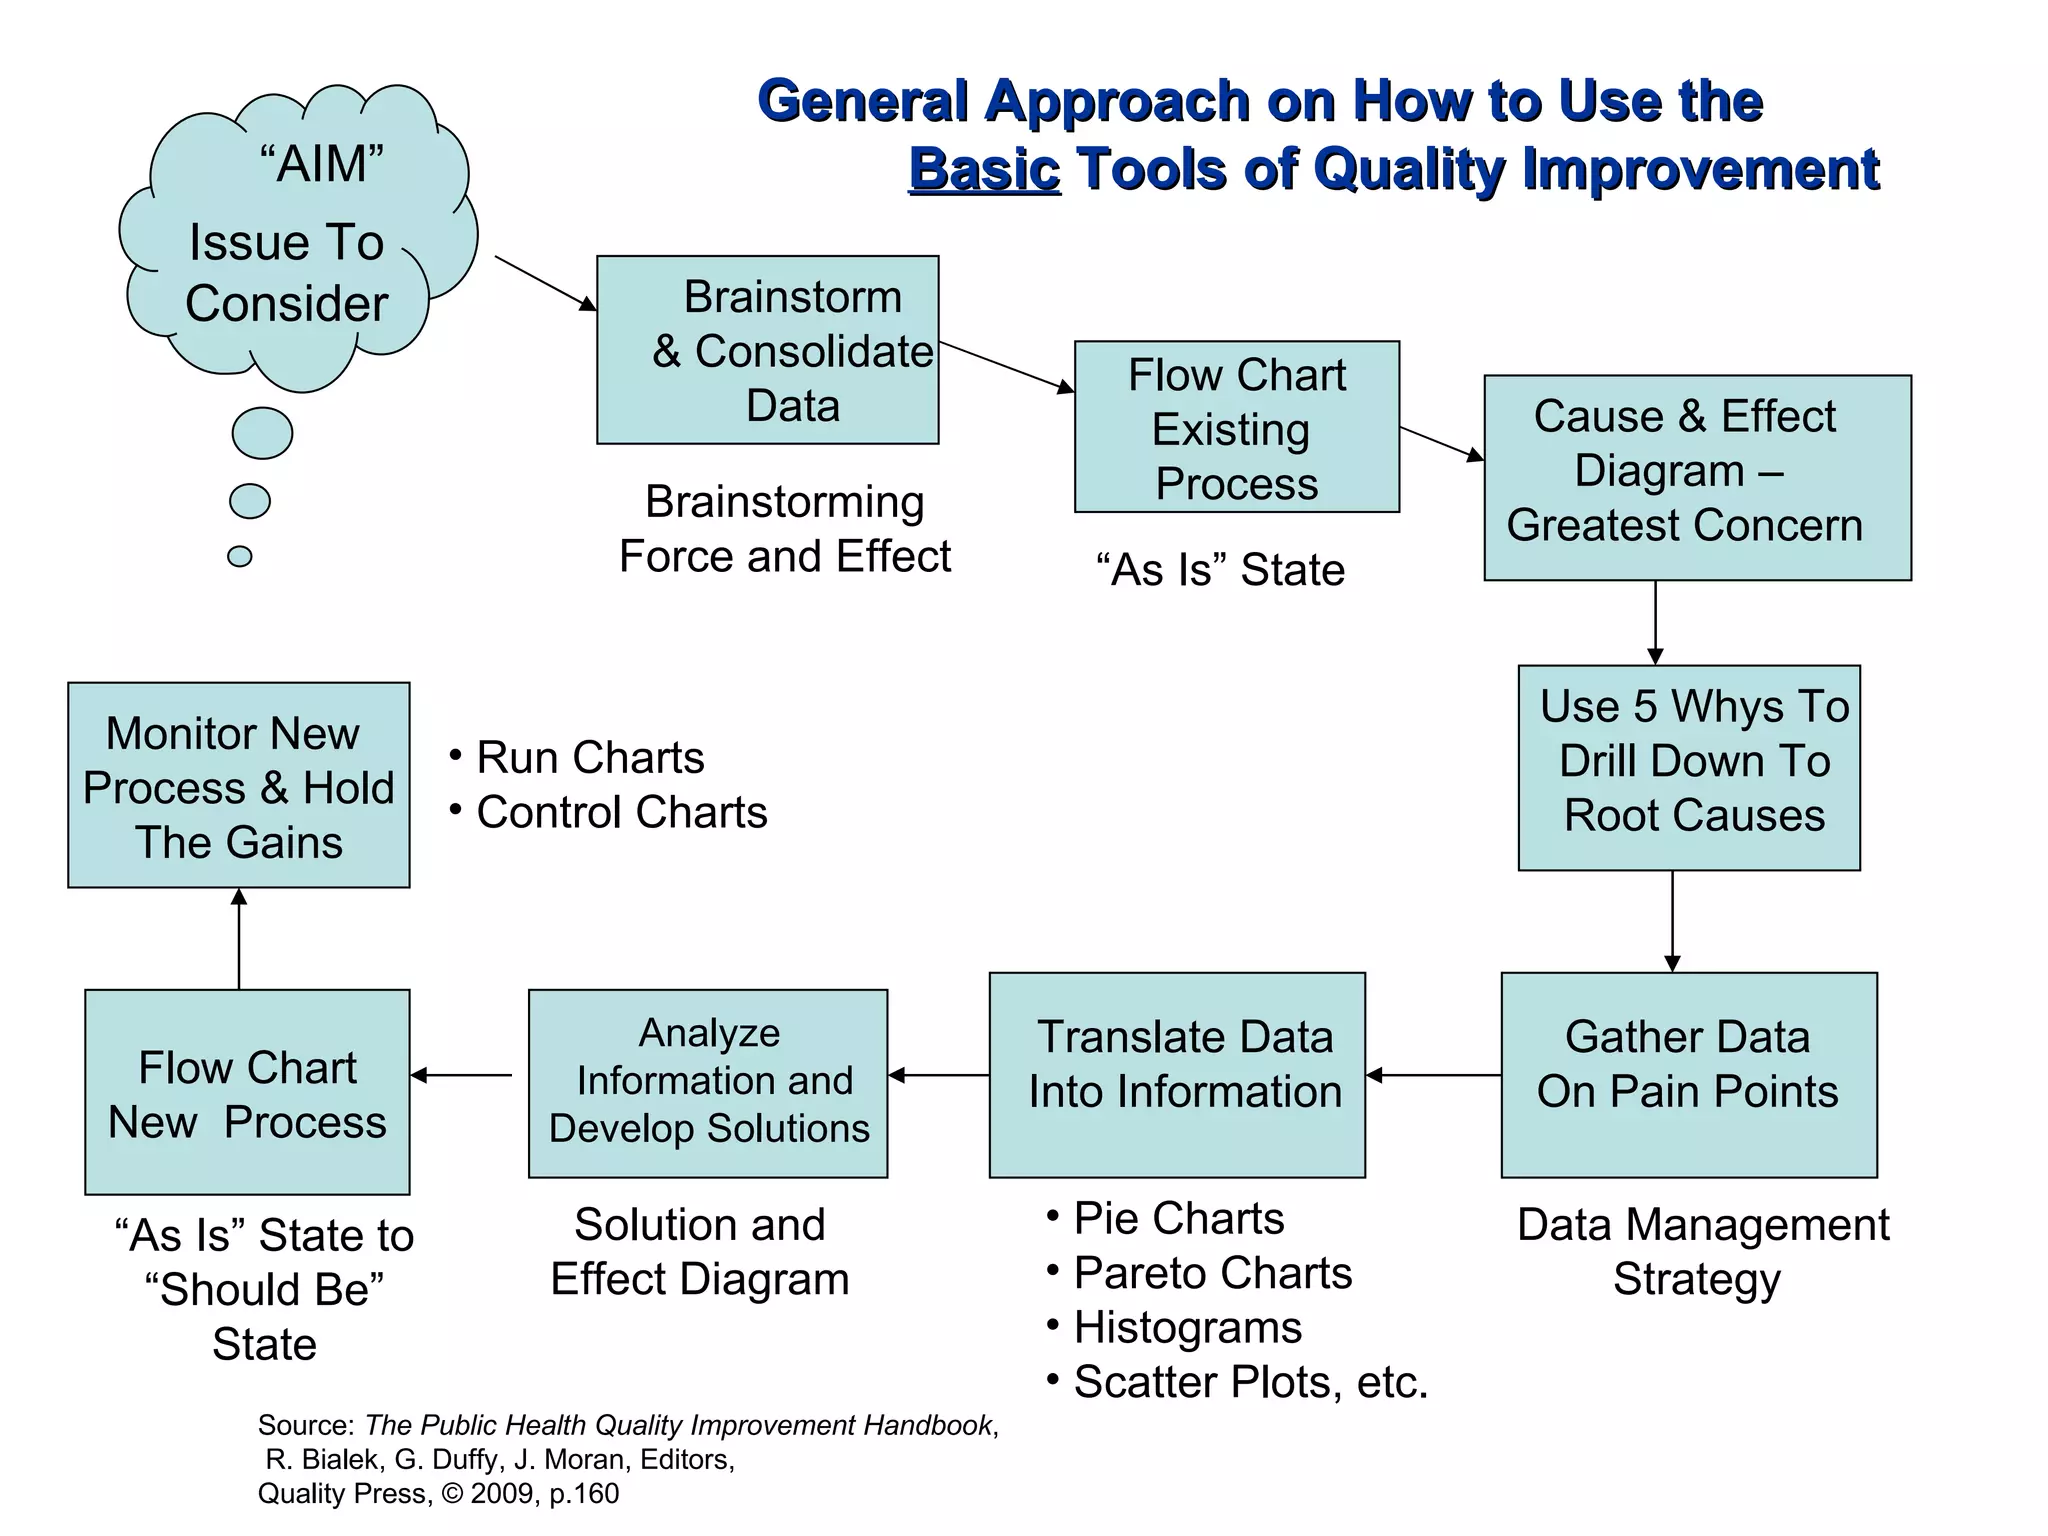
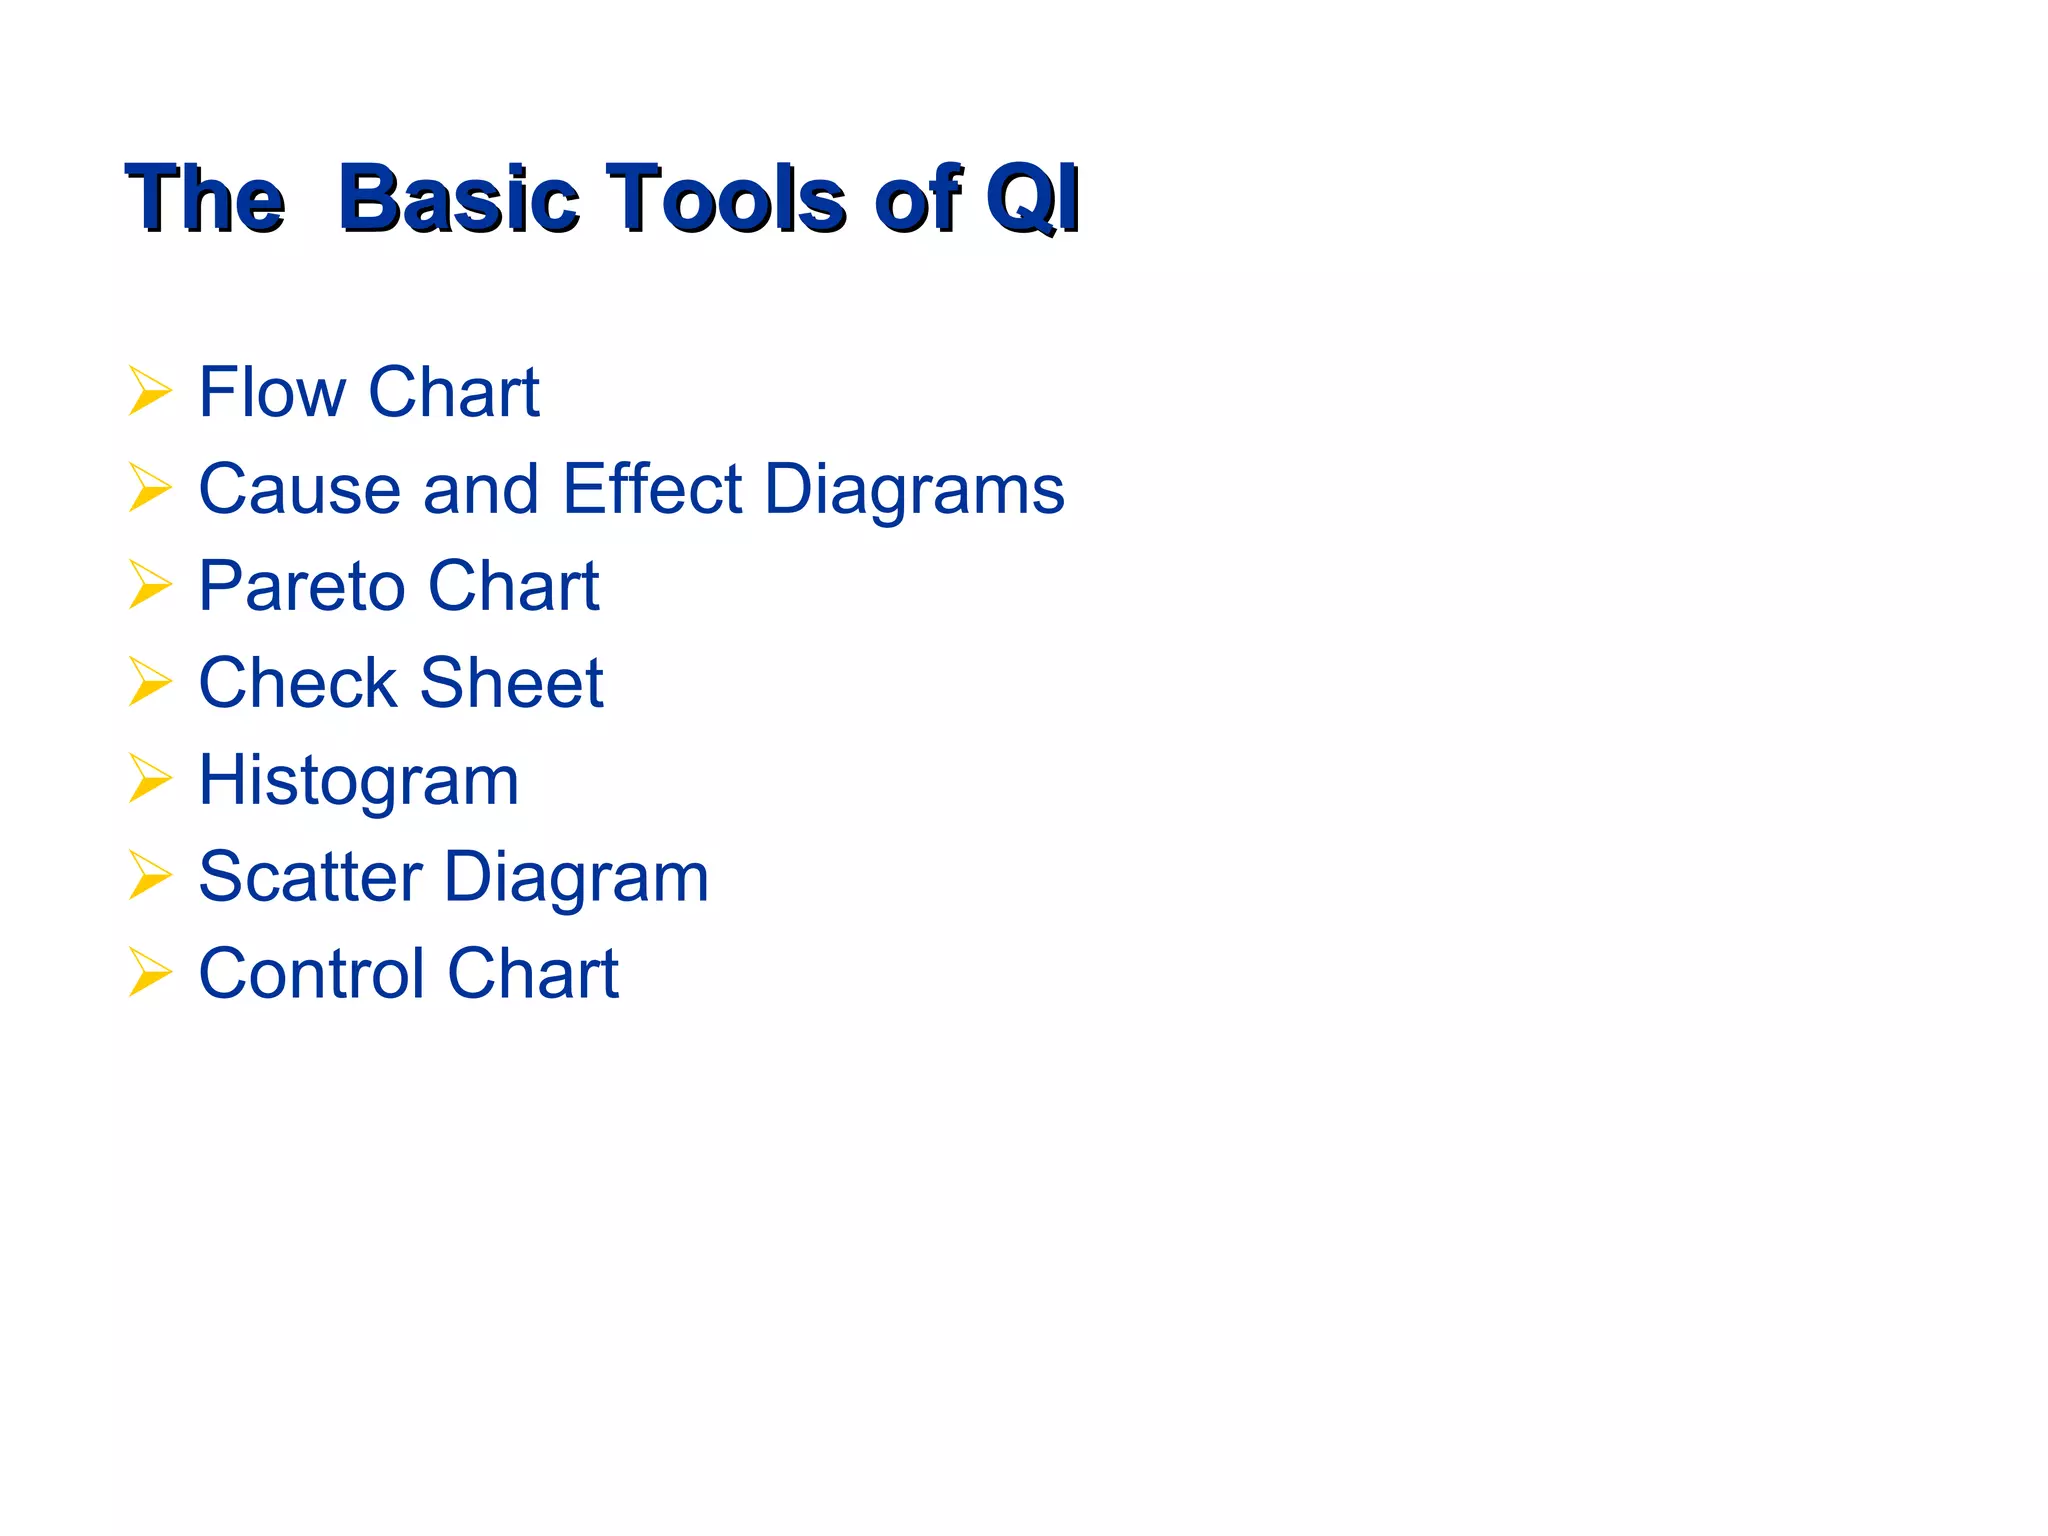
Applying Quality Improvement Techniques to Analyze Problems and Find Solutions Jack Moran and Julia Gray  Public Health Foundation
Steps in Performance Improvement Organize participation for performance improvement Prioritize areas for action Explore “root causes” of performance Develop and implement improvement plans Regularly monitor and report progress Source: NPHPSP Users’ Guide
Organize participation for performance improvement Leadership support and role What is leadership’s vision, commitment, expectation? Build the process strategically Incorporate QI into broader initiatives (MAPP, HP2010) Involve others Statewide coordinating/steering comm. (esp. with multiple instruments)
Prioritize areas for action Examine the results What stands out? Comports with  your realities? Open discussion of  findings Expectations vs.  results? Set priorities  Limit the universe  of priorities
Explore Root Causes Crucial Step Will spend more time on this later… Explore the WHY of performance problems Resist jumping to solutions Most performance issues can be traced to well-defined systems causes: Policies, leadership, funding, incentives, information, personnel, or coordination
Develop and implement improvement plans Remember why we did this in the 1 st  place The search for better outcomes may have many paths, and multiple stops
Regularly monitor and report progress Regular reports necessary to chart progress Benchmark against self and others Same industry, other industries Reports do not have to be computerized (although it helps!), expensive, color…
Plan  Plan changes aimed at improvement, matched to root causes Do  Carry out changes; try first on small scale Check  See if you get the desired results Act  Make changes based on what you learned; spread success To Carry Out a Quality Improvement Process, “Plan-Do-Check-Act” Plan Do Check Act
Definition of Quality Improvement  in Public Health “ Quality improvement in public health is the use of a deliberate and defined improvement process, such as Plan-Do-Check-Act, which is focused on activities that are responsive to community needs and improving population health.   It refers to a continuous and ongoing effort to achieve measurable improvements in the efficiency, effectiveness, performance, accountability, outcomes, and other indicators of quality in services or processes which achieve equity and improve the health of the community.” This definition was developed by the Accreditation Coalition Workgroup  (Les Beitsch, Ron Bialek, Abby Cofsky, Liza Corso, Jack Moran, William Riley, and Pamela Russo)
We are not a patient people! Always in a hurry to move on to the next thing.
P D C/S A P D C/S A P D C/S A Knowledge & Experience  Project Difficulty Hold the Gains Rapid  Cycle
Topic Big ‘QI’ – organization-wide Little ‘qi’ – program/unit Improvement Quality Improvement  Planning Evaluation of Quality Processes Quality Improvement  Goals Individual ‘qi’ Contrasting Big “QI”, Little “qi”, and Individual “qi   System focus Tied to the Strategic Plan Responsiveness to a  community need Cut across all programs and activities Strategic Plan Specific project focus Program/unit level Performance of a process over time Delivery of a service Individual program/unit  level plans Daily work level focus Tied to yearly individual performance Performance of daily  work Daily work Individual performance  plans
Sales Functional  Goals Marketing Operations Customer Service Functional  Goals Functional  Goals Functional  Goals Calls/sale Number of  Marketing Events Units Processed Call Time Little q Problems – functional (silos) goals result in process gaps, overlaps, rework, etc. Customer wants may not be in sync with what each department wants
Sales Functional  Goals Marketing Operations Customer Service Functional  Goals Functional  Goals Functional  Goals Calls/sale Number of  Marketing Events Units Processed Call Time Little q Customer wants may not be in sync with what each department wants Now the focus is on providing the customer with product knowledge,  right cars for their needs, easy access, multiple locations, insurances,  and safe vehicles Big Q Fleet Management Rental Process Product Availability
MACRO MESO MICRO INDIVIDUAL Turning Point/ Baldrige QFD LSS Daily Management P D C A P D C A P D C A S D C A Big ‘QI’ Little ‘qi’ Individual ‘qi’ QI Teams Rapid  Cycle  Advance Tools of QI Basic Tools of QI Continuous Quality Improvement System in Public Health MAPP
General Approach on How to Use the  Basic  Tools of Quality Improvement Issue To Consider Flow Chart Existing  Process Brainstorm & Consolidate Data Cause & Effect Diagram –  Greatest Concern Use 5 Whys To Drill Down To Root Causes Gather Data On Pain Points Translate Data Into Information Pie Charts Pareto Charts Histograms Scatter Plots, etc. Flow Chart New  Process Monitor New  Process & Hold The Gains Run Charts Control Charts Data Management Strategy  “ As Is” State to “Should Be” State “ As Is” State Brainstorming Force and Effect Analyze  Information and Develop Solutions   Solution and Effect Diagram Source:  The Public Health Quality Improvement Handbook , R. Bialek, G. Duffy, J. Moran, Editors, Quality Press, © 2009, p.160 “ AIM”
Large Issue, Cross Functional Problem, or Sensitive Situation Explore Brainstorming  Affinity Diagram Sort & Prioritize Interrelationship DiGraph Prioritization Matrix Understand & Baseline Radar Chart SWOT Analysis Develop Actions &  Tasks Tree Diagram Prioritize Actions &  Tasks Control & Influence Plots Prioritization Matrix Know & Don’t Know Matrix Develop Project Plans Monitor PERT Gantt Chart SMART Chart PDPC Problem Prevention General Approach on How to Use the  Advanced  Tools of Quality Improvement Source:  The Public Health Quality Improvement Handbook ,  R. Bialek, G. Duffy, J. Moran, Editors, Quality Press, © 2009, p.190
What Is Quality? Today the most progressive view of quality is that it is defined entirely by the customer or end user and is based upon that person's evaluation of his or her entire customer experience The customer experience is the aggregate of all the  T ouch Points  that customers have with the organization’s product and services, and is by definition a combination of these
Deming Cycle – PDCA or PDSA PDCA was made popular by Dr. Deming who is considered by many to be the father of modern quality control; however it was always referred to by him as the "Shewhart cycle"
Continuous Improvement The continuous improvement  phase of a process is how you make a change in direction. The change usually is because the process output is deteriorating or customer needs have changed Act Do Check/ Study Plan
Plan 1. Identify and  Prioritize Opportunities 2. Develop AIM Statement 3. Describe the Current Process 4. Collect Data on  Current Process 5. Identify All Possible Causes 6. Identify Potential Improvements 7. Develop Improvement  Theory 8. Develop Action Plan 1. Implement the Improvement Do 2. Collect and Document The data 3. Document Problems, Observations, and Lessons  Learned Check/ Study 1. Reflect on the Analysis Act 2. Document Problems, Observation, and  Lessons learned Adopt Adapt Abandon Standardize Do Plan The ABC’s of PDCA, G. Gorenflo and J. Moran
Maintenance and Standardization The Maintenance and  Standardization phase of a  process is how we hold the  gains. If our process is producing the desired results we standardize what we are doing Standardize Check/ Study  Act Do
Integrated Cycle The SDCA and PDCA cycles are separate but rather integrated. Once we have made a successful change we standardize and hold the gain When the process is not performing correctly we go from SDCA to PDCA and once we have the process  performing correctly we standardize  Again This switching back and forth between SDCA and PDCA provides us with  the opportunity to keep our process customer focused
General Approach on How to Use the  Basic  Tools of Quality Improvement Issue To Consider Flow Chart Existing  Process Brainstorm & Consolidate Data Cause & Effect Diagram –  Greatest Concern Use 5 Whys To Drill Down To Root Causes Gather Data On Pain Points Translate Data Into Information Pie Charts Pareto Charts Histograms Scatter Plots, etc. Flow Chart New  Process Monitor New  Process & Hold The Gains Run Charts Control Charts Data Management Strategy  “ As Is” State to “Should Be” State “ As Is” State Brainstorming Force and Effect Analyze  Information and Develop Solutions  Solution and Effect Diagram Source:  The Public Health Quality Improvement Handbook , R. Bialek, G. Duffy, J. Moran, Editors, Quality Press, © 2009, p.160 “ AIM”
The  Basic Tools of QI Flow Chart Cause and Effect Diagrams Pareto Chart Check Sheet Histogram Scatter Diagram Control Chart
Flow Charting
“ If you can't describe what you are doing as a process, you don't know what you're doing” W. Edwards Deming
Flow Charting Flow charting is the first step we take in understanding a process  Organized combination of shapes, lines, and text Flow charts provide a visual illustration, a picture of the steps the process undergoes to complete it's assigned task   From this graphic picture we can see a process and the elements comprising it Shows how interactions occur Makes the invisible visible
Flow Chart Benefits Creates a common vision Establishes the  “AS IS”  baseline – Current State Baseline to measure improvements Identifies wasteful steps – activities/waits Uncovers variations Shows where improvements could be made and potential impacts  Training tool
Flow Chart People Benefits People involved in constructing a flow chart begin to:  Better understand the process Understand the process in the same terms Realize how the process and all the people involved, including them, fit into the overall process or business Identify areas for improving the process Become enthusiastic supporters to quality and process improvement
Flow Charting Construction Clearly define the process boundaries to be studied Define the first and last steps – start and end points Get the right people in the room Decide on the level of detail Complete the big picture first – macro view Fill in the details – micro view Gather information of how the process flows: Experience Observation Conversation Interviews Research Clearly define each step in the process Be accurate and honest
Flow Charting Steps Use the simplest symbols possible – Post-Its  Make sure every loop has an escape  There is usually only one output arrow out of a process box. Otherwise, it may require a decision diamond Trial process flow – walk through people involved in the process to get their comments  Make changes if necessary Identify time lags and non-value-adding steps
Flow Chart Symbols Activity: Operation/Inspection Decision Start/End Bookends Document Wait/Delay Storage Data Base Transport Input Output Flow Lines A Connector Forms Comment Collector Input/ Output Data Manual Operation Preparation Manual Input Display Unfamiliar/ Research
Constructing a Flow Chart Asking questions is the key to flow charting a process  For this process: Who is the customer(s)? Who is the supplier(s) ? What is the first thing that happens?  What is the next thing that happens? Where does the input(s) to the process come from?  How does the input(s) get to the process?  Where does the output(s) of this operation go?  Is their anything else that must be done at this point?
Adding Time Lines As Is Flow Chart Could Be Flow Chart Should Be Flow Chart Time Time
Analyzing A Flow Chart Examine each: Activity symbol – value/cost?  Decision point – necessary/redundant? Choke Points – bottlenecks? Rework loop – time/cost? Handoff – is it seamless? Document or data point – useful? Wait or delay symbol – why?/reduce/eliminate Transport Symbol – time/cost/location? Data Input Symbol – right format/timely? Document/Form Symbol – needed/cost/value?
Flow Chart Summary Matrix http://www.phf.org/resourcestools/Pages/Flow_Chart_Summary_Matrix.aspx ∑ Flow Chart Step Number Type of Step   Type of Step: P – process, D – decision, T – transport, W – wait, S – storage Delta = Proposed – Actual – the more negative the subtraction the better – more savings Touch Point ( √) Cost FTEs/Person Hrs Supplies Required Equipment Required Space Required Time Cost of Quality Partnerships Needed Etc Value added Actual Delta +/- ∑ Proposed P  D  P  T  W  P  D  S 1  2  3  4  5  6  7  8
Flow Charting Exercise
Cause and Effect Diagrams
Cause and Effect Diagrams Moving from Treating  Symptoms To Treating  Causes
Problem Solving – What we usually see is the tip of iceberg – “The Symptom”   The Symptom The Root Causes Invisible Hidden
Problem Solving When confronted with a problem most people like to tackle the obvious symptom and fix it This often results in more problems    Using a systematic approach to analysis the problem and find the root cause  is more efficient and effective Symptom – sign or indication Cause – whatever makes something happen
Cause and Effect Diagrams Organizes group knowledge about causes of a problem and display the information graphically Resemble a fish skeleton and sometimes called a Fishbone Diagram
Cause and Effect Diagrams - Construction Write the issue as a problem statement on the right hand side of the page and draw a box around it with an arrow running to it  This issue is now the effect Effect
Cause and Effect Diagrams - Construction Generate ideas as to what are the main causes of the effect Label these as the main branch headers Effect Header Header Header Header
Cause and Effect Diagrams - Construction Typical Main Headers are: 4 M’s – Manpower, Materials, Methods, Machinery People Policies Materials Equipment Life style Environment Etc.
Cause and Effect Diagrams - Construction For each main cause category brainstorm ideas as to what are the related sub-causes that might effect our issue    Use the 5 Why’s technique when a cause is identified  Keep repeating  the question until no other causes can be identified List the sub-cause using arrows Effect Header Header Header Header why why why why
Selecting Items to Investigate When the Cause and Effect Diagram is finished it is time to decide what few areas should be focused on to develop solutions to solve the effect Some are obvious – low hanging fruit  Some require some research using the other QI tools such as: Pareto Diagrams Run Charts Surveys Histograms Etc.
Obese Children Life Style Policies Environment TV Viewing No Time For Food Prep No Outdoor Play Unsafe Juices Bottle Pacifier Less Fruits and Veg. Less  Income Maternal Choices Less Vigorous Exercise Curriculum No Sidewalks Unhealthy Food Choices Few Community Recreational Areas or Programs Built Environment For  Strollers Not Toddling Less Indoor Mobility TV  Pacifier Unsafe Housing Sodas/Snacks Decreased Breast Feeding Early Feeding  Practices Genetics Syndromes Genes Pre Natal Practices Excess Maternal  Weight Gain Over Weight  Newborn Over Weight Pre School At School At Home
Problem (Effect) 5 Why’s Technique Why? Why? Why? Why? Why?
 
Root Cause Analysis Rating Form Potential Root Cause Improved Quality Reduced Costs Improved Customer Satisfaction Others Total  Score Ranking Impact Scoring Scale: Low = 1, Medium = 3, High = 5 Impact on the Problem
Cause and Effect Exercise
Why Employees Are Late For  Work? Cause and Effect Diagram
Stages Of Team Development Adjourning Bruce Tuckman, 1965  1970
Three Step Process for Healthy Teams Teaming Process Coaching and Facilitation Process Planning and Problem Solving Process
Top Ten Reasons Teams Fail 1. AIM Statement  2. Team Charter  3. Team Members  4. Problem Solving Process  5. Rapid Cycle  6. Team Maturity 7. Base Line Data 8. Training 9. Root Cause Analysis (RCA)  10. Pilot Testing
For More Information NPHPSP User Guide (CDC) http://www.cdc.gov/NPHPSP/PDF/UserGuide.pdf Michigan QI Handbook http://www.accreditation.localhealth.net/MLC-2%20website/Michigans_QI_Guidebook.pdf Public Health Memory Jogger http://www.phf.org/resourcestools/Pages/Public_Health_Memory_Jogger_II.aspx The Public Health Quality Improvement Handbook http://www.phf.org/resourcestools/Pages/PublicHealthQIHandbook.asp Applications and Tools for Creating and Sustaining Healthy Teams   http://www.phf.org/resourcestools/Pages/Applications_and_Tools_for_Creating_and_Sustaining_Healthy_Teams.aspx
Thank you for your time and attention Questions?

2011 NPHPSP Annual Training Applying QI Techniques

  • 1.
    Applying Quality ImprovementTechniques to Analyze Problems and Find Solutions Jack Moran and Julia Gray Public Health Foundation
  • 2.
    Steps in PerformanceImprovement Organize participation for performance improvement Prioritize areas for action Explore “root causes” of performance Develop and implement improvement plans Regularly monitor and report progress Source: NPHPSP Users’ Guide
  • 3.
    Organize participation forperformance improvement Leadership support and role What is leadership’s vision, commitment, expectation? Build the process strategically Incorporate QI into broader initiatives (MAPP, HP2010) Involve others Statewide coordinating/steering comm. (esp. with multiple instruments)
  • 4.
    Prioritize areas foraction Examine the results What stands out? Comports with your realities? Open discussion of findings Expectations vs. results? Set priorities Limit the universe of priorities
  • 5.
    Explore Root CausesCrucial Step Will spend more time on this later… Explore the WHY of performance problems Resist jumping to solutions Most performance issues can be traced to well-defined systems causes: Policies, leadership, funding, incentives, information, personnel, or coordination
  • 6.
    Develop and implementimprovement plans Remember why we did this in the 1 st place The search for better outcomes may have many paths, and multiple stops
  • 7.
    Regularly monitor andreport progress Regular reports necessary to chart progress Benchmark against self and others Same industry, other industries Reports do not have to be computerized (although it helps!), expensive, color…
  • 8.
    Plan Planchanges aimed at improvement, matched to root causes Do Carry out changes; try first on small scale Check See if you get the desired results Act Make changes based on what you learned; spread success To Carry Out a Quality Improvement Process, “Plan-Do-Check-Act” Plan Do Check Act
  • 9.
    Definition of QualityImprovement in Public Health “ Quality improvement in public health is the use of a deliberate and defined improvement process, such as Plan-Do-Check-Act, which is focused on activities that are responsive to community needs and improving population health.  It refers to a continuous and ongoing effort to achieve measurable improvements in the efficiency, effectiveness, performance, accountability, outcomes, and other indicators of quality in services or processes which achieve equity and improve the health of the community.” This definition was developed by the Accreditation Coalition Workgroup (Les Beitsch, Ron Bialek, Abby Cofsky, Liza Corso, Jack Moran, William Riley, and Pamela Russo)
  • 10.
    We are nota patient people! Always in a hurry to move on to the next thing.
  • 11.
    P D C/SA P D C/S A P D C/S A Knowledge & Experience Project Difficulty Hold the Gains Rapid Cycle
  • 12.
    Topic Big ‘QI’– organization-wide Little ‘qi’ – program/unit Improvement Quality Improvement Planning Evaluation of Quality Processes Quality Improvement Goals Individual ‘qi’ Contrasting Big “QI”, Little “qi”, and Individual “qi System focus Tied to the Strategic Plan Responsiveness to a community need Cut across all programs and activities Strategic Plan Specific project focus Program/unit level Performance of a process over time Delivery of a service Individual program/unit level plans Daily work level focus Tied to yearly individual performance Performance of daily work Daily work Individual performance plans
  • 13.
    Sales Functional Goals Marketing Operations Customer Service Functional Goals Functional Goals Functional Goals Calls/sale Number of Marketing Events Units Processed Call Time Little q Problems – functional (silos) goals result in process gaps, overlaps, rework, etc. Customer wants may not be in sync with what each department wants
  • 14.
    Sales Functional Goals Marketing Operations Customer Service Functional Goals Functional Goals Functional Goals Calls/sale Number of Marketing Events Units Processed Call Time Little q Customer wants may not be in sync with what each department wants Now the focus is on providing the customer with product knowledge, right cars for their needs, easy access, multiple locations, insurances, and safe vehicles Big Q Fleet Management Rental Process Product Availability
  • 15.
    MACRO MESO MICROINDIVIDUAL Turning Point/ Baldrige QFD LSS Daily Management P D C A P D C A P D C A S D C A Big ‘QI’ Little ‘qi’ Individual ‘qi’ QI Teams Rapid Cycle Advance Tools of QI Basic Tools of QI Continuous Quality Improvement System in Public Health MAPP
  • 16.
    General Approach onHow to Use the Basic Tools of Quality Improvement Issue To Consider Flow Chart Existing Process Brainstorm & Consolidate Data Cause & Effect Diagram – Greatest Concern Use 5 Whys To Drill Down To Root Causes Gather Data On Pain Points Translate Data Into Information Pie Charts Pareto Charts Histograms Scatter Plots, etc. Flow Chart New Process Monitor New Process & Hold The Gains Run Charts Control Charts Data Management Strategy “ As Is” State to “Should Be” State “ As Is” State Brainstorming Force and Effect Analyze Information and Develop Solutions Solution and Effect Diagram Source: The Public Health Quality Improvement Handbook , R. Bialek, G. Duffy, J. Moran, Editors, Quality Press, © 2009, p.160 “ AIM”
  • 17.
    Large Issue, CrossFunctional Problem, or Sensitive Situation Explore Brainstorming Affinity Diagram Sort & Prioritize Interrelationship DiGraph Prioritization Matrix Understand & Baseline Radar Chart SWOT Analysis Develop Actions & Tasks Tree Diagram Prioritize Actions & Tasks Control & Influence Plots Prioritization Matrix Know & Don’t Know Matrix Develop Project Plans Monitor PERT Gantt Chart SMART Chart PDPC Problem Prevention General Approach on How to Use the Advanced Tools of Quality Improvement Source: The Public Health Quality Improvement Handbook , R. Bialek, G. Duffy, J. Moran, Editors, Quality Press, © 2009, p.190
  • 18.
    What Is Quality?Today the most progressive view of quality is that it is defined entirely by the customer or end user and is based upon that person's evaluation of his or her entire customer experience The customer experience is the aggregate of all the T ouch Points that customers have with the organization’s product and services, and is by definition a combination of these
  • 19.
    Deming Cycle –PDCA or PDSA PDCA was made popular by Dr. Deming who is considered by many to be the father of modern quality control; however it was always referred to by him as the "Shewhart cycle"
  • 20.
    Continuous Improvement Thecontinuous improvement phase of a process is how you make a change in direction. The change usually is because the process output is deteriorating or customer needs have changed Act Do Check/ Study Plan
  • 21.
    Plan 1. Identifyand Prioritize Opportunities 2. Develop AIM Statement 3. Describe the Current Process 4. Collect Data on Current Process 5. Identify All Possible Causes 6. Identify Potential Improvements 7. Develop Improvement Theory 8. Develop Action Plan 1. Implement the Improvement Do 2. Collect and Document The data 3. Document Problems, Observations, and Lessons Learned Check/ Study 1. Reflect on the Analysis Act 2. Document Problems, Observation, and Lessons learned Adopt Adapt Abandon Standardize Do Plan The ABC’s of PDCA, G. Gorenflo and J. Moran
  • 22.
    Maintenance and StandardizationThe Maintenance and Standardization phase of a process is how we hold the gains. If our process is producing the desired results we standardize what we are doing Standardize Check/ Study Act Do
  • 23.
    Integrated Cycle TheSDCA and PDCA cycles are separate but rather integrated. Once we have made a successful change we standardize and hold the gain When the process is not performing correctly we go from SDCA to PDCA and once we have the process performing correctly we standardize Again This switching back and forth between SDCA and PDCA provides us with the opportunity to keep our process customer focused
  • 24.
    General Approach onHow to Use the Basic Tools of Quality Improvement Issue To Consider Flow Chart Existing Process Brainstorm & Consolidate Data Cause & Effect Diagram – Greatest Concern Use 5 Whys To Drill Down To Root Causes Gather Data On Pain Points Translate Data Into Information Pie Charts Pareto Charts Histograms Scatter Plots, etc. Flow Chart New Process Monitor New Process & Hold The Gains Run Charts Control Charts Data Management Strategy “ As Is” State to “Should Be” State “ As Is” State Brainstorming Force and Effect Analyze Information and Develop Solutions Solution and Effect Diagram Source: The Public Health Quality Improvement Handbook , R. Bialek, G. Duffy, J. Moran, Editors, Quality Press, © 2009, p.160 “ AIM”
  • 25.
    The BasicTools of QI Flow Chart Cause and Effect Diagrams Pareto Chart Check Sheet Histogram Scatter Diagram Control Chart
  • 26.
  • 27.
    “ If youcan't describe what you are doing as a process, you don't know what you're doing” W. Edwards Deming
  • 28.
    Flow Charting Flowcharting is the first step we take in understanding a process Organized combination of shapes, lines, and text Flow charts provide a visual illustration, a picture of the steps the process undergoes to complete it's assigned task  From this graphic picture we can see a process and the elements comprising it Shows how interactions occur Makes the invisible visible
  • 29.
    Flow Chart BenefitsCreates a common vision Establishes the “AS IS” baseline – Current State Baseline to measure improvements Identifies wasteful steps – activities/waits Uncovers variations Shows where improvements could be made and potential impacts Training tool
  • 30.
    Flow Chart PeopleBenefits People involved in constructing a flow chart begin to: Better understand the process Understand the process in the same terms Realize how the process and all the people involved, including them, fit into the overall process or business Identify areas for improving the process Become enthusiastic supporters to quality and process improvement
  • 31.
    Flow Charting ConstructionClearly define the process boundaries to be studied Define the first and last steps – start and end points Get the right people in the room Decide on the level of detail Complete the big picture first – macro view Fill in the details – micro view Gather information of how the process flows: Experience Observation Conversation Interviews Research Clearly define each step in the process Be accurate and honest
  • 32.
    Flow Charting StepsUse the simplest symbols possible – Post-Its Make sure every loop has an escape There is usually only one output arrow out of a process box. Otherwise, it may require a decision diamond Trial process flow – walk through people involved in the process to get their comments Make changes if necessary Identify time lags and non-value-adding steps
  • 33.
    Flow Chart SymbolsActivity: Operation/Inspection Decision Start/End Bookends Document Wait/Delay Storage Data Base Transport Input Output Flow Lines A Connector Forms Comment Collector Input/ Output Data Manual Operation Preparation Manual Input Display Unfamiliar/ Research
  • 34.
    Constructing a FlowChart Asking questions is the key to flow charting a process For this process: Who is the customer(s)? Who is the supplier(s) ? What is the first thing that happens? What is the next thing that happens? Where does the input(s) to the process come from? How does the input(s) get to the process? Where does the output(s) of this operation go? Is their anything else that must be done at this point?
  • 35.
    Adding Time LinesAs Is Flow Chart Could Be Flow Chart Should Be Flow Chart Time Time
  • 36.
    Analyzing A FlowChart Examine each: Activity symbol – value/cost? Decision point – necessary/redundant? Choke Points – bottlenecks? Rework loop – time/cost? Handoff – is it seamless? Document or data point – useful? Wait or delay symbol – why?/reduce/eliminate Transport Symbol – time/cost/location? Data Input Symbol – right format/timely? Document/Form Symbol – needed/cost/value?
  • 37.
    Flow Chart SummaryMatrix http://www.phf.org/resourcestools/Pages/Flow_Chart_Summary_Matrix.aspx ∑ Flow Chart Step Number Type of Step Type of Step: P – process, D – decision, T – transport, W – wait, S – storage Delta = Proposed – Actual – the more negative the subtraction the better – more savings Touch Point ( √) Cost FTEs/Person Hrs Supplies Required Equipment Required Space Required Time Cost of Quality Partnerships Needed Etc Value added Actual Delta +/- ∑ Proposed P D P T W P D S 1 2 3 4 5 6 7 8
  • 38.
  • 39.
  • 40.
    Cause and EffectDiagrams Moving from Treating Symptoms To Treating Causes
  • 41.
    Problem Solving –What we usually see is the tip of iceberg – “The Symptom” The Symptom The Root Causes Invisible Hidden
  • 42.
    Problem Solving Whenconfronted with a problem most people like to tackle the obvious symptom and fix it This often results in more problems   Using a systematic approach to analysis the problem and find the root cause is more efficient and effective Symptom – sign or indication Cause – whatever makes something happen
  • 43.
    Cause and EffectDiagrams Organizes group knowledge about causes of a problem and display the information graphically Resemble a fish skeleton and sometimes called a Fishbone Diagram
  • 44.
    Cause and EffectDiagrams - Construction Write the issue as a problem statement on the right hand side of the page and draw a box around it with an arrow running to it This issue is now the effect Effect
  • 45.
    Cause and EffectDiagrams - Construction Generate ideas as to what are the main causes of the effect Label these as the main branch headers Effect Header Header Header Header
  • 46.
    Cause and EffectDiagrams - Construction Typical Main Headers are: 4 M’s – Manpower, Materials, Methods, Machinery People Policies Materials Equipment Life style Environment Etc.
  • 47.
    Cause and EffectDiagrams - Construction For each main cause category brainstorm ideas as to what are the related sub-causes that might effect our issue   Use the 5 Why’s technique when a cause is identified Keep repeating the question until no other causes can be identified List the sub-cause using arrows Effect Header Header Header Header why why why why
  • 48.
    Selecting Items toInvestigate When the Cause and Effect Diagram is finished it is time to decide what few areas should be focused on to develop solutions to solve the effect Some are obvious – low hanging fruit Some require some research using the other QI tools such as: Pareto Diagrams Run Charts Surveys Histograms Etc.
  • 49.
    Obese Children LifeStyle Policies Environment TV Viewing No Time For Food Prep No Outdoor Play Unsafe Juices Bottle Pacifier Less Fruits and Veg. Less Income Maternal Choices Less Vigorous Exercise Curriculum No Sidewalks Unhealthy Food Choices Few Community Recreational Areas or Programs Built Environment For Strollers Not Toddling Less Indoor Mobility TV Pacifier Unsafe Housing Sodas/Snacks Decreased Breast Feeding Early Feeding Practices Genetics Syndromes Genes Pre Natal Practices Excess Maternal Weight Gain Over Weight Newborn Over Weight Pre School At School At Home
  • 50.
    Problem (Effect) 5Why’s Technique Why? Why? Why? Why? Why?
  • 51.
  • 52.
    Root Cause AnalysisRating Form Potential Root Cause Improved Quality Reduced Costs Improved Customer Satisfaction Others Total Score Ranking Impact Scoring Scale: Low = 1, Medium = 3, High = 5 Impact on the Problem
  • 53.
  • 54.
    Why Employees AreLate For Work? Cause and Effect Diagram
  • 55.
    Stages Of TeamDevelopment Adjourning Bruce Tuckman, 1965 1970
  • 56.
    Three Step Processfor Healthy Teams Teaming Process Coaching and Facilitation Process Planning and Problem Solving Process
  • 57.
    Top Ten ReasonsTeams Fail 1. AIM Statement 2. Team Charter 3. Team Members 4. Problem Solving Process 5. Rapid Cycle 6. Team Maturity 7. Base Line Data 8. Training 9. Root Cause Analysis (RCA) 10. Pilot Testing
  • 58.
    For More InformationNPHPSP User Guide (CDC) http://www.cdc.gov/NPHPSP/PDF/UserGuide.pdf Michigan QI Handbook http://www.accreditation.localhealth.net/MLC-2%20website/Michigans_QI_Guidebook.pdf Public Health Memory Jogger http://www.phf.org/resourcestools/Pages/Public_Health_Memory_Jogger_II.aspx The Public Health Quality Improvement Handbook http://www.phf.org/resourcestools/Pages/PublicHealthQIHandbook.asp Applications and Tools for Creating and Sustaining Healthy Teams http://www.phf.org/resourcestools/Pages/Applications_and_Tools_for_Creating_and_Sustaining_Healthy_Teams.aspx
  • 59.
    Thank you foryour time and attention Questions?

Editor's Notes

  • #3 First step is to organize participation for performance improvement Which includes Establishing or identify structures – I.e. organizations – that will be included in the process. This will often include many of those that were part of the local assessment in the first place. It also requires that leadership support and accountability are ensured. Change is difficult enough without pushing against institutional and leadership barriers. REFER TO USERS’ GUIDE FOR MORE INFO. The second step is to prioritize areas for action. Discuss the results. Put the data into context … of other assessments (e.g., health status and community assessment data such as in the 3 other MAPP assessments), existing strategic directions and community priorities Consider both quantitative data (like the reports that are generated when the data is submitted to CDC) and qualitative information generated from the assessment discussions. Set priorities. Address common priority-setting barriers. The third step is to explore “root causes” of performance. ‘ Once NPHPSP participants have prioritized which of the EPHS or indicators need to be addressed, finding a solution entails delving into possible reasons, or “root causes,” of the weakness or problem. In this next step, “root causes analysis,” sites pause to identify how and why events occur problems occur before jumping to quick conclusions and superficial causes. Only when participants determine why performance problems (or successes!) have occurred will they be able to identify workable solutions that improve future performance. Most performance issues can be traced to some well-defined system causes, such as policies, leadership, funding, incentives, information, personnel, or coordination. [MORE ON THIS IN GUIDE] Step 4 is to develop and implement improvement plans Include Specific targets, and we’d provided an example here… Also, make sure the Strategies address root causes And identify Accountable parties Keep in mind that Performance improvement may require targeted strategies at the system, organizational, managerial, and individual levels Step 5 is to regularly monitor and report progress. Planning doesn’t really do much without implementation. So you plan…implement…evaluate how it’s going…and them make changes based on how its going so that you stay on track towards performance improvement. From Users’ Guide: “Regular reporting of progress is an essential part of the improvement process. A regular reporting cycle promotes accountability for results; helps to sustain momentum; and enables decision making around improvement efforts, resources, and policies. The key to reporting is to provide the right people with the right information at the right time. As examples: A one-page “scorecard” of public health system performance measures with a brief analysis of progress and priorities for future action might be suitable for legislators, boards of health, funders, and the media… A high-level update on NPHPSP performance improvement plans and work group measures might be appropriate for the NPHPSP Steering Committee, health officials, assessment participants, and organizational partners… A detailed update may be useful to work group participants, who need to track information as part of the “Plan-Do-Check-Act” cycle... ”
  • #4 First step is to organize participation for performance improvement Which includes Establishing or identify structures – I.e. organizations – that will be included in the process. This will often include many of those that were part of the local assessment in the first place. It also requires that leadership support and accountability are ensured. Change is difficult enough without pushing against institutional and leadership barriers. REFER TO USERS’ GUIDE FOR MORE INFO. Leadership – top up and bottom down, in order to do QI, the follow-up teams, etc., there needs to be a commitment from leadership or otherwise the time won’t be there. Build in the process strategically – spread, so if you use it in more things, then there is a greater chance for spread. So, look at HP 2020 objectives and where you are and how you can get there via QI MAPP piece is about the entire system – involving others… Alignment with other opportunities for spread…
  • #5 The second step is to prioritize areas for action. Discuss the results. Put the data into context … of other assessments (e.g., health status and community assessment data such as in the 3 other MAPP assessments), existing strategic directions and community priorities Consider both quantitative data (like the reports that are generated when the data is submitted to CDC) and qualitative information generated from the assessment discussions. Set priorities. Address common priority-setting barriers.
  • #6 ‘ Once NPHPSP participants have prioritized which of the EPHS or indicators need to be addressed, finding a solution entails delving into possible reasons, or “root causes,” of the weakness or problem. In this next step, “root causes analysis,” sites pause to identify how and why events occur problems occur before jumping to quick conclusions and superficial causes. Only when participants determine why performance problems (or successes!) have occurred will they be able to identify workable solutions that improve future performance. Most performance issues can be traced to some well-defined system causes, such as policies, leadership, funding, incentives, information, personnel, or coordination. [MORE ON THIS IN GUIDE]
  • #7 Step 4 is to develop and implement improvement plans Include Specific targets, and we’d provided an example here… Also, make sure the Strategies address root causes And identify Accountable parties Keep in mind that Performance improvement may require targeted strategies at the system, organizational, managerial, and individual levels There’s no one right to do this. Not every pathway you take works… Need to stop and take stock of where you are and re-do… All you can get is a paper-cut….
  • #8 Step 5 is to regularly monitor and report progress. Planning doesn’t really do much without implementation. So you plan…implement…evaluate how it’s going…and them make changes based on how its going so that you stay on track towards performance improvement. From Users’ Guide: “Regular reporting of progress is an essential part of the improvement process. A regular reporting cycle promotes accountability for results; helps to sustain momentum; and enables decision making around improvement efforts, resources, and policies. The key to reporting is to provide the right people with the right information at the right time. As examples: A one-page “scorecard” of public health system performance measures with a brief analysis of progress and priorities for future action might be suitable for legislators, boards of health, funders, and the media… A high-level update on NPHPSP performance improvement plans and work group measures might be appropriate for the NPHPSP Steering Committee, health officials, assessment participants, and organizational partners… A detailed update may be useful to work group participants, who need to track information as part of the “Plan-Do-Check-Act” cycle... ”
  • #9 Focus on: Plan Plan changes aimed at improvement, matched to root causes PDCA in Users’ Guide: Plan : Plan changes aimed at improvement, matched to root causes; identify measures of improvement. Do : Carry out changes; try first on a small scale. Check : See if you get desired results. Act : Make changes based on what you learned; spread success or try again. *Also called Plan–Do–Study–Act (PDSA), Deming, or Shewhart cycles.
  • #30 Current state accuracy is important since it will be the point from which all improvements will be measured. Show all the problems – don’t try to cover them up
  • #32 Flowcharts don't work if they're not accurate or if the team is too far removed from the process itself. Team members should be true participants in the process and feel free to describe what really happens. A thorough flowchart should provide a clear view of how a process works. With a completed flowchart, you can: Identify time lags and non-value-adding steps. Identify responsibility for each step. Brainstorm for problems in the process. Determine major and minor inputs into the process with a cause & effect diagram. Choose the most likely trouble spots with the consensus builder.
  • #33 Flowcharts don't work if they're not accurate or if the team is too far removed from the process itself. Team members should be true participants in the process and feel free to describe what really happens. A thorough flowchart should provide a clear view of how a process works. With a completed flowchart, you can: Identify time lags and non-value-adding steps. Identify responsibility for each step. Brainstorm for problems in the process. Determine major and minor inputs into the process with a cause & effect diagram. Choose the most likely trouble spots with the consensus builder.
  • #34 These symbols are in Microsoft Power Point
  • #35 The more questions everyone asks the better. 
  • #37 Unnecessary Tasks-usually paperwork or approval Duplication-identical activities occurring at different places in the process flow Disconnects- process activities that are missing making the rest perform poorly