IRJET- Early Detection of Glaucoma using Image Processing
•
1 like•12 views

https://www.irjet.net/archives/V7/i1/IRJET-V7I1127.pdf

Recommended
Recommended
More Related Content
What's hot
What's hot (20)
Similar to IRJET- Early Detection of Glaucoma using Image Processing
Similar to IRJET- Early Detection of Glaucoma using Image Processing (20)
More from IRJET Journal
More from IRJET Journal (20)
Recently uploaded
Recently uploaded (20)
IRJET- Early Detection of Glaucoma using Image Processing
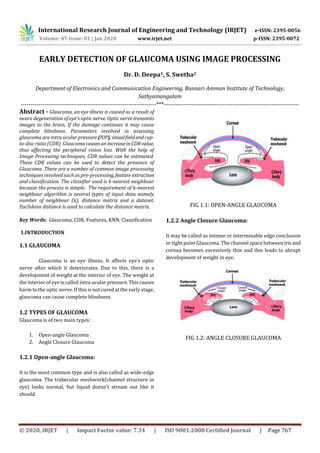
- 1. International Research Journal of Engineering and Technology (IRJET) e-ISSN: 2395-0056 Volume: 07 Issue: 01 | Jan 2020 www.irjet.net p-ISSN: 2395-0072 © 2020, IRJET | Impact Factor value: 7.34 | ISO 9001:2008 Certified Journal | Page 767 EARLY DETECTION OF GLAUCOMA USING IMAGE PROCESSING Dr. D. Deepa1, S. Swetha2 Department of Electronics and Communication Engineering, Bannari Amman Institute of Technology, Sathyamangalam ---------------------------------------------------------------------***--------------------------------------------------------------------- Abstract - Glaucoma, an eye illness is caused as a result of neuro degeneration of eye’s optic nerve. Optic nerve transmits images to the brain. If the damage continues it may cause complete blindness. Parameters involved in assessing glaucoma are intra ocular pressure (IOP), visualfieldandcup- to-disc ratio (CDR). Glaucoma causesanincreaseinCDRvalue, thus affecting the peripheral vision loss. With the help of Image Processing techniques, CDR values can be estimated. These CDR values can be used to detect the presence of Glaucoma. There are a number of common image processing techniques involved such as pre-processing, featureextraction and classification. The classifier used is k-nearest neighbour because the process is simple. The requirement of k-nearest neighbour algorithm is several types of input data namely number of neighbour (k), distance matrix and a dataset. Euclidean distance is used to calculate the distance matrix. Key Words: Glaucoma, CDR, Features, KNN, Classification 1.INTRODUCTION 1.1 GLAUCOMA Glaucoma is an eye illness. It affects eye’s optic nerve after which it deteriorates. Due to this, there is a development of weight at the interior of eye. The weight at the interior of eye is called intra ocular pressure.Thiscauses harm to the optic nerve. If this is not cured at the early stage, glaucoma can cause complete blindness. 1.2 TYPES OF GLAUCOMA Glaucoma is of two main types: 1. Open-angle Glaucoma 2. Angle Closure Glaucoma 1.2.1 Open-angle Glaucoma: It is the most common type and is also called as wide-edge glaucoma. The trabecular meshwork(channel structure in eye) looks normal, but liquid doesn’t stream out like it should. FIG 1.1: OPEN-ANGLE GLAUCOMA 1.2.2 Angle Closure Glaucoma: It may be called as intense or interminable edge conclusion or tight point Glaucoma. The channel space between irisand cornea becomes excessively thin and this leads to abrupt development of weight in eye. FIG 1.2: ANGLE CLOSURE GLAUCOMA
- 2. International Research Journal of Engineering and Technology (IRJET) e-ISSN: 2395-0056 Volume: 07 Issue: 01 | Jan 2020 www.irjet.net p-ISSN: 2395-0072 © 2020, IRJET | Impact Factor value: 7.34 | ISO 9001:2008 Certified Journal | Page 768 1.3 PROPOSED GLAUCOMA DETECTION SYSTEM FIG 1.3: PROPOSED SYSTEM Preprocessing: Preprocessing is usually done before the main processing of the image. It is normally done to remove unwanted portions of the image to be processed. This helps in improvement of the image. Feature Extraction: Feature extraction helps in extraction of the region of interest which is represented for further processing. Optic Cup Segmentation: The segmentation of Optic Cup is quite challenging because of density of blood vessels covering parts of cup and gradual change in colour intensity between rim and the cup. Sometimesthekinkspresentin the blood vessels help in detection of cup boundaries. Optic Disc Segmentation : Optic Disc isconsideredasoneof the most fundamental part of retinal image. The detection of Optic Disc is considered as a pre-processing component in various methods of image segmentation of retinal images. It is a most common step in retinal image screening procedures. The Optic Disc is of vertical oval(elliptical) shape. It is divided into two separate zones: central zone (cup) and peripheral zone (neuroretinal rim). Presence of Glaucoma is indicated by the variations in colour, shape or depth of Optic Disc. Cup to Disc Ratio: The CDR calculation is usedinoptometry and ophthalmology to detecttheglaucoma movement.There is a region called optic circle which belongs to anatomical area of eye’s “vulnerable side”. The “vulnerable side” is the region where the optic vein and nerve enters the retina. The CDR ratio deals with the distancebetweenthecuppartof the optic circle and the width of optic plate. The high value of CDR infers the risk of Glaucoma. Classification: This is an important step in which the decision is made. The classifier used here is k-nearest neighbour which is a simple classifier. The requirementofk- nearest neighbour algorithm is several types of input data namely number of neighbour (k), distance matrix and a dataset. Euclidean distance is used to calculate the distance matrix. 2.1 FLOW DIAGRAM The image to be processed is obtained as a raw image. The region of interest is extracted from the input image. The region of interest in glaucoma detection is Optic disc and cup. These are used in the estimation of CDR values. Based on the CDR values, the input image is classified as Normal eye or Glaucoma affected eye. There are a number of methods available in image processing. The techniques used in detection of glaucoma are Image Enhancement, Image Segmentation, Feature extraction, Morphology, etc. Degeneration of optic nerves causes Glaucoma. So the fall in circulatory system to the optic nerve accommodate the visual field surrendersrelatedwithglaucoma.Morphological features of fundus images can be used to detect the damage
- 3. International Research Journal of Engineering and Technology (IRJET) e-ISSN: 2395-0056 Volume: 07 Issue: 01 | Jan 2020 www.irjet.net p-ISSN: 2395-0072 © 2020, IRJET | Impact Factor value: 7.34 | ISO 9001:2008 Certified Journal | Page 769 caused to optic nerve fibre. Glaucoma can be detected using the following features, 1. Cup-to-disc ratio (CDR) 2. Ratio between area of blood vessels in inferior-superior side and the nasal-temporal side 3. Ratio of distance between the optic disc center and optic nerve head to diameter of the optic disc The main parts involved in detection of glaucoma are Optic Cup and Optic Disc. Image Segmentation process is carried out for Optic Cup and Optic Disc. This helps in calculation of CDR (cup-to-disc) value. Changes in CDR valueareviewed as the significant sign of glaucoma. 3. OUTPUT DESCRIPTION 3.1 INPUT IMAGE ACQUISITION FIG 3.1 shows the images given as input to detect the presence of Glaucoma. a) Glaucoma affected eye b) Normal eye FIG 3.1: INPUT IMAGES From the above image, the glaucoma is detected and the corresponding disk segment image, disc boundary, cup image and the cup boundary is identified. 3.2 IMAGE WITH GLAUCOMA FIG 3.2:OUTPUT IMAGE OF A GLAUCOMA DETECTED EYE FIG 3.3: DETECTION OF GLAUCOMA The output image acquired for Glaucoma affected eye is given in FIG 3.3. As per the details given in FIG 3.3, the presence of Glaucoma is detected. The key factor for glaucoma detection is the CDR value. CDR valuegreaterthan 0.4 indicates the presence of Glaucoma. Since the value here is 0.837794 which is greater than 0.4, there is a risk of Glaucoma. 3.3 IMAGE WITHOUT GLAUCOMA FIG 3.5:OUTPUT IMAGE OF A NORMAL EYE FIG 3.6:ABSENCE OF GLAUCOMA
- 4. International Research Journal of Engineering and Technology (IRJET) e-ISSN: 2395-0056 Volume: 07 Issue: 01 | Jan 2020 www.irjet.net p-ISSN: 2395-0072 © 2020, IRJET | Impact Factor value: 7.34 | ISO 9001:2008 Certified Journal | Page 770 The output image for a normal eye is represented in FIG 3.5. The CDR value here is 0.266856. The CDR value being less than 0.4, there is no risk of Glaucoma. These details are depicted in FIG 3.6 Table 3.1: CDR Values About 10 images were taken as input. And as per the CDR values the presence of Glaucoma is detected. When the CDR value falls in the range of 0.1 to 0.4, then there is no risk of Glaucoma. The eye is Normal. Whereas when the CDR value is above 0.4, then there is a risk of Glaucoma. 4. CONCLUSION Glaucoma occurs as a result of neuro degeneration of eye’s optic nerve. This may cause permanent vision loss. Hence, detection of this disease at the early stage helps in prevention of vision loss. In this paper, CDR is considered as the main parameter to detect the presence of Glaucoma. There are many features whichcontributetothedetectionof Glaucoma. REFERENCES [1] Kevin Noronha, Jagadish Nayak, S.N.Bhat,“Enhancement of retinal fundus Image tohighlightthefeaturesfordetection of abnormal eyes” [2] Sangyeol Lee, Michael D. Abr`amoff, and Joseph M. Reinhardt. ”Validation of Retinal Image Registration Algorithmsby a Projective Imaging Distortion Model”29th Annual InternationalConference of the IEEE EMBSCité Internationale, Lyon, FranceAugust 23-26, 2007 [3] S. Sekhar,"Automated localisation of retinal optic disk using hough transform",Department of Electrical Engineering and Electronics, University of Liverpool, UK. [4] Zhuo Zhang,"ORIGA-light : An Online Retinal Fundus Image Database for Glaucoma Analysis and Research", 32nd Annual International Conference of the IEEE EMBSBuenos Aires, Argentina, August 31 - September 4, 2010 [5] VahabiZ,”The new approach to Automatic detection of Optic Disc from non-dilated retinal images”Proceedings ofthe 17th Iranian Conference of Biomedical Engineering (ICBME2010), 3-4 November 2010 [6] Zafer Yavuz,"RETINAL BLOOD VESSEL SEGMENTATION USING GABOR FILTER AND TOPHAT TRANSFORM",2011 IEEE 19th Signal Processing and Communications ApplicationsConference(SIU2011)978-1- 4577-0463-511/11 ©2011 IEEE [7] Nilan jan Dey," Optical Cup to Disc Ratio Measurement for Glaucoma Diagnosis Using Harris Corner",ICCCNT12 [8] HarrisC, Stephens, M. ,1 988, A Combined Corner and EdgeDetector, Prooeedingsof 4th Alvey Vision Conference [9] Kon stantino s G Derpanis, 200 4, The Harris Corner Detector [10] R. Geetha Ramani,"Automatic Prediction of Diabetic Retinopathy and Glaucoma through Retinal Image Analysis and Data Mining Techniques” CDR RESULT 0.762696 Glaucoma 0.266856 Normal 0.821629 Glaucoma 0.588591 Glaucoma 0.138271 Normal 0.362347 Normal 0.593860 Glaucoma 0.260040 Normal 0.379974 Normal 0.837794 Glaucoma