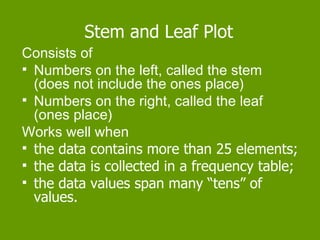
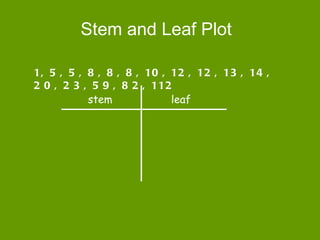
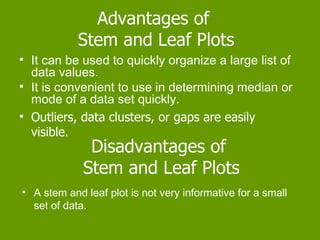
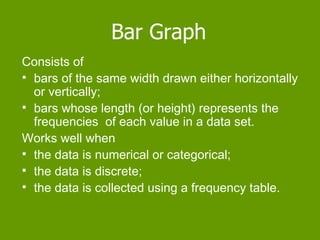
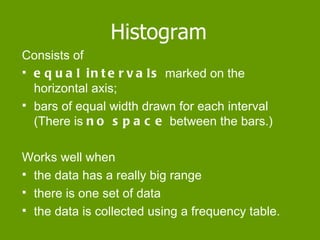
Stem and Leaf Plot
Consists of
 Numbers on the left, called the stem
  (does not include the ones place)
 Numbers on the right, called the leaf
  (ones place)
Works well when
 the data contains more than 25 elements;
 the data is collected in a frequency table;
 the data values span many “tens” of
  values.
Stem and Leaf Plot

1, 5 , 5 , 8 , 8 , 8 , 10 , 12 , 12 , 13 , 14 ,
2 0 , 2 3 , 5 9 , 8 2 , 112
           stem             leaf
Advantages of
             Stem and Leaf Plots
   It can be used to quickly organize a large list of
    data values.
   It is convenient to use in determining median or
    mode of a data set quickly.
   Outliers, data clusters, or gaps are easily
    visible.
               Disadvantages of
              Stem and Leaf Plots
   A stem and leaf plot is not very informative for a small
    set of data.
Bar Graph
Consists of
 bars of the same width drawn either horizontally
  or vertically;
 bars whose length (or height) represents the
  frequencies of each value in a data set.
Works well when
 the data is numerical or categorical;
 the data is discrete;
 the data is collected using a frequency table.
Bar Graph Example
Advantages of Bar Graphs
   The mode is easily visible.
   A bar graph can be used with numerical or
    categorical data.


    Disadvantages of Bar Graphs
   A bar graph shows only the frequencies of the
    elements of a data set.
Histogram
Consists of
 e q u a l i n t e r v a l s marked on the
  horizontal axis;
 bars of equal width drawn for each interval
  (There is n o s p a c e between the bars.)

Works well when
 the data has a really big range
 there is one set of data
 the data is collected using a frequency table.
Histogram Example


   70-74 75-79 80-84 85-89 90-94 95-99
Advantages of Histograms
        A histogram provides a way to display the
         frequency of occurrences of data along an
         interval.


        Disadvantages of Histograms
       The use of intervals prevents the calculation of
        an exact measure of central tendency.

Stem & leaf, Bar graphs, and Histograms

  • 1.
    Stem and LeafPlot Consists of  Numbers on the left, called the stem (does not include the ones place)  Numbers on the right, called the leaf (ones place) Works well when  the data contains more than 25 elements;  the data is collected in a frequency table;  the data values span many “tens” of values.
  • 2.
    Stem and LeafPlot 1, 5 , 5 , 8 , 8 , 8 , 10 , 12 , 12 , 13 , 14 , 2 0 , 2 3 , 5 9 , 8 2 , 112 stem leaf
  • 3.
    Advantages of Stem and Leaf Plots  It can be used to quickly organize a large list of data values.  It is convenient to use in determining median or mode of a data set quickly.  Outliers, data clusters, or gaps are easily visible. Disadvantages of Stem and Leaf Plots  A stem and leaf plot is not very informative for a small set of data.
  • 4.
    Bar Graph Consists of bars of the same width drawn either horizontally or vertically;  bars whose length (or height) represents the frequencies of each value in a data set. Works well when  the data is numerical or categorical;  the data is discrete;  the data is collected using a frequency table.
  • 5.
  • 6.
    Advantages of BarGraphs  The mode is easily visible.  A bar graph can be used with numerical or categorical data. Disadvantages of Bar Graphs  A bar graph shows only the frequencies of the elements of a data set.
  • 7.
    Histogram Consists of  eq u a l i n t e r v a l s marked on the horizontal axis;  bars of equal width drawn for each interval (There is n o s p a c e between the bars.) Works well when  the data has a really big range  there is one set of data  the data is collected using a frequency table.
  • 8.
    Histogram Example 70-74 75-79 80-84 85-89 90-94 95-99
  • 9.
    Advantages of Histograms  A histogram provides a way to display the frequency of occurrences of data along an interval. Disadvantages of Histograms  The use of intervals prevents the calculation of an exact measure of central tendency.