Downloaded 63 times

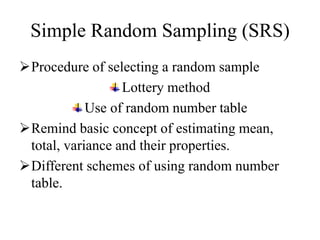


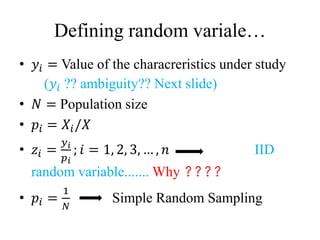
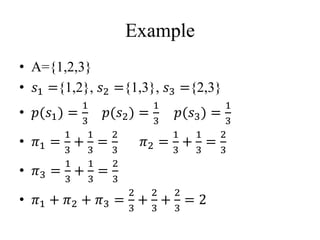
![Expectation
Sample-1 Sample-2 Sample-3 Sample-k
𝑠1 𝑠2 𝑠3 𝑠 𝑘
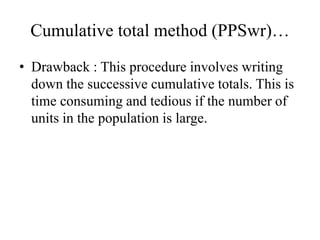
𝐸𝑥𝑝𝑒𝑐𝑡𝑎𝑡𝑖𝑜𝑛 𝐸[𝑠] =
1
𝑘
𝑖=1
𝑘
𝑠𝑖
𝑠𝑖 be any
statistic like
mean
variance,
standard
deviation
… … …
… … …
𝑃𝑜𝑝 𝑛
𝑠𝑖𝑧𝑒 = 𝑁
Sample size=n
Sample
𝑁
𝑛
= 𝑘](https://image.slidesharecdn.com/stat-3203ppssampling-180923173541/85/Stat-3203-pps-sampling-22-320.jpg)
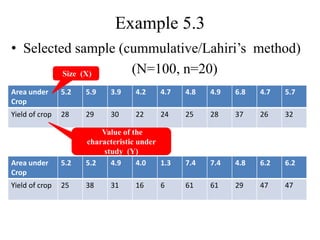
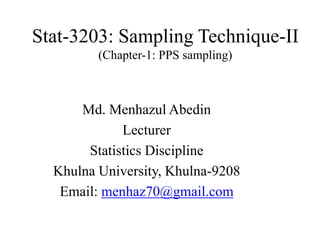
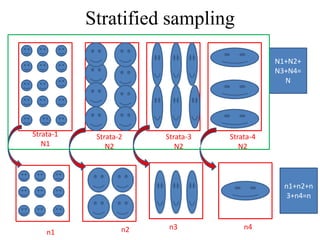
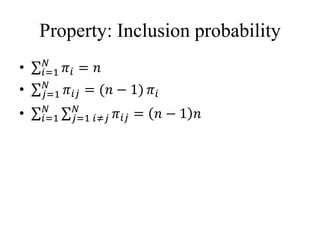
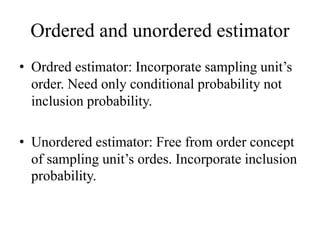
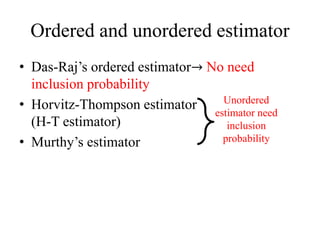
![Estimators…
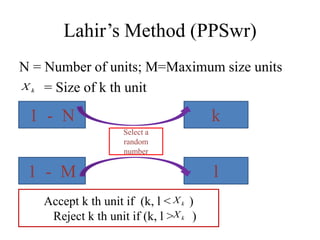
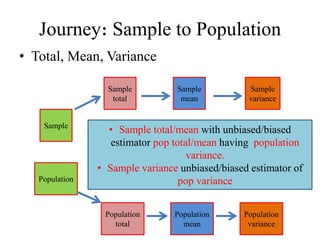
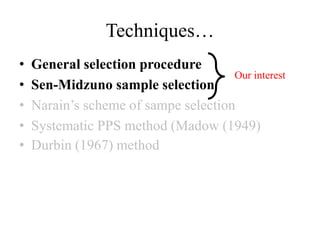
• Theorem: In pps sampling, wr, an unbiased
estimator of 𝑉( 𝑌𝑝𝑝𝑠)is given by
• 𝑣( 𝑌𝑝𝑝𝑠) =
1
𝑛(𝑛−1) 1
𝑛
(
𝑦 𝑖
𝑝 𝑖
− 𝑌𝑝𝑝𝑠)2
=
1
𝑛(𝑛−1)
[ 1
𝑛
(
𝑦 𝑖
𝑝 𝑖
)2
−𝑛 𝑌𝑝𝑝𝑠
2
]](https://image.slidesharecdn.com/stat-3203ppssampling-180923173541/85/Stat-3203-pps-sampling-27-320.jpg)
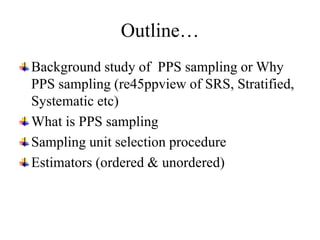
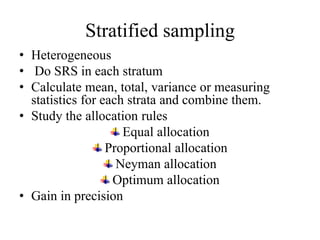
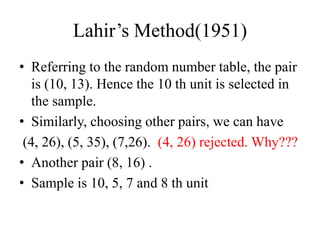
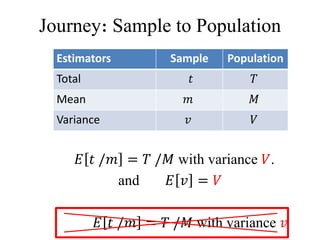
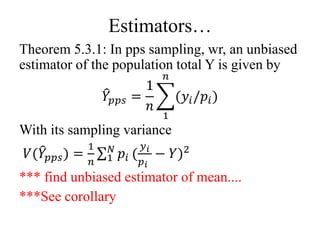
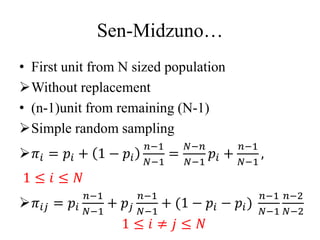
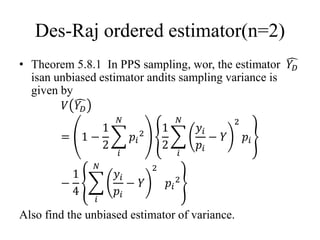
![Example 5.3
• 𝑦𝑝𝑝𝑠 =
1
𝑛𝑁 1
𝑛
(𝑦𝑖/𝑝𝑖) =
𝑋
𝑛𝑁 1
𝑛
(𝑦𝑖/𝑥𝑖) =
484.5
20 ∗ 100
∗ 120.5930 = 29.11
• 𝑣( 𝑦𝑝𝑝𝑠) =
1
𝑛 𝑛−1 𝑁2 [ 1
𝑛 𝑦 𝑖
𝑝 𝑖
2
− 𝑛 𝑌𝑝𝑝𝑠
2
] =
1
20∗19∗100∗100
171249828.1 − 20 ∗ 155785427.3
= 4.06957916 ≅ 4
• Stadard error= 𝑣( 𝑦𝑝𝑝𝑠 = 4 = 2](https://image.slidesharecdn.com/stat-3203ppssampling-180923173541/85/Stat-3203-pps-sampling-29-320.jpg)

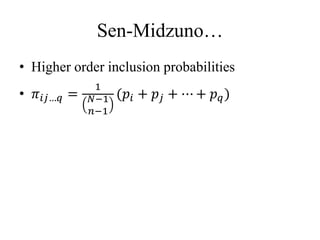
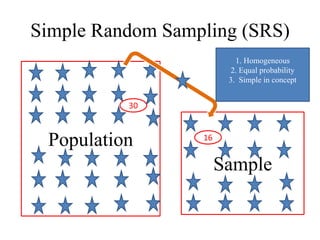
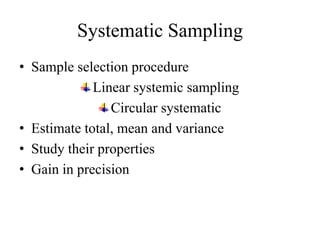
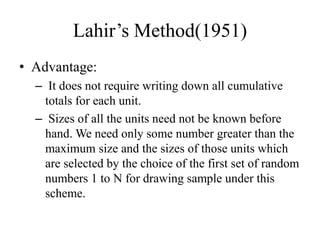
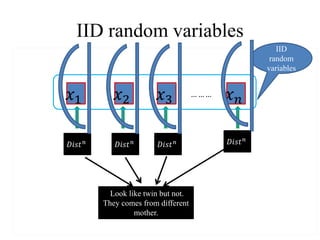
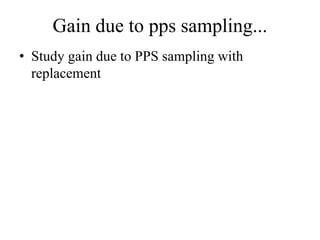
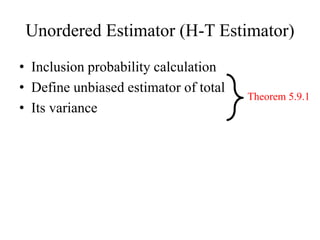
![Das-Raj ordered estimator(n=2)
• 𝑦1 → 𝑝1 and 𝑦2 → 𝑝2
[Initial probabilities]
• Define two random variable
– 𝑧1 =
𝑦1
𝑝1
– 𝑧2 = 𝑦1 + 𝑦2(1 − 𝑝1)/𝑝2
• Des-Raj’s total
– 𝑌𝐷 =(𝑧1 + 𝑧2)/2 =
𝑦1 1+𝑝1
𝑝1
+
𝑦2 1−𝑝1
𝑝2](https://image.slidesharecdn.com/stat-3203ppssampling-180923173541/85/Stat-3203-pps-sampling-41-320.jpg)


1) The document discusses probability proportional to size (PPS) sampling techniques, including PPS sampling with and without replacement. 2) Cumulative total and Lahiri's methods are described for PPS sampling with replacement, while general selection procedure, Sen-Midzuno method, and Narain's scheme are covered for PPS sampling without replacement. 3) Estimators for population totals, means, variances, and inclusion probabilities are defined for PPS samples. Both ordered and unordered estimators are discussed.