Downloaded 266 times
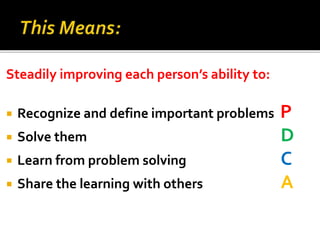
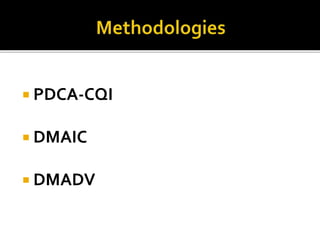
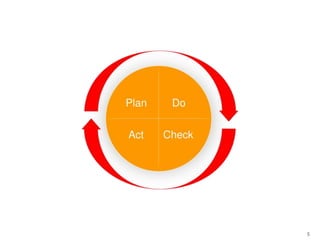
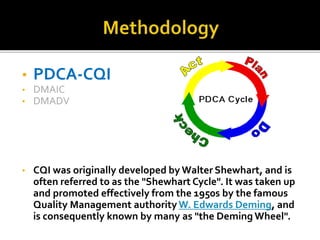
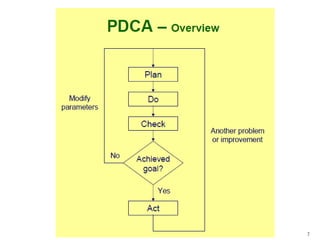
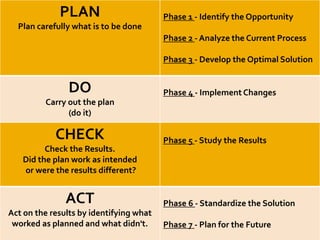
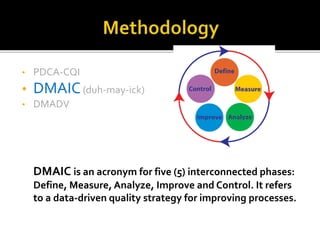
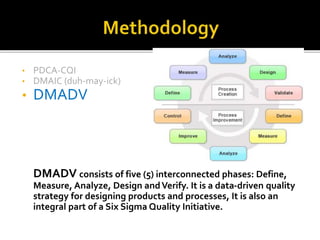
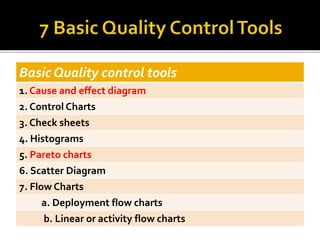
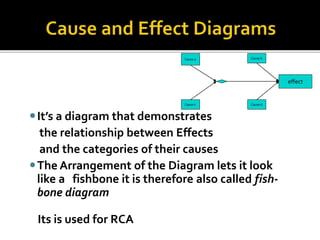
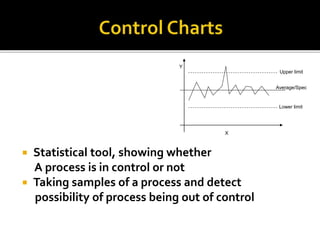
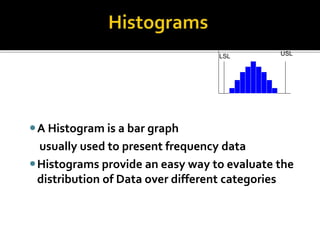
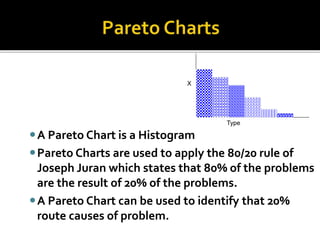
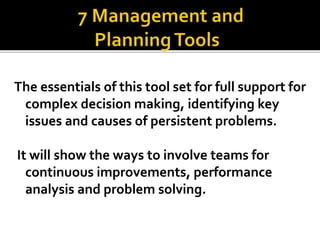
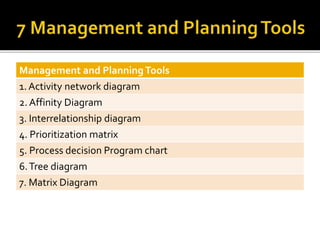

This document discusses quality management tools including PDCA-CQI, DMAIC, and DMADV. PDCA-CQI refers to the plan-do-check-act cycle for continuous quality improvement. DMAIC is a five-phase process for improving processes, and DMADV is a five-phase process for designing products and processes. Seven basic quality tools are then defined: cause-and-effect diagrams, control charts, check sheets, histograms, Pareto charts, scatter diagrams, and flow charts. Management and planning tools are also briefly mentioned. The presentation aims to explain these tools to support complex decision making and continuous improvement efforts.


![7 qc tools training material[1]](https://cdn.slidesharecdn.com/ss_thumbnails/7qctoolstrainingmaterial1-120925054558-phpapp02-thumbnail.jpg?width=640&height=640&fit=bounds)


