Download to read offline

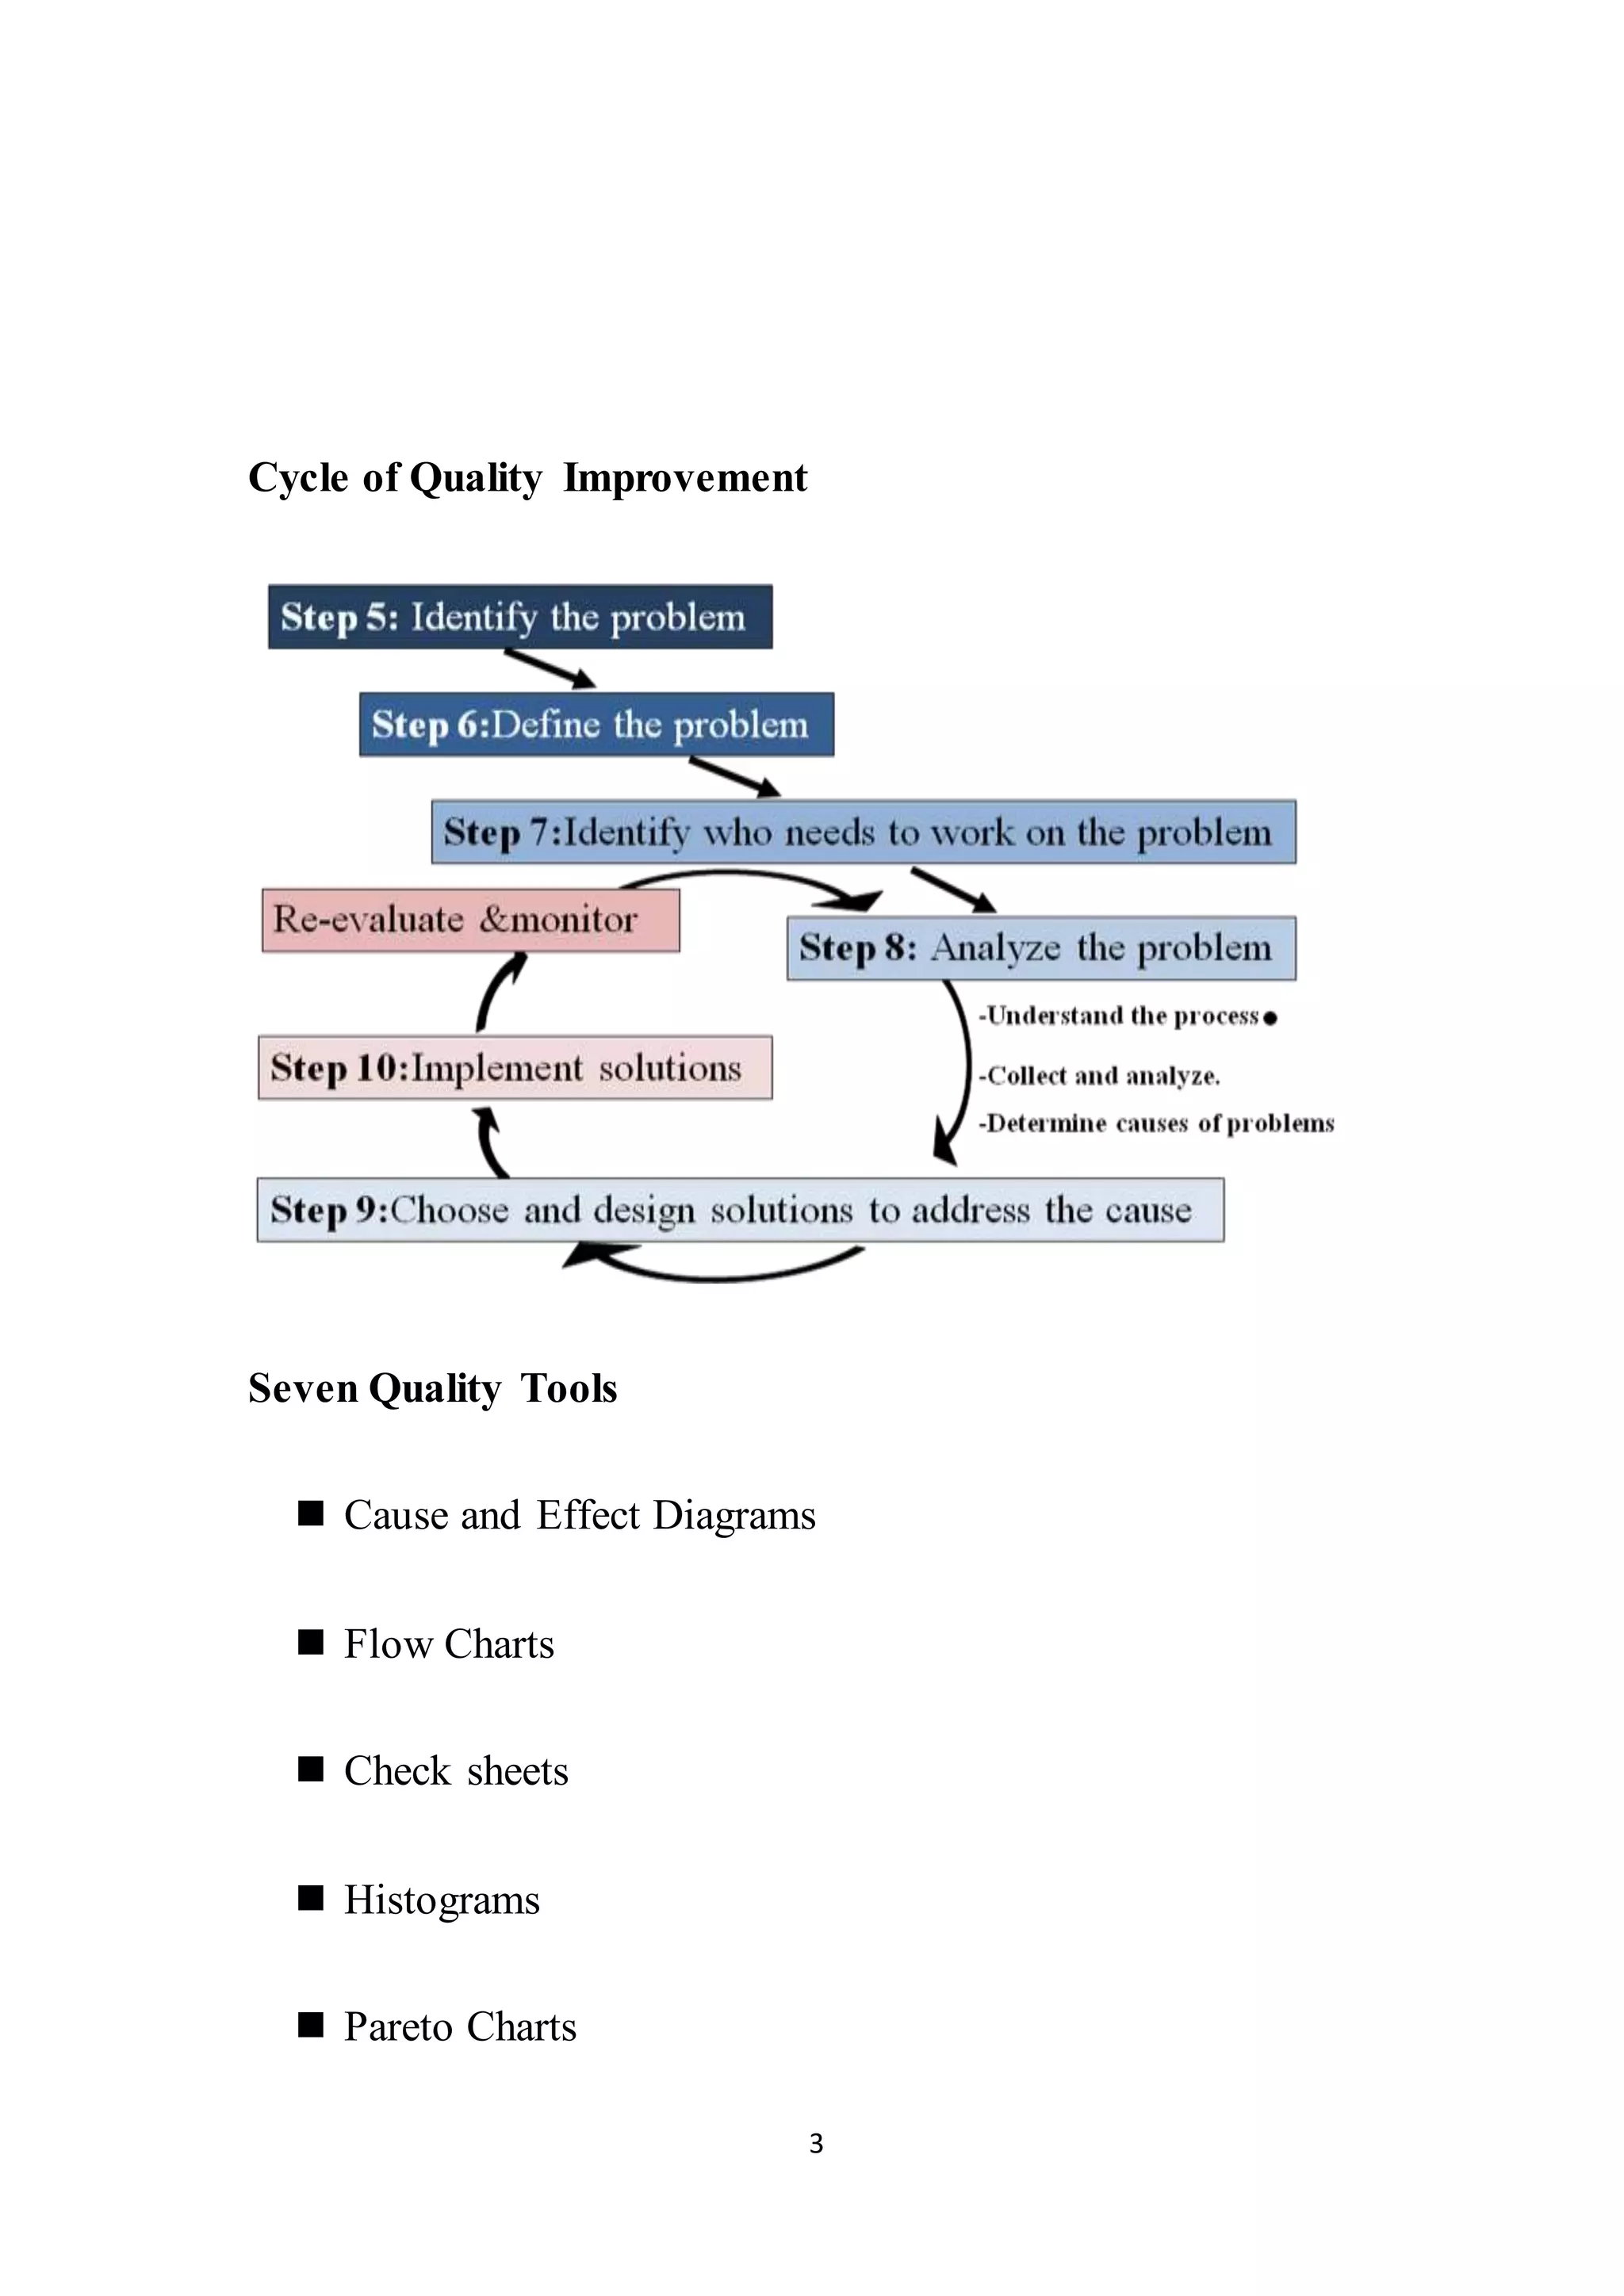


The document discusses seven quality measurement tools: brainstorming, cause and effect diagrams, flow charts, checksheets, histograms, Pareto charts, control charts, and scatter diagrams. It provides an overview of the purpose and benefits of each tool. The tools can be used to identify problems, determine causes of variation, visualize processes, prioritize issues, and monitor quality control. The overall goal of using these tools is to improve quality, decrease costs, increase productivity and market share through data-driven process analysis and optimization.


