Download as PDF, PPTX


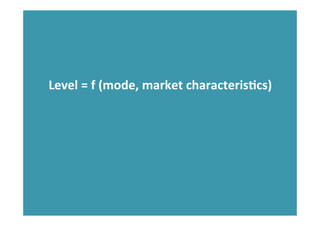

![Mode/Level Speed
[km/h] Separate
ROW
Vienna
Bus 1 17 Limited
Tram 1 15 Par*al
Rapid
Transit 2 32 Full
Regional
Rail 3 45 Full
Boston
Bus 1 18 Limited
Light
Rail 1 20 Par*al
Rapid
Transit 2 25 Full
Regional
Rail 3 50 Full
(GC)
Zurich
Bus H 18 Limited
Tram H 15-‐20 Par*al
Regional
Rail H 50 Full
San
Francisco
Bus 1 14 No
Tram
(Muni
Metro) H 15-‐27 Par*al
Rapid
Transit
(BART) H 56 Full
Regional
(Caltrain) 3 65 Full
(GC)
Speed
Comparison:
3-‐
vs
2-‐level
PT
System](https://image.slidesharecdn.com/2015-nash-pt-levels-7jan15-4-150102112435-conversion-gate02/85/A-level-based-approach-to-public-transport-network-planning-21-320.jpg)

![Shi]
demand
to
level
“0”
–
ac*ve
transport
Ship
short
trips
from
public
transit
to
Level
“0”
–
Biking
and
Walking](https://image.slidesharecdn.com/2015-nash-pt-levels-7jan15-4-150102112435-conversion-gate02/85/A-level-based-approach-to-public-transport-network-planning-35-320.jpg)
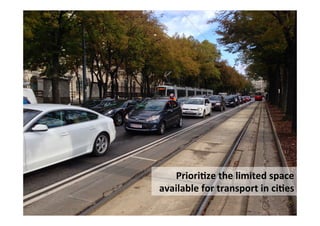


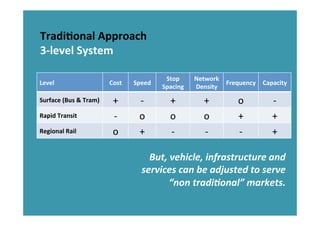
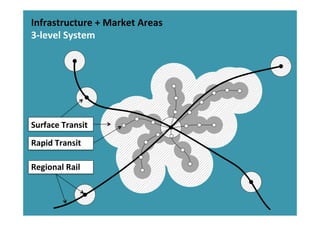
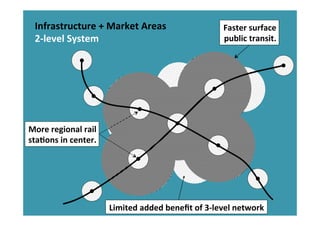
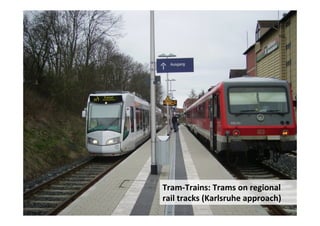
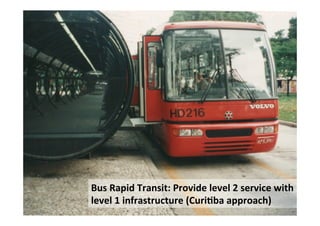
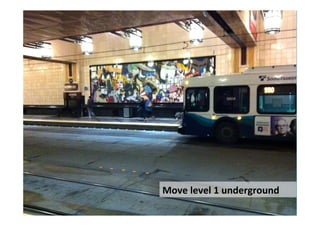
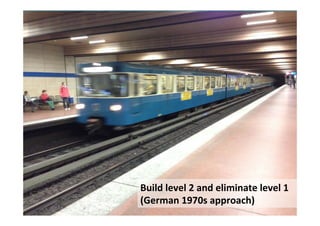
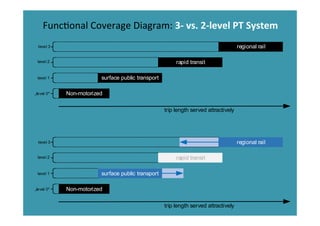
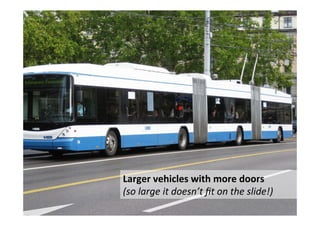
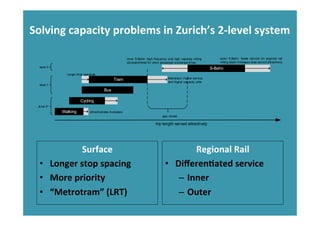
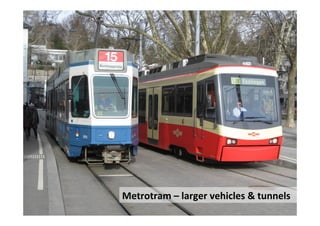
This document discusses a level-based approach to public transport network planning. It describes a traditional three-level system with regional rail, rapid transit, and surface transit. However, some cities have found that a two-level system with faster surface transit and more dense regional rail stations can provide similar coverage with limited additional benefit to a three-level system. The document also discusses how Zurich's successful two-level system is now facing capacity issues, and proposes solutions like differentiated regional rail services and "Metrotrams" to address this.


