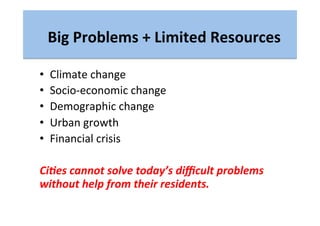
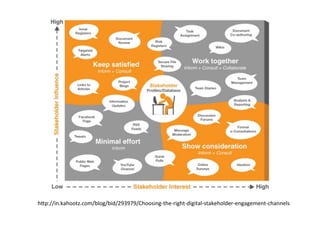
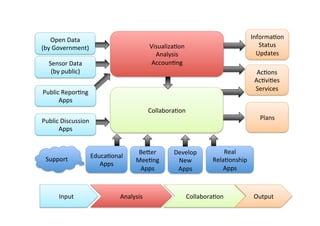
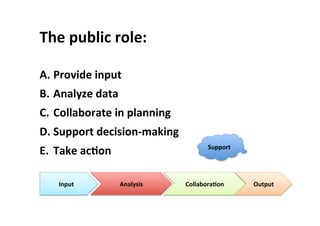
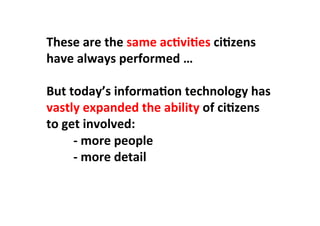
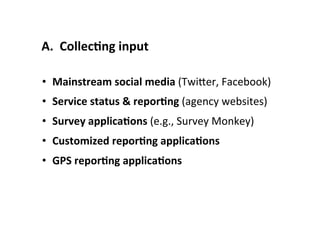
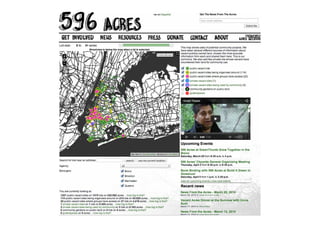
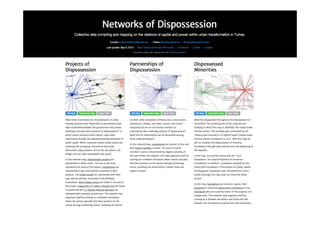
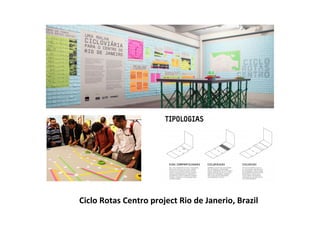
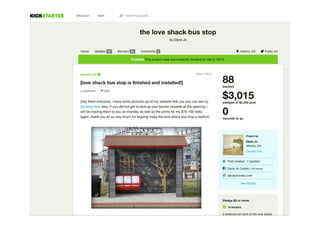
Summary of social media techniques and applications that can be used to improve the public involvement process in urban and transport planning. Including reporting applications, serious games, collaboration tools, educational applications and supporting tools.
The document discusses how cities can become smart through public participation. It argues that cities are smart when they actively involve the public in management through (1) providing open data, (2) using apps to efficiently harness public input, and (3) recognizing that citizens will find their own solutions if opportunities for participation are not provided. The document provides many examples of apps and projects that facilitate public participation in city governance and management.
Public transport crowdsourcing: it's arrived are you on board?Andrew Nash
1. Crowdsourcing is the act of outsourcing functions traditionally performed by employees to an undefined large network of people through open calls.
2. Crowdsourcing is changing public transport through reporting issues via social media, analyzing data, and collaborating on solutions.
3. New technologies have changed the roles of governments, residents, and companies in providing transportation.
This document provides information about redistricting and a public mapping software project. It outlines features of the mapping software that allow users to create redistricting plans, evaluate plans, and share plans. It describes completed redistricting competitions in several states and aims to increase public participation in redistricting. The project is supported by foundations and companies and has an advisory board of experts. The goal is to create alternatives to politics as usual through public engagement with redistricting.
Civic Technology and Mind Sets in Big DataAndrew Nash
This document summarizes Andrew Nash's presentation on civic technology and mindsets in big data. It discusses how civic technology uses data to enable public engagement and participation for good governance. It outlines how data collection and reporting through social media and sensors has increased due to big data. It also describes how this data can be analyzed using open data and tools, and how collaboration and action are taking place through games, visualizations, and decision making platforms. New forms of transportation provision are emerging through information sharing, civic groups, and crowd-sourced or app-based services.
The document summarizes a workshop on pioneering scalable innovation clusters based on open government data initiatives. It discusses the growing urbanization of the world's population and initiatives to create real-time digital platforms of city data, including examples from Singapore and New York. The dataDublin network aims to build a similar real-time digital representation of Dublin city through open data and participation from citizens, businesses, and researchers. The goal is to catalyze innovation and economic activity around urban issues.
Talk: "Using Open Data and Crowdsourcing to develop CycleStreets"CycleStreets
The document discusses CycleStreets, an open source project that provides online cycle route planning and mapping using open data and crowdsourcing. Key points include:
- CycleStreets uses OpenStreetMap data and crowdsourcing to develop a UK-wide cycle journey planner and photomap. Over 2 million journeys have been planned so far mainly through word-of-mouth.
- OpenStreetMap is an open collaborative project to create a free editable map of the world. It uses crowdsourcing where volunteers collect and contribute map data.
- CycleStreets demonstrates how open data and crowdsourcing can be used to develop useful online tools and maps to support cycling at a low cost
Big Data Challenges for the Social SciencesDavid De Roure
Big Data: Challenges for the social sciences. Panel presentation at the World Social Science Forum, International Convention Centre, Durban, South Africa. Tuesday 15 September, 2015
OpenStreetMap and CycleStreets: collaborative map-making and cartography in t...CycleStreets
Abstract: The arrival of web-based mapping from Google and others has revolutionised, in the space of only five years, the way many people interact with maps and map data. And the success of projects such as Wikipedia highlight how collation of small amounts of information from large numbers of people - an approach called 'crowdsourcing' - can challenge traditional models of data collection and ownership. Bringing these concepts together is OpenStreetMap, a collaborative project to create a free editable map of the world. Well-established enterprises such as the Ordnance Survey are coming under increased pressure from this new model, and large companies such as MapQuest and Microsoft are starting to use and invest in it. Martin Lucas-Smith, Webmaster in the Department, and one of two main developers of the leading UK-wide cycle journey planner website, CycleStreets, will discuss OpenStreetMap, its use within a wide range of systems (from cartography, routing, and even its central role helping deal with the Haiti disaster) and discuss the challenges it poses to traditional forms of cartography and data collection.
Mac281 big data & journalism lecture 2014Rob Jewitt
This document discusses the emergence of data journalism and how journalists are using large datasets and data analysis tools to uncover stories and insights. It provides an overview of the history of database journalism and computer-assisted reporting dating back to the 1950s. It also highlights more recent examples where journalists have used mapping, data visualization, and interactive tools to explore and explain different datasets. The document suggests data-driven journalism will be an important growth area for the profession in the future.
This document discusses making data more accessible to society through open data, communication, and technology. It begins by introducing an online discussion on opportunities and challenges of using open data, data visualization, and other technology approaches.
It then discusses three main ways of making data more accessible: open data, which freely shares data for public use; communication, where data is explained through storytelling and visualization to broad audiences; and interactive technology, like apps and crowdsourcing, that enable public participation as data producers. Examples like Mappiness and OpenStreetMap demonstrate how crowdsourced data can benefit society.
The document provides context for an online discussion on these topics from June 11-24, 2014 and invites participation from both experts
This document provides an overview of data journalism. It discusses the origins of database journalism in the 1950s and examples of early practitioners. It also covers recent developments like increased use of data visualization and tools that allow for more interactive data stories. Experts comment that data-driven journalism can uncover important stories and that skills in data analysis and visualization will be increasingly important for journalists. The document also lists some free and popular tools used for data analysis and visualization.
This document discusses how to effectively exploit and leverage both corporate and user-generated content through cooperation between humans and machines. It outlines several challenges, such as dealing with low quality or adversarial content, and proposes solutions like incentivizing high quality contributions and using techniques like crowdsourcing, trust modeling, and gamification to optimize content creation and verification. The key is developing new algorithms and systems that coordinate humans and computers to obtain quality content with minimal resources, while also addressing issues like unreliable algorithms or deception by human contributors.
Data journalism is still a nascent concept in the emerging hyperlocal media sector, but examples of activity do exist – particularly in the US – and steps can be taken to make it more mainstream. This book chapter was part of "Data Journalism: Mapping the Future" published in 10 Jan 2014 and edited by John Mair and Richard Lance Keeble. See: http://www.abramis.co.uk/books/bookdetails.php?id=184549616 for more details.
Co-Design and Placemaking: Open PlanningLara Salinas
The document describes Open Planning, a digital tool created through a collaboration between Lancaster University and local partners to enhance civic engagement in the urban planning process. It involved developing a prototype Open Planning App over 18 months with £15k in funding. The goal was to improve public participation by connecting citizens to planning information and discussions through a digital platform, addressing issues like limited notification and data access that citizens experienced previously. The prototype tested features for notification, accessing meaningful information, and facilitating dialogue, though challenges remained around data availability and balancing stakeholder needs. The project demonstrated the potential for technology to enable systemic change and connect people's everyday lives to public services.
This document discusses the opportunities and challenges presented by big data for social sciences research. New forms of data from social media, tracking, and internet-connected devices allow researchers to study social processes as they unfold in real-time at large scales. However, analyzing this data requires new computational skills and infrastructure. Researchers must also consider new methods and address issues like reproducibility, ethics, and access to ensure quality results. Overall, big data has the potential to transform social sciences by enabling the study of phenomena in new ways, but significant challenges around data, skills, and research practices must be overcome.
Презентація концепції онлайн-платфоми - "єдиного вікна" для публічних консуль...Svitlana Maistruk
Експерт Ради Європи, Сергій Лобойко порезентував у Раді Європи концепцію сучасного інструменту Е-Демократії - розвитку консультацій місцевої влади з громадськістю - для зміцнення довіри між владою та громадськістю, консолідації активних мешканців у НУО та розвитку участі громадськості у виробленні спільних з органами влади рішень.
This document discusses data visualization in journalism. It notes that as the amount of data generated grows exponentially, data visualization is important for understanding and conveying large datasets. The document outlines how data visualization has become an important part of data journalism, with media organizations developing specialized teams. It provides examples of how the Guardian, Seattle Times, New York Times and Reuters have used data visualization for investigative, explanatory and interactive journalism. The document also discusses citizen and independent journalism's use of open data and data visualization for political and social activism. Finally, it addresses challenges around ensuring data-driven graphics are understandable and conveying the limitations of using numbers to represent truth.
Professor Vonu Thakuriah from the University of Glasgow presents at the University's Commonwealth Future Cities Business Networking event on the 24th July 2014
"'Tis true. There's magic in the Web: The Short and the Long of Co-Creation, Web Science, and Data Driven Innovation". Keynote for the DATA-DRIVEN INNOVATION WORKSHOP 2016 collocated with ACM Web Science 2016, Hannover, Germany, Sunday 22 May 2016
8. City Science: Urban Big Data and New Urban SystemsMITEF México
Data-driven analysis of economic
activity, human behavior, mobility
patterns, resource consumption, etc.
in order to inform an evidence-based
process of designing new cities
Networks for Citizen Consultation and Citizen Sourcing of Expertise: Explor...@cristobalcobo
"New ICTs + New Media = New Democracy? Communications policy and public life in the age of broadband"
Experts’ workshop
New America Foundation, 1899 L St NW, Washington, DC
September 20-22, 2011
www.americanthinktank.net
Cristobal Cobo, Ph.D
Research Fellow
Oxford Internet Institute
University of Oxford
Fabrizio Sestini - Collective awareness platforms TechSoup Europe
Collective Awareness Platforms (CAPs) demonstrate new forms of bottom-up social innovation and collaboration using digital tools like open data and knowledge sharing. CAPs address issues like sustainable lifestyles through collaborative consumption and production. They also consider emerging ethics in digital innovation such as social entrepreneurship and direct democracy. The document discusses how CAPs can harness networks and collective intelligence for cooperation beyond traditional economic models. It emphasizes open participation from diverse actors to create awareness of sustainability challenges and grassroots solutions.
Using Minecraft for community engagement and public space designmysociety
This was presented by Pontus Westerberg from UN-Habitat at the Impacts of Civic Technology Conference (TICTeC2016) in Barcelona on 27th April. You can find out more information about the conference here: https://www.mysociety.org/research/tictec-2016/
A level-based approach to public transport network planningAndrew Nash
This document discusses a level-based approach to public transport network planning. It describes a traditional three-level system with regional rail, rapid transit, and surface transit. However, some cities have found that a two-level system with faster surface transit and more dense regional rail stations can provide similar coverage with limited additional benefit to a three-level system. The document also discusses how Zurich's successful two-level system is now facing capacity issues, and proposes solutions like differentiated regional rail services and "Metrotrams" to address this.
Browsers are historically one of the most vulnerable pieces of software. In SYN 321, we will cover:
• How to lock down browsers at the end point for accessing both virtualized and web environments
• Guidance for hardening published browsers, including group policy and PowerShell configuration of security policies
• How to tune browser components to be application-specific and further minimize the attack surface
Watch SYN 321 on SynergyTV and follow along using the slides here. http://live.citrixsynergy.com/2016/player/ondemandplayer.php?presentation_id=01feac45-e487-4a8e-8451-9ec41bb20d6c
This document provides tips and resources for using storytelling and digital storytelling to promote language learning in the classroom. It discusses using tools like graphic organizers, online storyboarding platforms, and augmented reality apps to help students collaboratively create digital stories and read stories to each other. The document emphasizes that technology is just a tool and teachers play the most important role in inspiring and motivating students.
Data visualization allows for data discovery. Choosing the right visualizations is critical to inspire action, create context and aid in retention. Here, the top 10 data visualizations.
This document provides suggestions for promoting literacy among teens using mobile devices. It lists several mobile apps that can be used for reading, writing, and interacting with literary texts, including word games, character roleplaying activities, chapter reflections, creating multimedia like podcasts and book trailers, and collaborative projects. The apps allow for both individual and social mobile learning experiences.
Instrument Rack to visualize Rails requests processing Sqreen
This talk will introduce you to methods typically used to perform low level instrumentation on Ruby software. We apply these methods to Rack and Sinatra in a real life example, used by Sqreen to quickly locate a precise line of Rack source code.
Such methods have been widely used by the author in security related fields.
Regulations, staffing keep energy executives on their toesGrant Thornton LLP
This document summarizes the results of a 2014 survey of 564 executives from U.S. oil and gas companies. The top three operational barriers to growth cited were regulatory uncertainty, staffing challenges, and infrastructure issues. Respondents expected to increase hiring and capital spending in 2015 but were concerned about regulatory complexity, safety risks, and a competitive acquisition environment. The survey aimed to understand pain points currently facing the American energy sector.
This document provides resources for Valentine's Day-themed activities and lessons, including analyzing love quotes, creating comics and movies, learning about idioms, and using apps to send digital greeting cards. Topics covered include famous love quotes, websites for making Valentine's crafts and games, and links to Valentine's Day apps for creating and sharing videos and photo cards. The resources are intended to explore themes of love and relationships through interactive online activities.
The document discusses social media in higher education. It provides an overview of social media, how it differs from traditional marketing, and why it matters for universities. The document outlines various social media platforms and gives examples of engagement campaigns at different universities. It also provides tips for using social media well and measuring its success.
Ruby on Rails security in your Continuous IntegrationSqreen
Sqreen (https://www.sqreen.io) describes how open-source public tools can help improve your software security in your Continuous Integration cycle.
This presentation focus on Ruby on Rails and uses open source Ruby gems as well as Jenkins, an open source CI tool.
Two tools are presented. Arachni (https://github.com/Arachni/arachni) is a dynamic security analysis tool. It need some special scripting to get integrated to Jenkins (ask me!).
Brakeman (https://github.com/presidentbeef/brakeman), a static analysis tool, targets Ruby on Rails applications source code. It can be easily integrated to Jenkins thanks to an existing plug-in.
This method can make the reports hard to understand and process systematically in a CI work flow.
Jean-Baptiste Aviat, Sqreen CTO
Compliance program requirements for the Volcker Rule of the Dodd-Frank ActGrant Thornton LLP
This document outlines the requirements for compliance programs related to proprietary trading activities. It discusses the standard elements required for all compliance programs, including governance, policies and procedures, a system of controls, recordkeeping, training, and independent testing. For enhanced compliance programs, it specifies additional requirements such as separately documenting permissible market-making and hedging activities for each trading desk, quantitative risk measurements, limits on authorized risks and instruments, hedging policies, and procedures for investigating and remediating any violations. Banking entities with over $50 billion in assets but less than $10 billion in trading assets would be subject to the enhanced compliance program requirements without reporting quantitative metrics.
The retail industry is changing fast. You need to react swiftly to market trends and exceed consumer expectations to remain competitive. If that’s not enough, the constant flux of tax regulations only complicates matters. Join us as we discuss federal and state tax updates for the retail industry and how to be better equipped to deal with these issues.
This document outlines learning outcomes for a workshop on diverse communities. The goals are to: describe two identity/diversity theories; summarize how assumptions about difference impact residence hall communities; identify four concepts related to communication in diverse groups; and develop three strategies for inclusive learning opportunities and community standards.
Through the Lens of an iPhone: Dubai, Abu Dhabi, UAEPaul Brown
The following photos were entirely taken and processed by me with an iPhone. See more: http://paulgordonbrown.com/category/iphoneography/
iPhoneography is the art of creating photos with an Apple iPhone. This is a style of mobile photography that differs from all other forms of digital photography in that images are both shot and processed on the iOS device.
This document discusses the digital divide across the globe and its implications. It provides statistics on internet usage rates in different countries, with China having the highest overall usage but the US and UK having higher usage rates per 100 people. It also examines internet access and usage rates in the US by age and location, noting lower rates in rural areas. The document then discusses two levels of the digital divide: access to technology and the skills/competencies to use it effectively. It summarizes a study of NC middle school students' technology use and priorities, finding they are more engaged with out-of-school uses. Teachers face challenges integrating technology due to infrastructure and training limitations.
Content Marketing Strategy: How to Engage & Attract Customers Sandra Fathi
This document outlines a content marketing strategy presented by Sandra Fathi of Affect. The strategy includes determining the interests of target customers, identifying relevant topics for the brand to discuss, creating a content calendar, developing engaging content, leveraging news and trends, keeping audiences returning through recurring content like tips series, and generating actions from customers. The goal is to successfully engage and retain customers through a strategic content marketing approach.
CFOs at transportation companies are wary of potential sales tax changes to service transactions, as well as International Financial Reporting Standards (IFRS) implementation. This infographic is based on our semiannual CFO Survey and focuses in on the industry’s state of mind. View the survey - http://gt-us.co/1xFWKsw
Interactive city tool_structure-nash-14may13.pptxAndrew Nash
This document proposes a structure for understanding interactive city tools. It defines interactive city tools as social-based technologies designed to increase city livability, economic well-being, and sustainability. It then outlines a framework with five categories - input, analysis, collaboration, support, and output - to classify different types of interactive city tools. Several examples of existing tools are provided for each category. The goal is to help cities and residents better understand and develop new interactive tools to address challenges around climate change, growth, and limited resources.
Applications and gamification for transport behaviour change. Includes examples and focus on active participation in planning and provision of city transport services.
Open Data Seminar
Department of Public Expenditure and Reform
D/Public Expenditure and reform, Government Buildings,
Merrion Street, Dublin 2
Conference Room 0.2, South Block
2.00pm, Wednesday 11 February 2015
Tracey P. Lauriault and Rob Kitchin
Programmable City Project, NIRSA, Maynooth University
Digital Master Planning: Can we bring Smart Cities back to Earth? by Anthony ...Gigabit City Summit
Digital Master Planning: Can we bring Smart Cities back to Earth? was presented by Anthony Townsend, founder of Bits and Atoms, at the 2017 Gigabit City Summit.
Timely information to citizens: Innovations in engaging citizens with servi...Dave Harte
Presentation given on 19th August 2009 at Fazeley studios, Digbeth, Birmingham. Event was about data mashing, sponsored by The Guardian and organised by Chris Unitt of Meshed Media.
Know Your Community: Data Power to the PeopleData Con LA
Data Con LA 2020
Description
The City of Los Angeles launched its open data program in 2013, making department-level data open to the public. This initial release of data was welcomed by the research and data science community. However, focus groups and discussions with citizens revealed that it was less accessible to a broad public audience. To address this, the City of Los Angeles is making the data more accessible through the Know Your Community platform which makes neighborhood-level insights and training sessions available for the public.
Speaker
Preston Mills, City of Los Angeles, Community Data Manager
Dave Harte- The Timely Information ProjectPaul Hadley
Digital Birmingham have been commissioned by the Department for Communities and Local Government (CLG) to develop pilot projects that empower citizens to use data and information to better contribute to local decision making. Dave Harte tells us about this, alongside a number of other projects to make Birmingham a 'digital city' by 2010.
The City of Huntsville launched a 18-month master urban planning initiative called The BIG Picture to shape the city's future for decades. They engaged citizens for feedback through surveys, focus groups, and an online community called Imagine Huntsville. The city collected demographic data and promoted engagement through various online and offline channels. So far, the initiative has validated existing plans, identified new issues, informed daily team meetings, and helped educate citizens. The city plans to continue citizen engagement for future projects after The BIG Picture concludes.
The End of Transport Behaviour ModellingAndrew Nash
Presentation on how social media could impact transportation behaviour modelling. Prepared for COST Action TU1305: Social Networks and Travel Behaviour. Presented 15 October 2015, Technion, Haifa.
Technology and Data, Supporting the Homewood Children's Village State of the ...mwiddows
The document provides details about supporting a State of the Village report for the Homewood Children's Village with technology and data. It discusses leveraging technology like an interactive online map to communicate information to stakeholders about initiatives, programs, and money returned to the community. It also talks about collecting additional data through methods like having teens capture stories or texting in addresses of blighted areas. The document recommends establishing a structured feedback loop with the community and creating a data visualization portal to integrate available data and measure impact over time.
The document discusses how Los Angeles created a "GeoHub" to help address various challenges facing the city in a smarter, more efficient way. The GeoHub acts as a central hub where data, maps, and apps can be shared across city departments and with the public. It helps break down data silos and encourages collaboration both internally and with external partners. Some examples of apps created for the GeoHub include one mapping clean streets and another showing construction permits. The GeoHub has transformed LA into a smarter community and can do the same for other organizations by establishing a platform for open data sharing and spatially-enabled civic engagement.
A presentation made to the Commonwealth of Learning, Vancouver Canada April 25, 2013 giving an update on the current status of community based ICT for development initiatives (Community Informatics).
Korea-Australia-New Zealand Broadband Summit 2011: Digital FuturesCollabforge
The KANZ Broadband Summit provides a unique opportunity for industry, research and policy representatives from Australia, Korea and New Zealand to share insights into trends and challenges in our increasing digital future.
Dr Mark Elliott is the founder of Collabforge, an innovative consultancy responsible for a number of cutting-edge digital government initiatives within Australia and abroad. These include the City of Melbourne's Future Melbourne, a multi award winning world-first ‘City plan that anyone can edit’, as well as wePlan Parks Victoria, which leverages social media for the first time to ‘Help guide the future of Victoria’s parks’, and the Southern California Bicycle & Pedestrian Planning Wiki, comprising a new approach to public involvement in transportation planning.
This document discusses open social mapping, which combines actor modeling, social network analysis, crowdsourcing, and customer relationship management tools to allow stakeholders to map themselves. This helps designers understand social systems from the perspectives of real stakeholders. Benefits include centering stakeholders, identifying disconnects, increasing understanding of diversity, and facilitating shared understanding between stakeholders. Challenges include maintaining participation, addressing privacy concerns, and ensuring interoperability between maps. Examples of open social mapping projects in Canada are provided.
The document discusses how data from the Internet of Things and citizen science can be used for public benefit. It outlines how data is being generated from more sources and in larger volumes, and how this data combined with artificial intelligence is fueling a new data economy. It also presents several approaches for how citizens can be engaged to help refine open government data through incentives and blockchain-based systems, moving from just consuming open data to co-creating and maintaining public services.
This document provides guidance on mapping civic tech and data ecosystems. It discusses choosing a purpose, scope, data collection methodology, and mapping software. The document also covers key steps like analyzing the ecosystem map to identify gaps, opportunities for collaboration, and areas for growth. The overall goal is to help groups strengthen relationships and identify shared priorities through the mapping process.
Smarter Water and Smarter Sustainable Dubuque | 2013 Loras College Business A...Cartegraph
Loras College is proud to present our annual Business Analytics Symposium on March 27, 2014 at the Grand River Center in Dubuque, IA. Industry experts will share their insights about the evolving field of business analytics opportunities. Learn about everything from best practices when analyzing data to the importance and benefits of building a culture of analytics within your organization.
To learn more, secure your seat or to take advantage of group discounts visit www.loras.edu/bigdata.
This toolkit provides the methodology for focusing the data-gathering power of existing communities, increasing their capacity to work together and building awareness of the potential of the data created by this work. It aims to help citizens identify and articulate their own problems using the supplementing data in their communities.
Similar to Crowdsourced planning nash_27mar2014.pptx (20)
Crowdsourcing is a powerful tool helping people participate in planning and operating transport systems. And participation helps build the shared visions needed to create strong community.
Describes how serious games can be used in transportation planning and operations. Presents examples and an organisational schema. Provides recommendations for developing games.
Transport e-Participation and Health.pptxAndrew Nash
The document discusses how civic participation and e-participation tools can promote healthier communities. It argues that local knowledge, community building, and making people happy through participation are important for generating better ideas and political support. E-participation allows people to report issues, collect and analyze data, collaborate, and take action. Examples of e-participation tools and applications that combine gamification, real-time transportation data, and social networking to encourage active transportation are provided. The summary emphasizes how technology has changed civic participation and that governments must embrace these changes.
BürgerInnenbeteiligung in der Smart CityAndrew Nash
Citizen participation in the smart city (presentation in German). IT applications are increasing the possibilities for city residents to provide input and become active in their cities. The presentation describes techniques and provides examples of interesting IT applications for participation.
Planning Wars - Planning lessons from liveable citiesAndrew Nash
Urban transport planning lessons from Vienna, Zurich, San Francisco, New York and cyberspace. Vienna: the importance of infrastructure. Zurich: the benefits of efficiency. San Francisco: don't be afraid of congestion. New York: planning needs political courage and brains. Cyberspace: information technology is revolutionising participation in city planning and service provision.
Social apps can help connect residents with transportation agencies to improve sustainable transportation. Such apps start simply by sharing information but can evolve to more advanced functions like crowd-sourced reporting, discussion, and collaborative action. Effective apps provide two-way communication between users and agencies and include back-end analytics to inform decision-making.
This document discusses using serious games to address transportation issues. It begins by explaining why games are popular and how gamification can be used in non-game contexts. It then outlines several types of transportation games that could be used to communicate information, encourage behavior change, and more. The rest of the document provides recommendations for game design, such as linking game mechanics to objectives and testing gameplay. It concludes by listing several example transportation games and referencing a case study on using online games.
Public Transport Efficiency: Zurich, Vienna and On-LineAndrew Nash
Andrew Nash presented on increasing public transport efficiency in Zurich, Vienna, and through online citizen engagement tools. Zurich takes a systematic approach to prioritizing public transport through dedicated lanes, coordinated schedules and ticketing. Vienna relies more on expansive underground rail and tram networks but faces challenges from increasing auto dependence. Online tools like games and forums aim to educate citizens and generate ideas, but challenges include attracting users and gaining agency support due to concerns about complaints.
Factors affecting undergraduate students’ motivation at a university in Tra VinhAJHSSR Journal
ABSTRACT: Motivation plays an important role in foreign language learning process. This study aimed to
investigate student’s motivation patterns towards English language learning at a University in Tra Vinh, and factors
affecting their motivation change toward English language learning of non-English-major students in the semester.
The researcher used semi-structured interview at the first phase of choosing the participants and writing reflection
through the instrument called “My English Learning Motivation History” adapted from Sawyer (2007) to collect
qualitative data within 15 weeks. The participants consisted of nine first year non-English-major students who learning
General English at pre-intermediate level. They were chosen and divided into three groups of three members each
(high motivation group; average motivation group; and low motivation group). The results of the present study
identified six visual motivation patterns of three groups of students with different motivation fluctuation, through the
use of cluster analysis. The study also indicated a diversity of factors affecting students’ motivation involving internal
factors as influencing factors (cognitive, psychology, and emotion) and external factors as social factors (instructor,
peers, family, and learning environment) during English language learning in a period of 15 weeks. The findings of
the study helped teacher understand relationship of motivation change and its influential factors. Furthermore, the
findings also inspired next research about motivation development in learning English process.
KEY WORDS: language learning motivation, motivation change, motivation patterns, influential factors, students’
motivation.
UR BHatti Academy dedicated to providing the finest IT courses training in the world. Under the guidance of experienced trainer Usman Rasheed Bhatti, we have established ourselves as a professional online training firm offering unparalleled courses in Pakistan. Our academy is a trailblazer in Dijkot, being the first institute to officially provide training to all students at their preferred schedules, led by real-world industry professionals and Google certified staff.
STUDY ON THE DEVELOPMENT STRATEGY OF HUZHOU TOURISMAJHSSR Journal
ABSTRACT: Huzhou has rich tourism resources, as early as a considerable development since the reform and
opening up, especially in recent years, Huzhou tourism has ushered in a new period of development
opportunities. At present, Huzhou tourism has become one of the most characteristic tourist cities on the East
China tourism line. With the development of Huzhou City, the tourism industry has been further improved, and
the tourism degree of the whole city has further increased the transformation and upgrading of the tourism
industry. However, the development of tourism in Huzhou City still lags far behind the tourism development of
major cities in East China. This round of research mainly analyzes the current development of tourism in
Huzhou City, on the basis of analyzing the specific situation, pointed out that the current development of
Huzhou tourism problems, and then analyzes these problems one by one, and put forward some specific
solutions, so as to promote the further rapid development of tourism in Huzhou City.
KEYWORDS:Huzhou; Travel; Development
The Impact of Work Stress and Digital Literacy on Employee Performance at PT ...AJHSSR Journal
ABSTRACT :This research aims to analyze the correlation between employee work stress and digital literacy
with employee performance at PT Telkom Akses Area Cirebon, both concurrently and partially. Employing a
quantitative approach, the study's objectives are descriptive and causal, adopting a positivist paradigm with a
deductive approach to theory development and a survey research strategy. Findings reveal that work stress
negatively and significantly impacts employee performance, while digital literacy positively and significantly
affects it. Simultaneously, work stress and digital literacy have a positive and significant influence on employee
performance. It is anticipated that company management will devise workload management strategies to
alleviate work stress and assess the implementation of more efficient digital technology to enhance employee
performance.
KEYWORDS -digital literacy, employee performance,job stress, multiple regression analysis, workload
management
2. Outline
1. Public
involvement
and
planning.
2. What
are
interac(ve
city
tools
anyway?
3. A
structure
for
understanding.
4. Examples.
5. Summary
and
QuesLons.
4. Big
Problems
+
Limited
Resources
• Climate
change
• Socio-‐economic
change
• Demographic
change
• Urban
growth
• Financial
crisis
Ci(es
cannot
solve
today’s
difficult
problems
without
help
from
their
residents.
5. How
does
public
involvement
help?
• Generates
beSer
ideas
Detailed
local
knowledge
&
fresh
perspec5ve
• Provides
poliLcal
support
Especially
important
for
tough
decisions
• Creates
commiSed
residents
People
willing
to
ac5vely
help
10. Interac(ve
city
tools
ApplicaLons
and
technologies
that
help
people
work
together
to
increase
city
livability,
economic
well-‐being
and
sustainability.
15. Open
Data
(by
Government)
Sensor
Data
(by
public)
EducaSonal
Apps
Public
Discussion
Apps
AcSons
AcSviSes
Services
Plans
InformaSon
Status
Updates
BeBer
MeeSng
Apps
CollaboraSon
VisualizaSon
Analysis
AccounSng
Develop
New
Apps
Input
Analysis
CollaboraSon
Output
Public
ReporSng
Apps
Support
Real
RelaSonship
Apps
16. The
public
role:
A. Provide
input
B. Analyze
data
C. Collaborate
in
planning
D. Support
decision-‐making
E. Take
acLon
Input
Analysis
CollaboraLon
Output
Support
17. These
are
the
same
acLviLes
ciLzens
have
always
performed
…
But
today’s
informaLon
technology
has
vastly
expanded
the
ability
of
ciLzens
to
get
involved:
-‐
more
people
-‐
more
detail
26. Traffic
Check
hBp://www.trafficcheck.at/
User
friendly
features
needed
for
mobile
phone
reporLng:
• automaLc
geo
locaLon,
• logical
informaLon
flow,
• check
boxes
for
data
entry.
27.
28. A
key
part
of
customized
reporLng
apps
are
back-‐end
analysis
and
tracking
systems.
Verbeterdebuurt,
Netherlands
hBp://www.verbeterdebuurt.nl/
34. • City
data
–
open
data
streams
or
scraped.
• CiLzen
collected
data
–
cheap
sensors.
Government
no
longer
has
a
monopoly
on
data
and
informa(on.
B.
Data
Analysis
36. Now
…
a
word
from
our
sponsors:
Please
open
your
city
data
This
means
providing
easy
access
to
• real
data
(not
PDFs)
• via
applicaSon
programming
interfaces
(APIs)
• using
standard
formats
(e.g.
GTFS).
See:
Open
Knowledge
FoundaSon
for
more
informaSon
about
open
data:
hBp://okfn.org/
37. CiLzen
collected
data
It’s
easier
then
ever
for
ciSzens
to
collect
data
• Inexpensive
sensors
• Scraping
public
data
sites
Open
your
data
so
ciSzens
do
not
need
to
scrape
your
sites
…
let
them
create
applicaSons
for
you
…
this
will
save
you
money
and
increase
creaSvity!
60. E.
AcLon
• InformaLon
–
e.g.
transit
informaSon
• Real
acLviLes
– Clean-‐up
days
– P2P
ridesharing
–
Sharing
Culture
– Casserole
–
shared
meals
and
socializaLon
• Crowd-‐sourced
civic
works
If
you
don’t
do
it
someone
else
will
…
(not
necessarily
bad).
68. 5.
Summary
and
QuesLons
1. We
need
more
and
beSer
involvement
to
solve
today’s
serious
problems.
2. Input
is
more
than
words
and
talk.
3. New
technology
=
more
involvement:
…
in
all
aspects
of
planning.
4. Please
open
your
data.
5. If
you
don’t
do
it
…
someone
else
will.
69. Andrew
Nash
helps
clients
develop
social
media,
serious
games
and
crowd
sourcing
applicaSons
designed
to
improve
ciSes
and
transport
systems.
His
current
projects
include
Grr-‐Grr-‐Bike
(www.grr-‐grr-‐bike.com),
a
smart
phone
game
designed
to
encourage
people
to
get
involved
in
urban
bicycle
planning
and
advocacy,
and
www.GreenCityStreets.com,
a
project
that
uses
a
serious
game
and
a
wiki-‐based
best
pracSces
website
to
educate
people
about
public
transport
operaSons
and
a
Facebook-‐
based
crowdsourcing
plahorm.
You
can
reach
him
at:
andy@andynash.com
70. Crowd-‐sourced
Planning
Using interactive city tools to
improve public involvement
Andrew
Nash
andy@andynash.com
www.andynash.com
+43
676
933-‐0483
Vienna,
Austria
71. References
• Nash,
Andrew;
A
Proposed
Structure
for
Understanding
InteracSve
City
Tools;
May
2013,
hBp://andynash.com/publicaSons/
• “InteracSve
City
Tool”
from
Play
the
City
hBp://www.playthecity.nl/
• Code
for
America
(CfA)
hBp://codeforamerica.org/
• OpenPlans
hBp://openplans.org
• Open
Knowledge
FoundaSon
hBp://okfn.org/
• GovLab
Open
Governance
WIKI
hBp://thegovlab.org/wiki/Main_Page
ReporLng
ApplicaLons
• Seeclickfix
hBp://seeclickfix.org
• Fix
My
Transport
hBp://www.fixmytransport.com
• CiSzens
Connect
hBp://www.cityososton.gov/doit/apps/ciSzensconnect.asp
• Traffic
Check
hBp://www.trafficcheck.at/
• Verbeterdebuurt,
Netherlands
hBp://www.verbeterdebuurt.nl/
72. References
-‐
2
GPS
Data
ReporLng
ApplicaLons
• CycleTracks,
San
Francisco
–
GPS
data
collecSon
system
for
bicycling:
hBp://www.sfcta.org/modeling-‐and-‐travel-‐forecasSng/
• Meine
Radspur,
Vienna
hBp://www.meineradspur.at/
• StreetBump,
Boston
hBp://streetbump.org
• Waze
roadway
GPS
data
collecSon
www.waze.com
• Moovit
public
transport
GPS
reporSng
app:
www.moovitapp.com
CiLzen
Collected
Data
• WayCount
traffic
counter:
hBp://trafficcom.org
• Air
Quality
Egg:
hBp://airqualityegg.com
• Cosm
sensor
data
sharing
plahorm
hBps://cosm.com/
• Seeplan
–
project
by
Even
Westvang
from
Bengler
–
hBp://bengler.no/seeplan
73. References
-‐
3
CollaboraLon
ApplicaLons
• MindMixer
www.mindmixer.com
• Shareabouts
hBp://shareabouts.org
• GreenCityStreets.com
www.greencitystreets.com
• Loomio
–
crowd
sourced
decision
making
www.loomio.org
• Bogotá
–
My
ideal
city
hBp://www.miciudadideal.com/en/ciSzen_sourced
CiLzen
Collected
Data
• WayCount
traffic
counter:
hBp://trafficcom.org
• Air
Quality
Egg:
hBp://airqualityegg.com
• Cosm
sensor
data
sharing
plahorm
hBps://cosm.com/
74. References
-‐
4
Support
and
EducaLon
• Community
Planit
hBp://communityplanit.org
• BusMeister
Game
hBp://www.greencitystreets.com
• ParScipatory
Chinatown
hBp://www.parScipatorychinatown.org/
• Streetmix.net
hBp://streetmix.net
• Grr-‐Grr-‐Bike
engagement
game
hBp://www.grr-‐grr-‐bike.com
• Designing
Chicago
hBp://designingchicago.com/
• Plan
in
a
Box
hBp://planinabox.org/
• Simpl
Challenge
hBp://www.simpl.co/howitworks
Taking
AcLon
• Everyday
Growing
Cultures
hBp://everydaygrowingcultures.org
• 596
Acres
–
New
York
hBp://596acres.org/
• Ciclos
Rotas
Centro
–
Rio
de
Janeiro
hBp://events.gsapp.org/event/ciclo-‐rotas-‐centro-‐0
• Networks
of
Dispossession
–
Turkey
hBp://mulksuzlesSrme.org/index_en.html