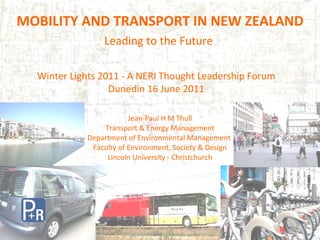
This document summarizes the current state of mobility and transport in New Zealand. It discusses facts about New Zealand's population and transportation network. It also examines sustainability issues and challenges facing New Zealand's transport sector, including heavy reliance on private vehicles, lack of public transportation infrastructure and culture, and impacts of natural disasters like earthquakes. The document proposes strategies to improve sustainability, such as increasing density near public transit corridors, investing in light rail, and changing policies and incentives to reduce vehicle use.
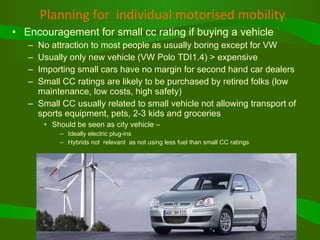
Transport Modes & Strategies for Sustainable Mobility in NZ
1.
2.
3.
4.
5.
6.
7. Main areas of post-earthquake office & business relocations result into major transport challenges Source: NZTA March 2011business relocation survey Photographs by A. Hansbury
Travel dominated by private and company cars – companies often supply their vehicles to workers to compensate for longer distances travelled to new business locations Orbital movements replace the radial pattern – business have moved out of the central city to outer suburbs. Workers travel between suburbs rather than from suburbs to central city. With CBD cordoned off and inaccessible many through routes are not available Roads not designed for increased activity – with so many key arterial roads damaged, out of action or narrowed down to one/two lanes, other local roads had to take over. They are not designed for it. The result is severe congestion. Longer distances travelled Extended travel times – longer routes and congestion Severe congestion and delays (roads not suitable for the amount of traffic, more people have been pushed onto the few available roads, traffic signals are not set appropriately) Bus services disjointed or cut – radial movements upset, no bus exchange, routes cannot run through the CBD and run to the four avenues, bus stock reduced through earthquake damage ALL THIS ADDS TO INCREASED PETROL CONSUMPTION AND POLLUTION
Strategic direction for the next 35 years: 71% of growth in Christchurch, 16% Selwyn, 13% Waimakariri Metropolitan Urban Limit Specific targets for households numbers Specified greenfield growth areas Integrating development with commercial, cultural, employment areas and transport networks Increase densities along main transport corridors