Downloaded 29 times

![Questions? Contact Information [email_address] [email_address]](https://image.slidesharecdn.com/newnpta2011nftarev1-110608135757-phpapp02/85/NFTA-Metro-Route-Restructuring-48-320.jpg)

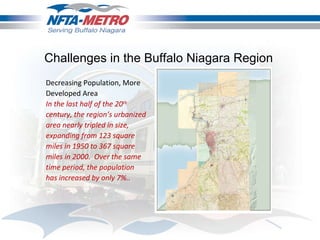
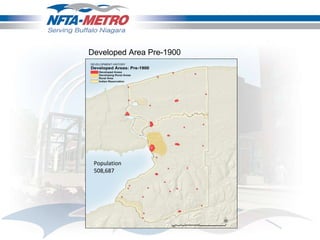
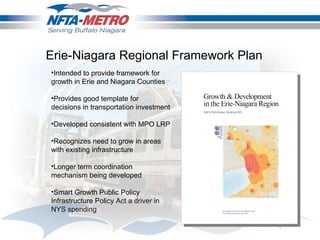
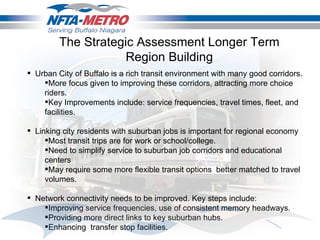
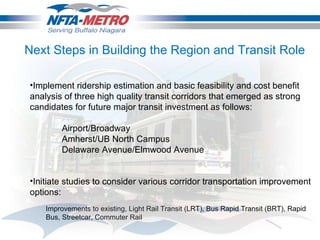
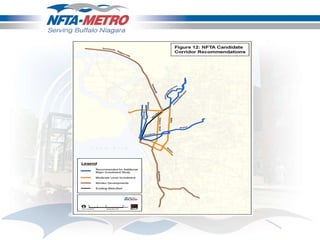
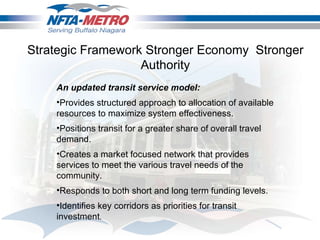
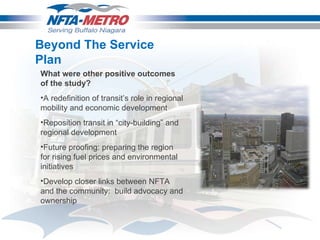
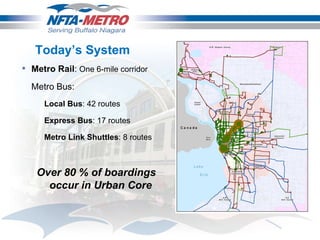
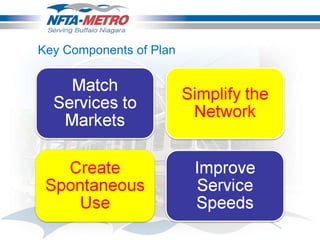
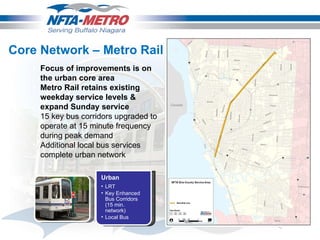
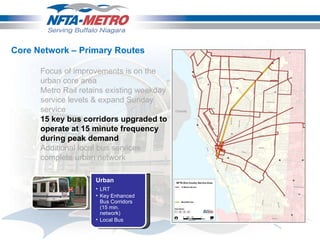
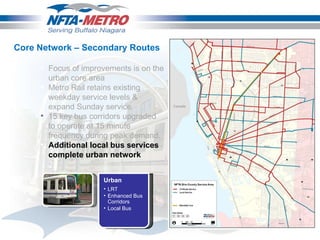
The document outlines transit restructuring efforts in the Buffalo Niagara region, highlighting the challenges of a declining population and the need for improved transportation infrastructure and services. It discusses various strategies to enhance transit connectivity and efficiency, including prioritizing key corridors and improving service frequencies to better link urban and suburban areas. The study reflects on community feedback, operational changes implemented, and the impact on ridership and productivity, emphasizing the importance of aligning transit policies with regional growth and economic development goals.


