Download as PDF, PPTX

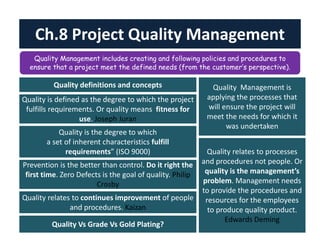
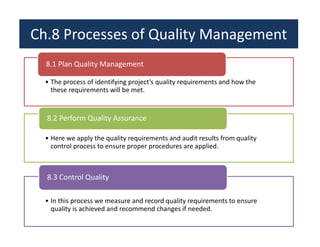
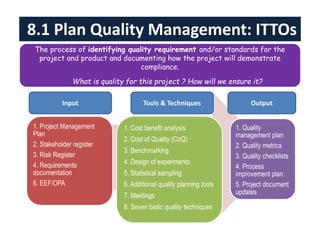
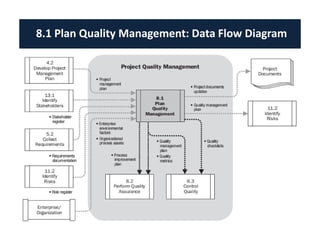

The document discusses project quality management as outlined in Chapter 8 of the PMBOK Guide 5th Edition. It covers key quality definitions and concepts, the three main processes (plan quality management, perform quality assurance, control quality), and various tools and techniques used in each process. The goal of quality management is to ensure the project meets requirements by establishing quality policies, standards, and procedures, and then measuring compliance through audits, reviews and testing.


