Download as PDF, PPTX


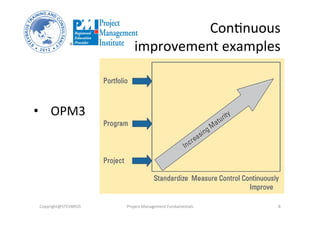


This document provides an overview of project quality management. It discusses key concepts like quality vs grade, precision vs accuracy, and continuous improvement models. Quality management involves planning quality, performing quality assurance, and controlling quality. The goal is to meet requirements and prevent issues rather than inspecting for them. Management is responsible for providing resources to support quality initiatives. Continuous improvement approaches like OPM3, Malcolm Baldrige, and CMMI can be used to improve both project management and deliverables.


