Weekly technical analysis of Nepse Apr 13 to Apr 18. 2014
•
0 likes•196 views

Nepal Stock Exchange (Nepse) Index Analysis for April 13 to April 18, 2014

Recommended
Recommended
More Related Content
What's hot
What's hot (14)
Viewers also liked
Viewers also liked (8)
Similar to Weekly technical analysis of Nepse Apr 13 to Apr 18. 2014
Similar to Weekly technical analysis of Nepse Apr 13 to Apr 18. 2014 (20)
More from Kriti Capital & Investments Ltd.
More from Kriti Capital & Investments Ltd. (20)
Recently uploaded
Recently uploaded (20)
Weekly technical analysis of Nepse Apr 13 to Apr 18. 2014
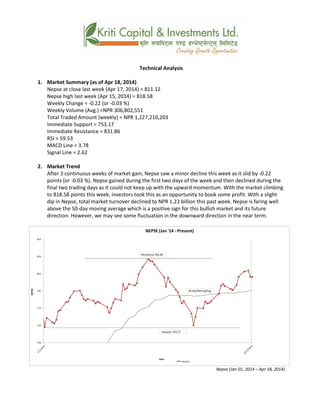
- 1. Technical Analysis 1. Market Summary (as of Apr 18, 2014) Nepse at close last week (Apr 17, 2014) = 811.12 Nepse high last week (Apr 15, 2014) = 818.58 Weekly Change = -0.22 (or -0.03 %) Weekly Volume (Avg.) =NPR 306,802,551 Total Traded Amount (weekly) = NPR 1,227,210,203 Immediate Support = 753.17 Immediate Resistance = 831.86 RSI = 59.53 MACD Line = 3.78 Signal Line = 2.62 2. Market Trend After 3 continuous weeks of market gain, Nepse saw a minor decline this week as it slid by -0.22 points (or -0.03 %). Nepse gained during the first two days of the week and then declined during the final two trading days as it could not keep up with the upward momentum. With the market climbing to 818.58 points this week, investors took this as an opportunity to book some profit. With a slight dip in Nepse, total market turnover declined to NPR 1.23 billion this past week. Nepse is faring well above the 50-day moving average which is a positive sign for this bullish market and its future direction. However, we may see some fluctuation in the downward direction in the near term. Nepse (Jan 01, 2014 – Apr 18, 2014) 735 755 775 795 815 835 855 NEPSE Date NEPSE (Jan '14 - Present) Series1 Resistance:831.86 Support:753.17 50-dayMovingAvg
- 2. 3. RSI RSI is a form of leading indicator that is believed to be most effective during periods of sideways movement. Such indicators may create numerous buy and sell signals that are useful when the market is not clearly trending upwards or downwards. The RSI that ended at 62.50 levels in the previous week fell by 2.97 points to end at 59.53 levels this week. With demand for stocks being relatively stable this past week, the RSI has been maintaining well within the neutral zone. RSI (Jan 01, 2013 – Apr 18, 2014) 4. MACD The MACD is a momentum oscillator formed by using two different types of moving averages, which provides specific buying or selling signals. When a MACD line crosses above the signal line, it is considered to be a positive sign and indicates a time to buy, and vice-versa. This oscillator still indicates a positive bullish trend as the MACD line and Signal line are both keeping up with the upward momentum. However, the decreasing divergence indicates that the market may see some minor decline in the near term. MACD (Jan 01, 2013 – Apr 18, 2014) 5. Bollinger Band The Bollinger Band is a technical indicator that consists of a moving average (21-day) along with two trading bands above (upper band) and below it (lower band). The bands are an indication of volatility, which are represented by calculating standard deviation. This past week saw the Nepse index slightly touch the upper band which indicated a near overbought scenario after which there was a minor decline. With the volume also decreasing during the same time frame, this has indicated that the demand for stocks has been decreasing in the last few trading days.
- 3. Bollinger Bands (Nov 01, 2013 – Apr 18, 2014) Overview: The stock market fell slightly this past week declining by -0.22 points (or -0.03 %). After 3 continuous weeks of upward trend, Nepse could not sustain the ongoing rally as the average market volume dropped to NPR 30.7 crores from NPR 34.8 crores. The RSI fell by a meager 2.97 points and maintained within the neutral zone, as relatively stable demand could not prop up the market. The MACD line and the Signal line both indicate a fairly stable market and the momentum is in the upward direction. The Bollinger Bands represent a slightly overbought scenario in the near term. Overall, the market remains bullish in the long term; however, there may be minor corrections in between.