Downloaded 1,238 times
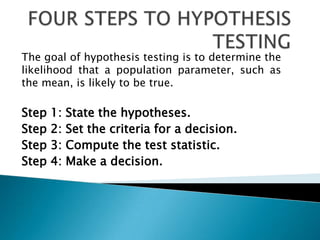

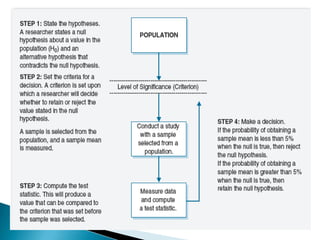
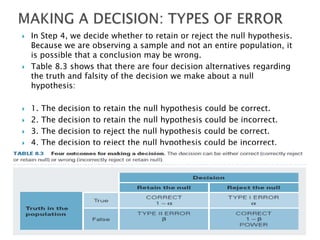

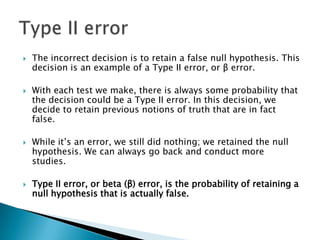

Hypothesis testing involves 4 steps: 1) stating the null and alternative hypotheses, 2) setting the significance level criteria, 3) computing a test statistic to evaluate the hypotheses, and 4) making a decision to either reject or fail to reject the null hypothesis based on the significance level and test statistic. The goal is to correctly identify true null hypotheses while minimizing errors like falsely rejecting a true null hypothesis (Type I error) or retaining a false null hypothesis (Type II error).


