PPT-2
Reject null
hypothesis!
Sample meanis
only 45!
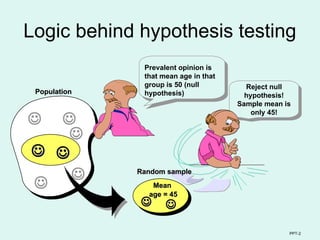
Population
Population
Prevalent opinion is
that mean age in that
group is 50 (null
hypothesis)
Mean
Mean
age
age = 45
= 45
Random sample
Random sample
Logic behind hypothesis testing
3.
PPT-3
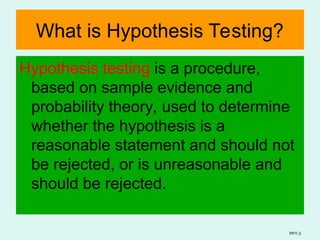
What is HypothesisTesting?
Hypothesis testing is a procedure,
based on sample evidence and
probability theory, used to determine
whether the hypothesis is a
reasonable statement and should not
be rejected, or is unreasonable and
should be rejected.
4.
PPT-4
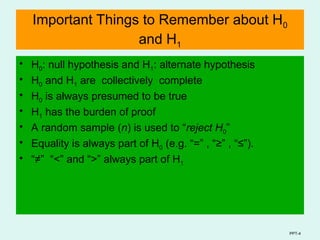
Important Things toRemember about H0
and H1
• H0: null hypothesis and H1: alternate hypothesis
• H0 and H1 are collectively complete
• H0 is always presumed to be true
• H1 has the burden of proof
• A random sample (n) is used to “reject H0”
• Equality is always part of H0 (e.g. “=” , “≥” , “≤”).
• “≠” “<” and “>” always part of H1
5.
PPT-5
Important Things toRemember about H0
and H1
• H0: null hypothesis and H1: alternate hypothesis
• H0 and H1 are collectively complete
• H0 is always presumed to be true
• H1 has the burden of proof
• A random sample (n) is used to “reject H0”
• Equality is always part of H0 (e.g. “=” , “≥” , “≤”).
• “≠” “<” and “>” always part of H1
6.
PPT-6
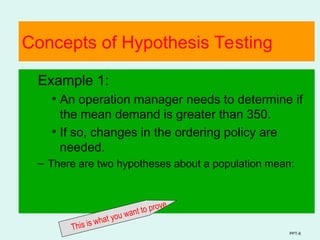
Concepts of HypothesisTesting
Example 1:
• An operation manager needs to determine if
the mean demand is greater than 350.
• If so, changes in the ordering policy are
needed.
– There are two hypotheses about a population mean:
This is what you want to prove
7.
PPT-7
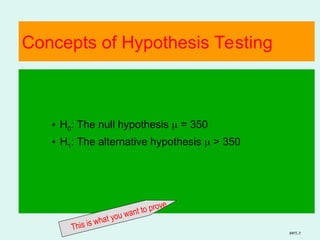
Concepts of HypothesisTesting
• H0: The null hypothesis = 350
• H1: The alternative hypothesis > 350
This is what you want to prove
8.
PPT-8
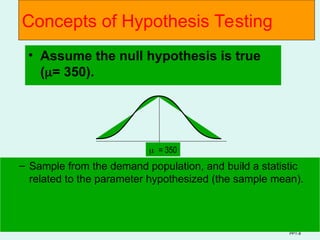
Concepts of HypothesisTesting
= 350
• Assume the null hypothesis is true
(= 350).
– Sample from the demand population, and build a statistic
related to the parameter hypothesized (the sample mean).
9.
PPT-9
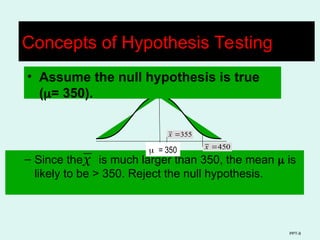
– Since theis much larger than 350, the mean is
likely to be > 350. Reject the null hypothesis.
x
355
x
Concepts of Hypothesis Testing
= 350
• Assume the null hypothesis is true
(= 350).
450
x
10.
PPT-10
Important Things toRemember about H0
and H1
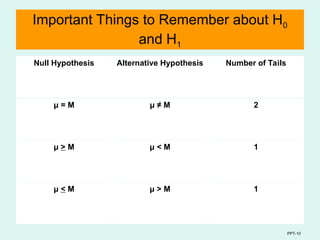
Null Hypothesis Alternative Hypothesis Number of Tails
μ = M μ ≠ M 2
μ > M μ < M 1
μ < M μ > M 1
11.
PPT-11
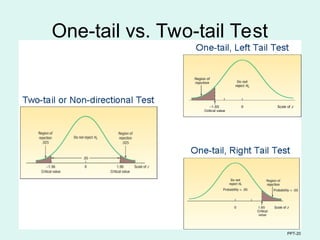
Two Tailed Test
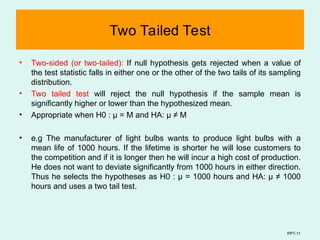
•Two-sided (or two-tailed): If null hypothesis gets rejected when a value of
the test statistic falls in either one or the other of the two tails of its sampling
distribution.
• Two tailed test will reject the null hypothesis if the sample mean is
significantly higher or lower than the hypothesized mean.
• Appropriate when H0 : µ = M and HA: µ ≠ M
• e.g The manufacturer of light bulbs wants to produce light bulbs with a
mean life of 1000 hours. If the lifetime is shorter he will lose customers to
the competition and if it is longer then he will incur a high cost of production.
He does not want to deviate significantly from 1000 hours in either direction.
Thus he selects the hypotheses as H0 : µ = 1000 hours and HA: µ ≠ 1000
hours and uses a two tail test.
12.
PPT-12
One Tailed Test
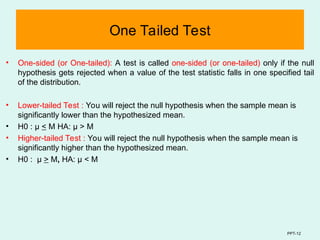
•One-sided (or One-tailed): A test is called one-sided (or one-tailed) only if the null
hypothesis gets rejected when a value of the test statistic falls in one specified tail
of the distribution.
• Lower-tailed Test : You will reject the null hypothesis when the sample mean is
significantly lower than the hypothesized mean.
• H0 : μ < M HA: μ > M
• Higher-tailed Test : You will reject the null hypothesis when the sample mean is
significantly higher than the hypothesized mean.
• H0 : μ > M, HA: µ < M
13.
PPT-13
Example
• A wholesalerbuys light bulbs from the manufacturer in large lots and decides not to
accept a lot with capacity not less than 1000 hours.
• A highway safety engineer decides to test the load bearing capacity of a 20 year old
bridge. The minimum load-bearing capacity of the bridge must be less than 10 tons.
14.
PPT-14
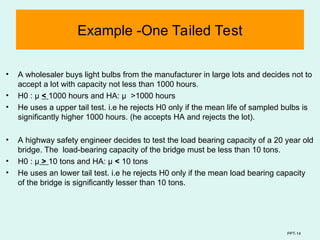
Example -One TailedTest
• A wholesaler buys light bulbs from the manufacturer in large lots and decides not to
accept a lot with capacity not less than 1000 hours.
• H0 : µ < 1000 hours and HA: µ >1000 hours
• He uses a upper tail test. i.e he rejects H0 only if the mean life of sampled bulbs is
significantly higher 1000 hours. (he accepts HA and rejects the lot).
• A highway safety engineer decides to test the load bearing capacity of a 20 year old
bridge. The load-bearing capacity of the bridge must be less than 10 tons.
• H0 : µ > 10 tons and HA: µ < 10 tons
• He uses an lower tail test. i.e he rejects H0 only if the mean load bearing capacity
of the bridge is significantly lesser than 10 tons.
15.
PPT-15
Population
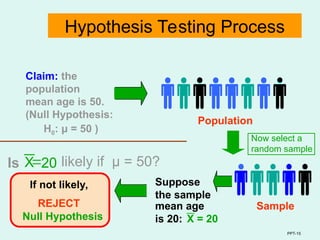
Claim: the
population
mean ageis 50.
(Null Hypothesis:
REJECT
Suppose
the sample
mean age
is 20: X = 20
Sample
Null Hypothesis
20 likely if μ = 50?
Is
Hypothesis Testing Process
If not likely,
Now select a
random sample
H0: μ = 50 )
X
16.
PPT-16
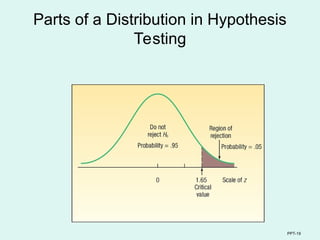
Do not rejectH0 Reject H0
Reject H0
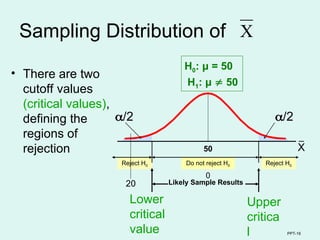
• There are two
cutoff values
(critical values),
defining the
regions of
rejection
Sampling Distribution of X
/2
0
H0: μ = 50
H1: μ 50
/2
Lower
critical
value
Upper
critica
l
50 X
20 Likely Sample Results
17.
PPT-17
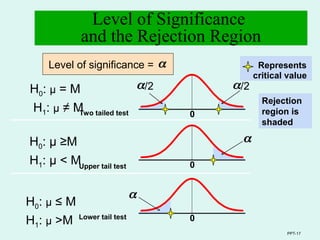
Level of Significance
andthe Rejection Region
H0: μ ≥M
H1: μ < M
0
Represents
critical value
Lower tail test
Level of significance =
0
Upper tail test
Two tailed test
Rejection
region is
shaded
/2
0
/2
H0: μ = M
H1: μ ≠ M
H0: μ ≤ M
H1: μ >M
18.
PPT-18
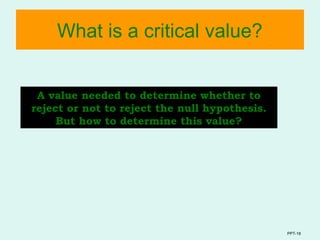
What is acritical value?
A value needed to determine whether to
reject or not to reject the null hypothesis.
But how to determine this value?
PPT-21
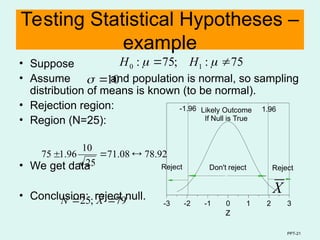
Testing Statistical Hypotheses–
example
• Suppose
• Assume and population is normal, so sampling
distribution of means is known (to be normal).
• Rejection region:
• Region (N=25):
• We get data
• Conclusion: reject null.
75
:
;
75
: 1
0
H
H
10
3
2
1
0
-1
-2
-3
Z
Z
Z
1.96
-1.96
Don't reject Reject
Reject
Likely Outcome
If Null is True
79
;
25
X
N
92
.
78
08
.
71
25
10
96
.
1
75
X
22.
PPT-22
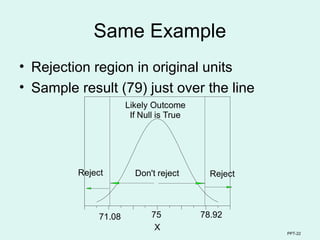
Same Example
• Rejectionregion in original units
• Sample result (79) just over the line
X
78.92
71.08
Don't reject Reject
Reject
Likely Outcome
If Null is True
75
PPT-24
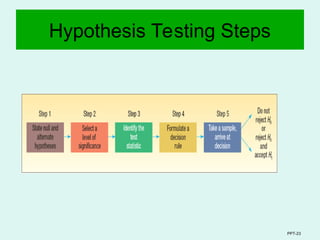
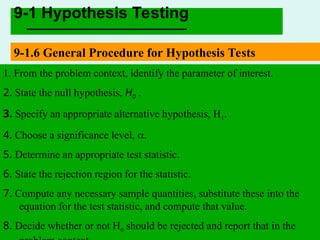
9-1 Hypothesis Testing
9-1.6General Procedure for Hypothesis Tests
1. From the problem context, identify the parameter of interest.
2. State the null hypothesis, H0 .
3. Specify an appropriate alternative hypothesis, H1.
4. Choose a significance level, .
5. Determine an appropriate test statistic.
6. State the rejection region for the statistic.
7. Compute any necessary sample quantities, substitute these into the
equation for the test statistic, and compute that value.
8. Decide whether or not H0 should be rejected and report that in the
25.
PPT-25
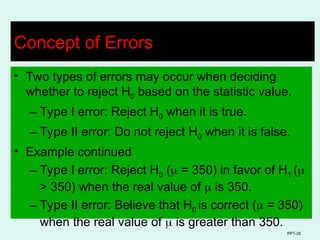
Concept of Errors
•Two types of errors may occur when deciding
whether to reject H0 based on the statistic value.
– Type I error: Reject H0 when it is true.
– Type II error: Do not reject H0 when it is false.
• Example continued
– Type I error: Reject H0 ( = 350) in favor of H1 (
> 350) when the real value of is 350.
– Type II error: Believe that H0 is correct ( = 350)
when the real value of is greater than 350.
26.
PPT-26
Errors in HypothesisTesting &
Level of Significance
Actual Situation (Truth)
The Person Is Not
Guilty
The Person Is Guilty
Court’s
Decisio
n
The person is not
guilty.
Correct decision(1-
α)
Type II Error(β)
[Incorrect decision]
The person is guilty Type I Error(α)
[In correct decision]
Correct decision (1-β)
27.
PPT-27
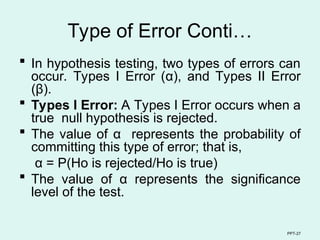
Type of ErrorConti…
In hypothesis testing, two types of errors can
occur. Types I Error (α), and Types II Error
(β).
Types I Error: A Types I Error occurs when a
true null hypothesis is rejected.
The value of α represents the probability of
committing this type of error; that is,
α = P(Ho is rejected/Ho is true)
The value of α represents the significance
level of the test.
28.
PPT-28
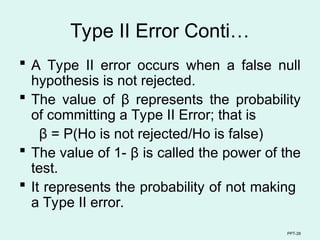
Type II ErrorConti…
A Type II error occurs when a false null
hypothesis is not rejected.
The value of β represents the probability
of committing a Type II Error; that is
β = P(Ho is not rejected/Ho is false)
The value of 1- β is called the power of the
test.
It represents the probability of not making
a Type II error.
29.
PPT-29
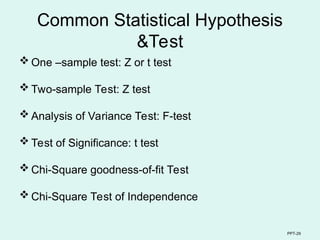
Common Statistical Hypothesis
&Test
One –sample test: Z or t test
Two-sample Test: Z test
Analysis of Variance Test: F-test
Test of Significance: t test
Chi-Square goodness-of-fit Test
Chi-Square Test of Independence
30.
PPT-30
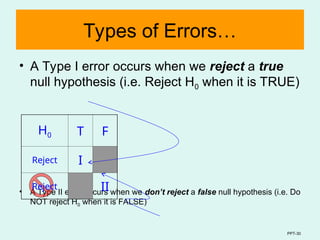
Types of Errors…
•A Type I error occurs when we reject a true
null hypothesis (i.e. Reject H0 when it is TRUE)
• A Type II error occurs when we don’t reject a false null hypothesis (i.e. Do
NOT reject H0 when it is FALSE)
H0 T F
Reject I
Reject II
31.
PPT-31
Testing for aPopulation Mean with a
Known Population Standard Deviation-
Example
Jamestown Steel Company
manufactures and assembles
desks and other office equipment
at several plants in western New
York State. The weekly production
of the Model A325 desk at the
Fredonia Plant follows the normal
probability distribution with a mean
of 200 and a standard deviation
of 16. Recently, because of
market expansion, new production
methods have been introduced
and new employees hired. The
vice president of manufacturing
would like to investigate whether
there has been a change in the
weekly production of the Model
A325 desk.
32.
PPT-32
Testing for aPopulation Mean with a
Known Population Standard Deviation-
Example
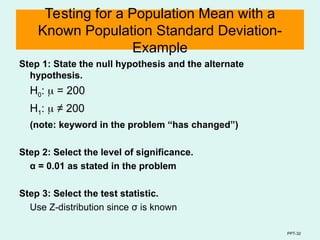
Step 1: State the null hypothesis and the alternate
hypothesis.
H0: = 200
H1: ≠ 200
(note: keyword in the problem “has changed”)
Step 2: Select the level of significance.
α = 0.01 as stated in the problem
Step 3: Select the test statistic.
Use Z-distribution since σ is known
33.
PPT-33
Testing for aPopulation Mean with a
Known Population Standard Deviation-
Example
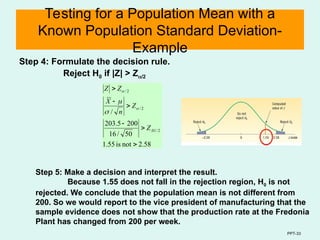
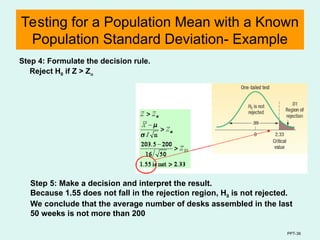
Step 4: Formulate the decision rule.
Reject H0 if |Z| > Z/2
58
.
2
not
is
55
.
1
50
/
16
200
5
.
203
/
2
/
01
.
2
/
2
/
Z
Z
n
X
Z
Z
Step 5: Make a decision and interpret the result.
Because 1.55 does not fall in the rejection region, H0 is not
rejected. We conclude that the population mean is not different from
200. So we would report to the vice president of manufacturing that the
sample evidence does not show that the production rate at the Fredonia
Plant has changed from 200 per week.
34.
PPT-34
Testing for aPopulation Mean with a Known
Population Standard Deviation- Another Example
Suppose in the previous problem the vice
president wants to know whether there has
been an increase in the number of units
assembled. To put it another way, can we
conclude, because of the improved
production methods, that the mean number
of desks assembled in the last 50 weeks
was more than 200?
Recall: σ=16, n=200, α=.01
35.
PPT-35
Testing for aPopulation Mean with a Known
Population Standard Deviation- Example
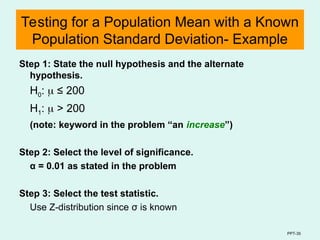
Step 1: State the null hypothesis and the alternate
hypothesis.
H0: ≤ 200
H1: > 200
(note: keyword in the problem “an increase”)
Step 2: Select the level of significance.
α = 0.01 as stated in the problem
Step 3: Select the test statistic.
Use Z-distribution since σ is known
36.
PPT-36
Testing for aPopulation Mean with a Known
Population Standard Deviation- Example
Step 4: Formulate the decision rule.
Reject H0 if Z > Z
Step 5: Make a decision and interpret the result.
Because 1.55 does not fall in the rejection region, H0 is not rejected.
We conclude that the average number of desks assembled in the last
50 weeks is not more than 200
37.
PPT-37
9-2 Tests onthe Mean of a Normal
Distribution, Variance Known
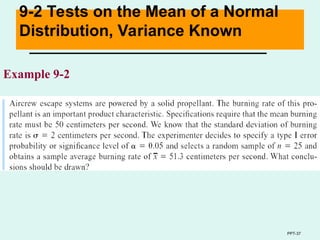
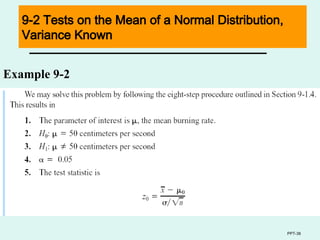
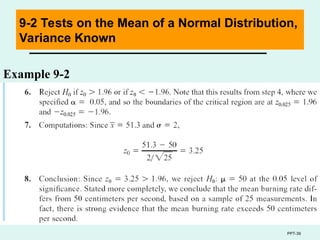
Example 9-2
38.
PPT-38
9-2 Tests onthe Mean of a Normal Distribution,
Variance Known
Example 9-2
39.
PPT-39
9-2 Tests onthe Mean of a Normal Distribution,
Variance Known
Example 9-2
40.
PPT-40
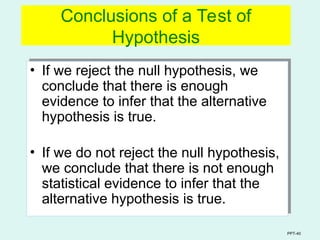
Conclusions of aTest of
Hypothesis
• If we reject the null hypothesis, we
conclude that there is enough
evidence to infer that the alternative
hypothesis is true.
• If we do not reject the null hypothesis,
we conclude that there is not enough
statistical evidence to infer that the
alternative hypothesis is true.
41.
PPT-41
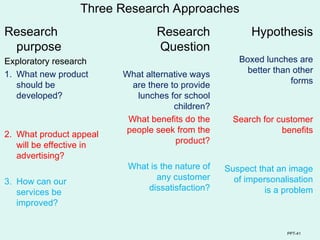
Three Research Approaches
Research
purpose
Exploratoryresearch
1. What new product
should be
developed?
2. What product appeal
will be effective in
advertising?
3. How can our
services be
improved?
Research
Question
What alternative ways
are there to provide
lunches for school
children?
What benefits do the
people seek from the
product?
What is the nature of
any customer
dissatisfaction?
Hypothesis
Boxed lunches are
better than other
forms
Search for customer
benefits
Suspect that an image
of impersonalisation
is a problem
42.
PPT-42
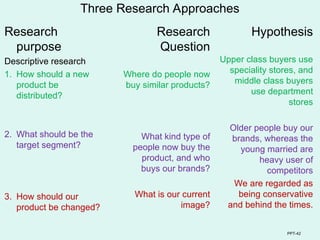
Three Research Approaches
Research
purpose
Descriptiveresearch
1. How should a new
product be
distributed?
2. What should be the
target segment?
3. How should our
product be changed?
Research
Question
Where do people now
buy similar products?
What kind type of
people now buy the
product, and who
buys our brands?
What is our current
image?
Hypothesis
Upper class buyers use
speciality stores, and
middle class buyers
use department
stores
Older people buy our
brands, whereas the
young married are
heavy user of
competitors
We are regarded as
being conservative
and behind the times.
43.
PPT-43
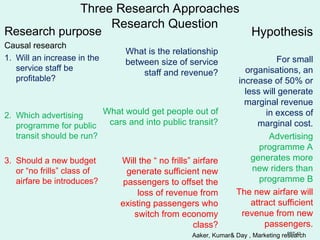
Three Research Approaches
Researchpurpose
Causal research
1. Will an increase in the
service staff be
profitable?
2. Which advertising
programme for public
transit should be run?
3. Should a new budget
or “no frills” class of
airfare be introduces?
Research Question
What is the relationship
between size of service
staff and revenue?
What would get people out of
cars and into public transit?
Will the “ no frills” airfare
generate sufficient new
passengers to offset the
loss of revenue from
existing passengers who
switch from economy
class?
Hypothesis
For small
organisations, an
increase of 50% or
less will generate
marginal revenue
in excess of
marginal cost.
Advertising
programme A
generates more
new riders than
programme B
The new airfare will
attract sufficient
revenue from new
passengers.
Aaker, Kumar& Day , Marketing research
#9 But how to determine whether to reject or not to reject objectively?
We need a value called critical value to be compared to the sample mean obtained.
But, before that, we need to understand the concept of error in testing.

![PPT-26
Errors in Hypothesis Testing &
Level of Significance
Actual Situation (Truth)
The Person Is Not
Guilty
The Person Is Guilty
Court’s
Decisio
n
The person is not
guilty.
Correct decision(1-
α)
Type II Error(β)
[Incorrect decision]
The person is guilty Type I Error(α)
[In correct decision]
Correct decision (1-β)](https://image.slidesharecdn.com/hypothesistesting-250331124741-b5cb1ecc/85/Introduction-of-Hypothesis-Testing-ppt-26-320.jpg)