Downloaded 222 times
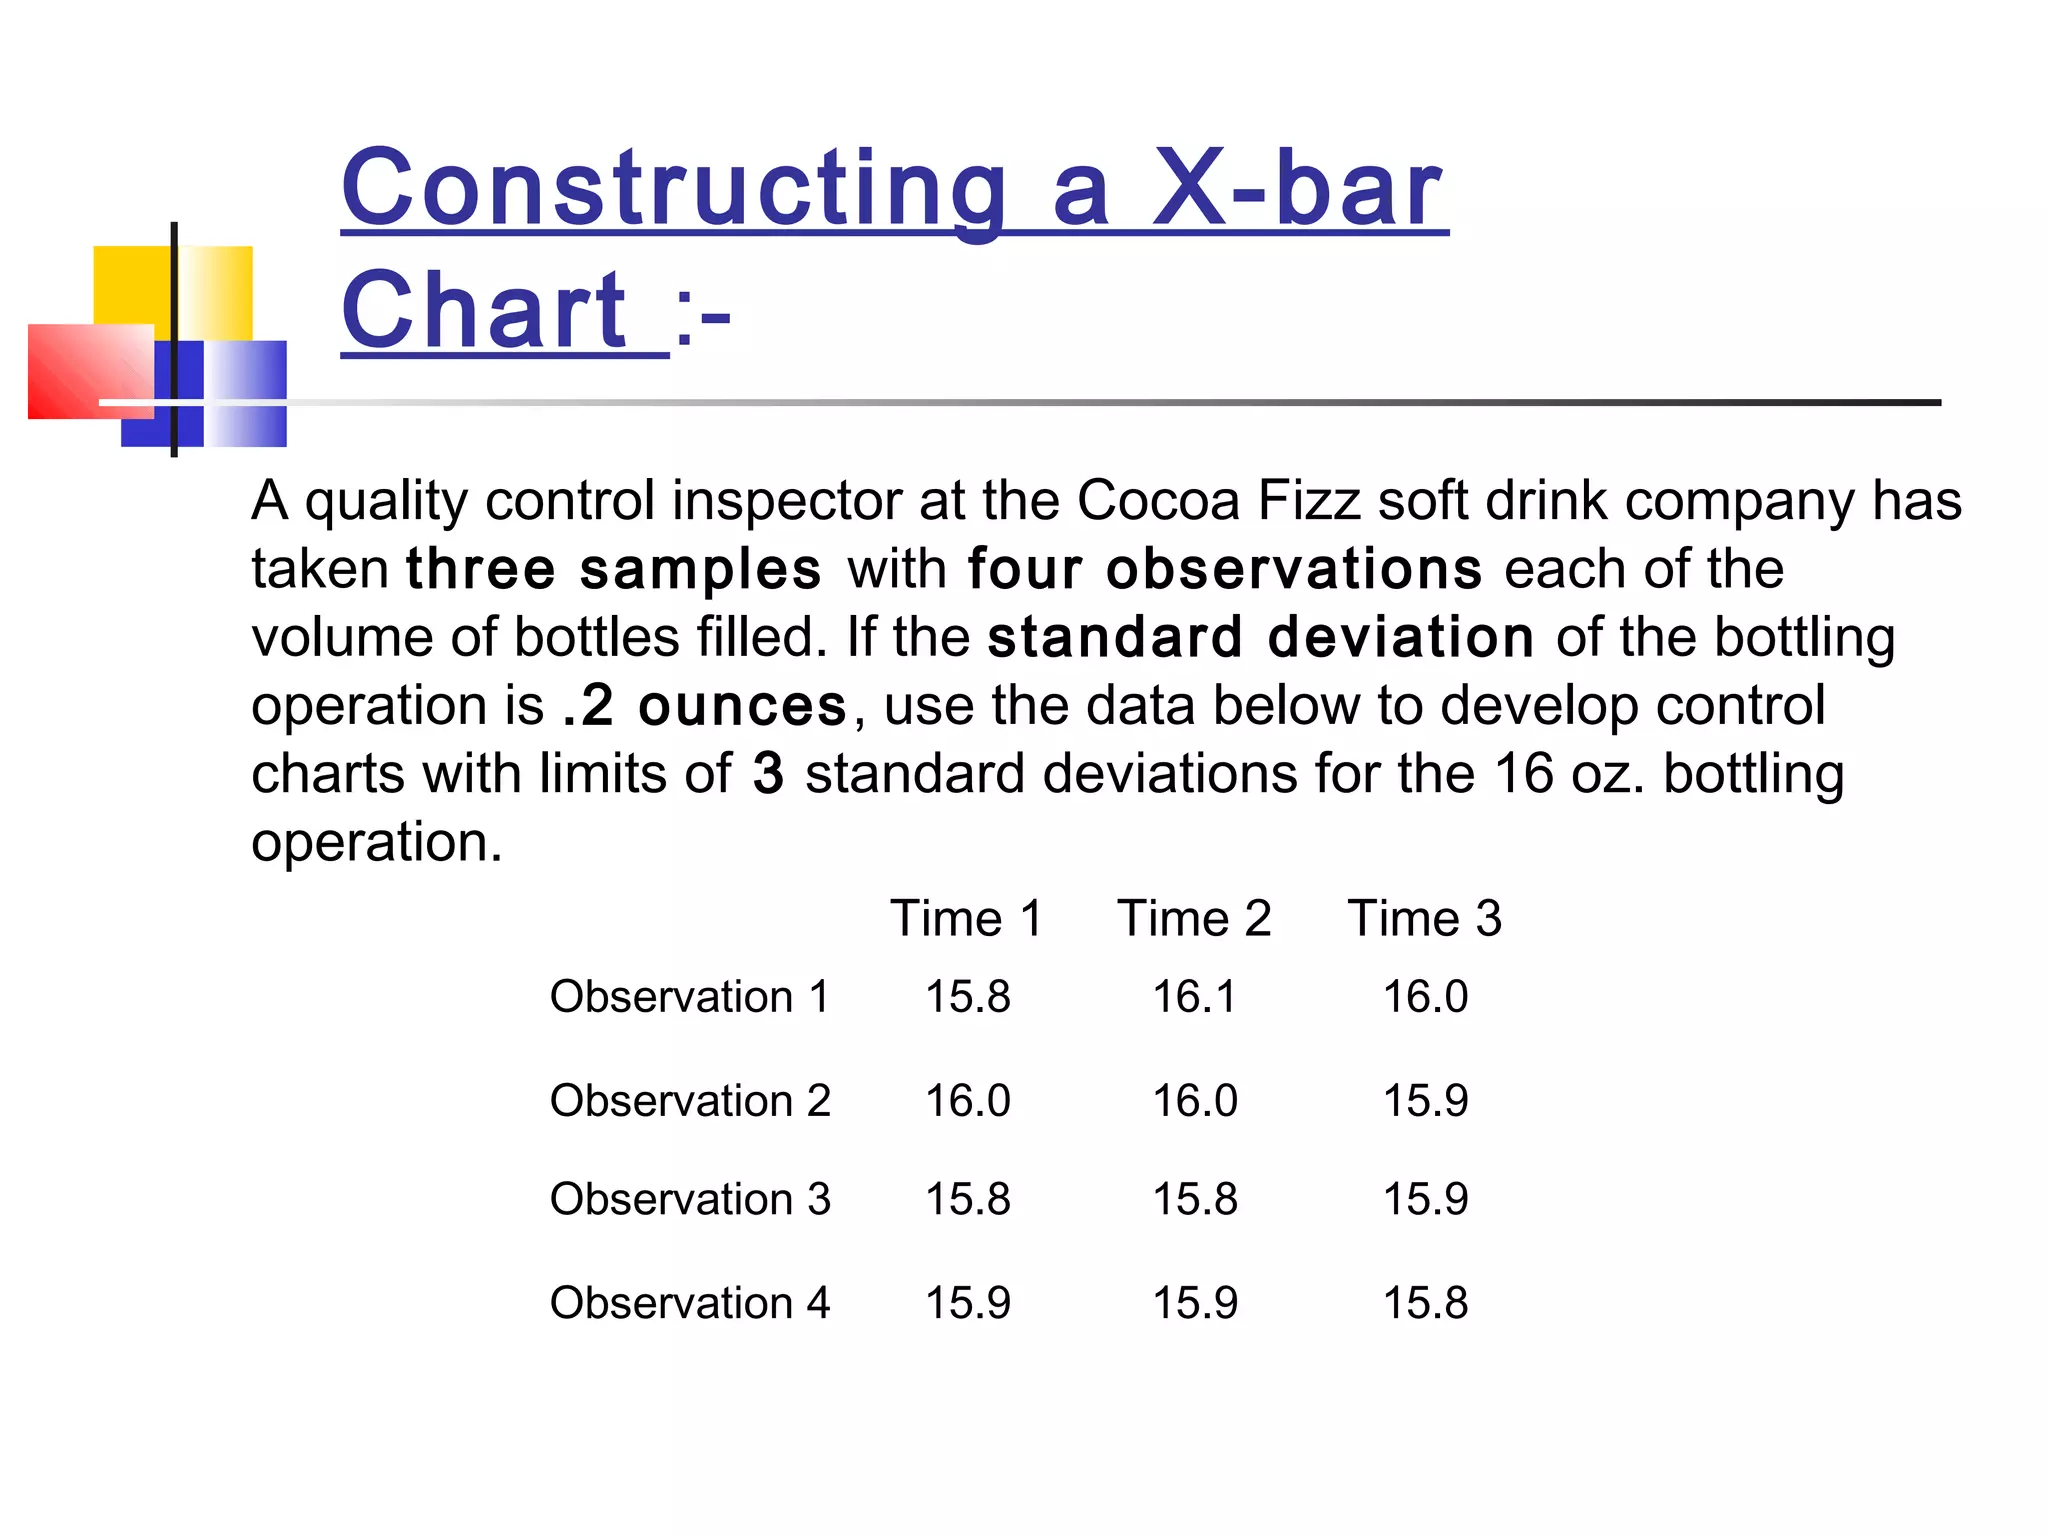
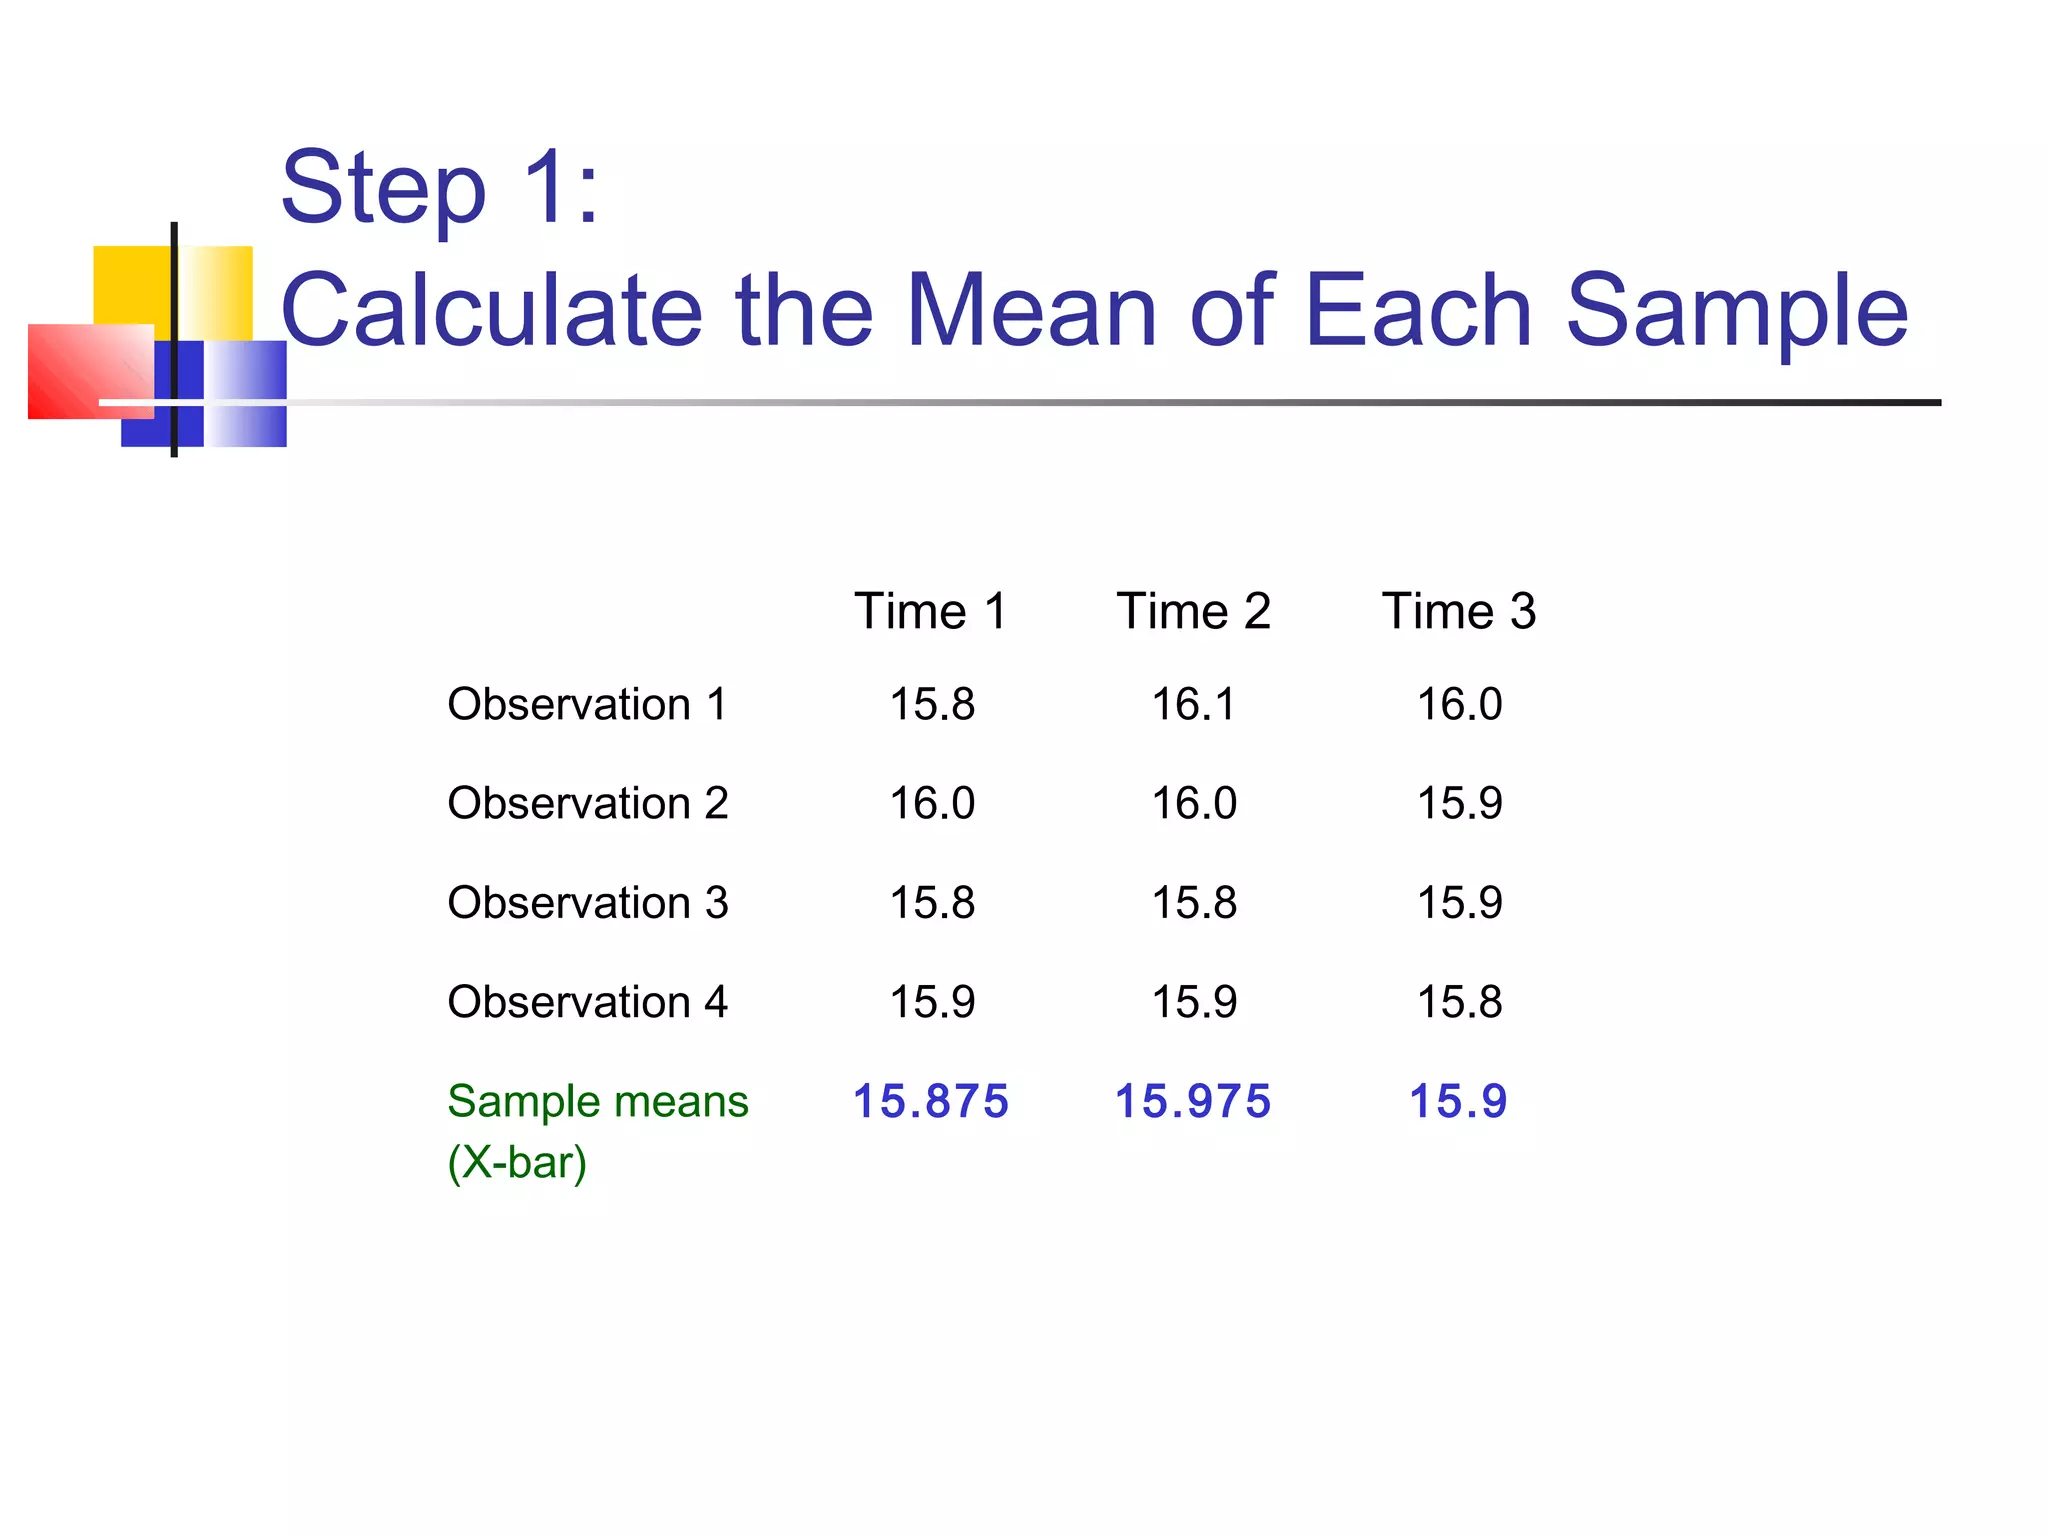
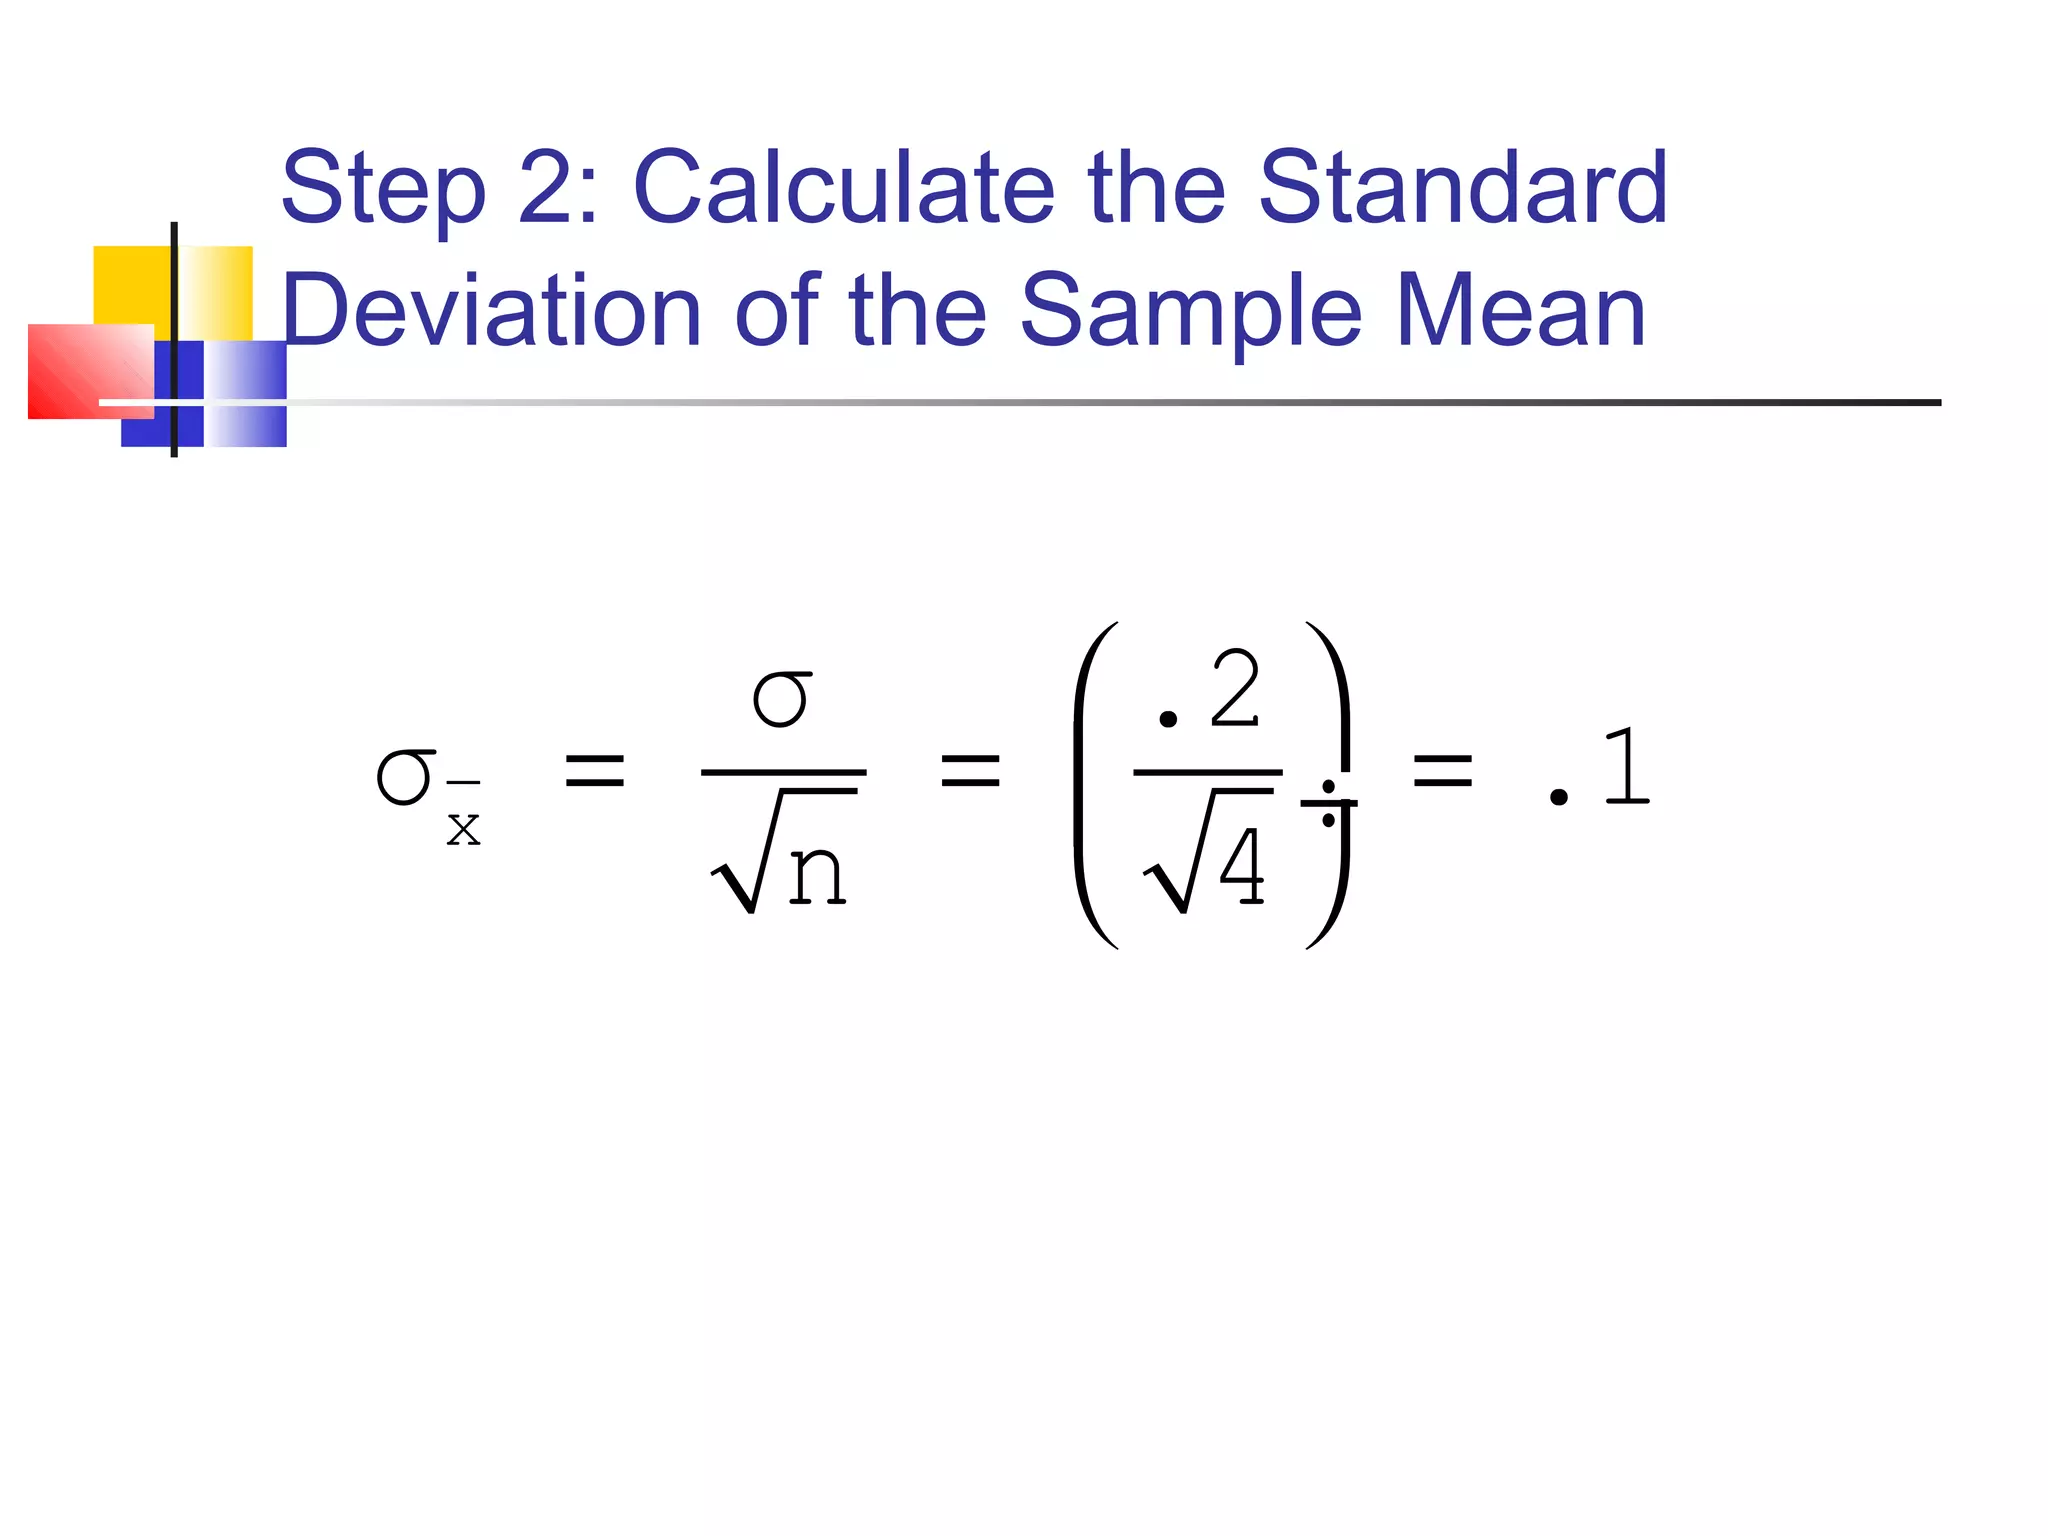
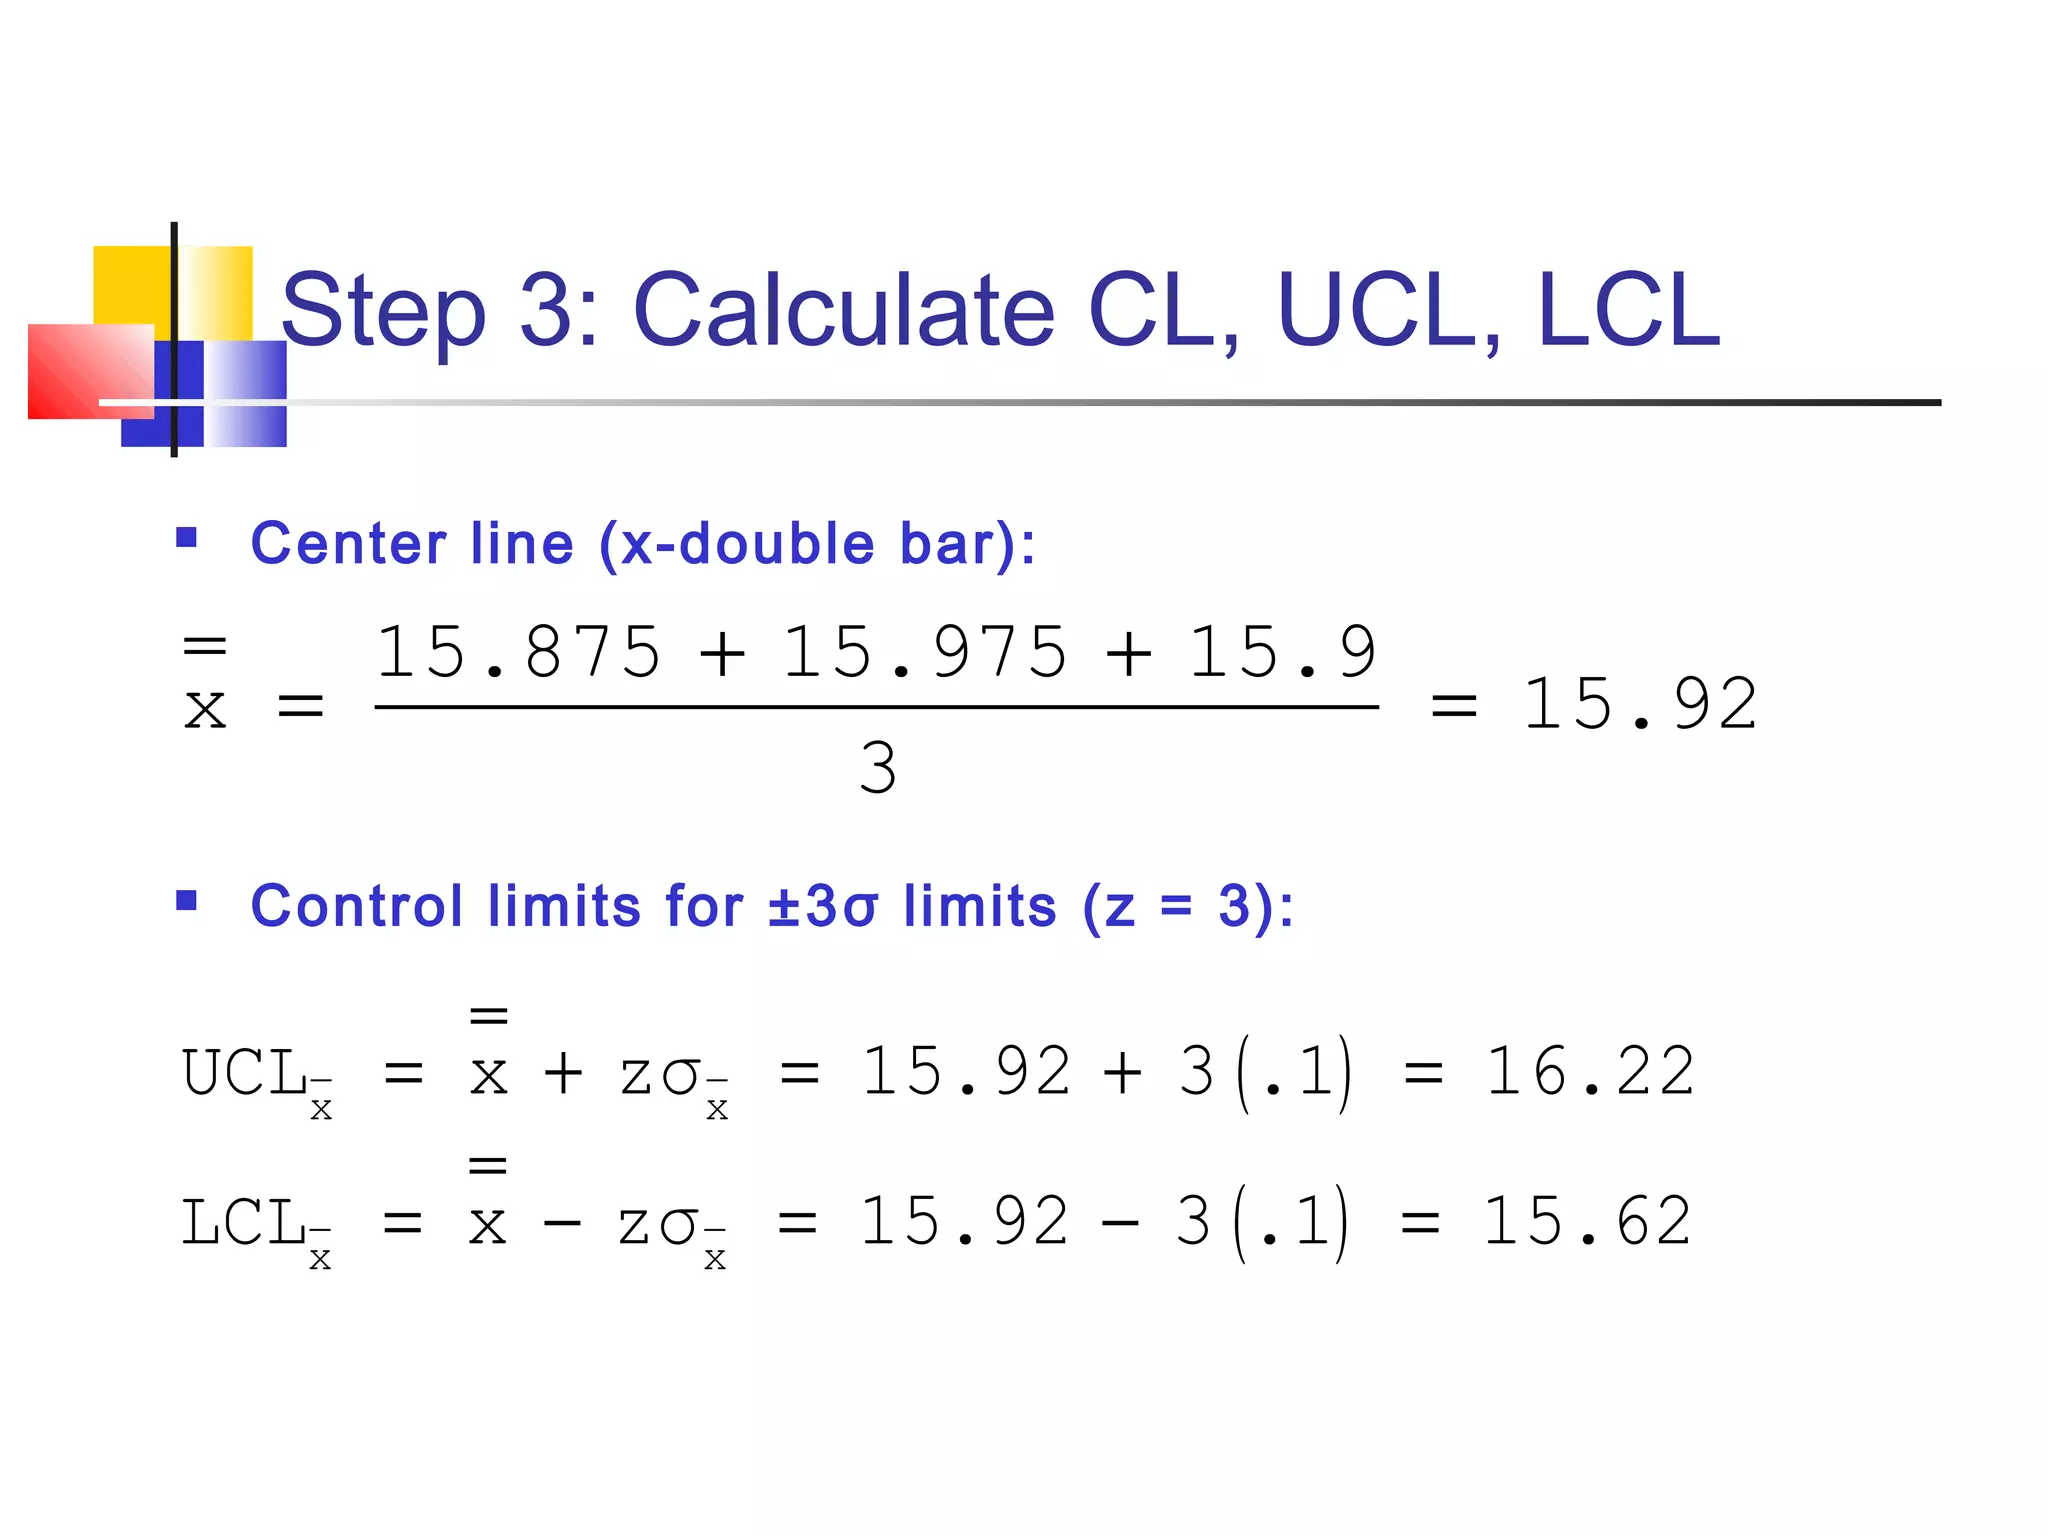

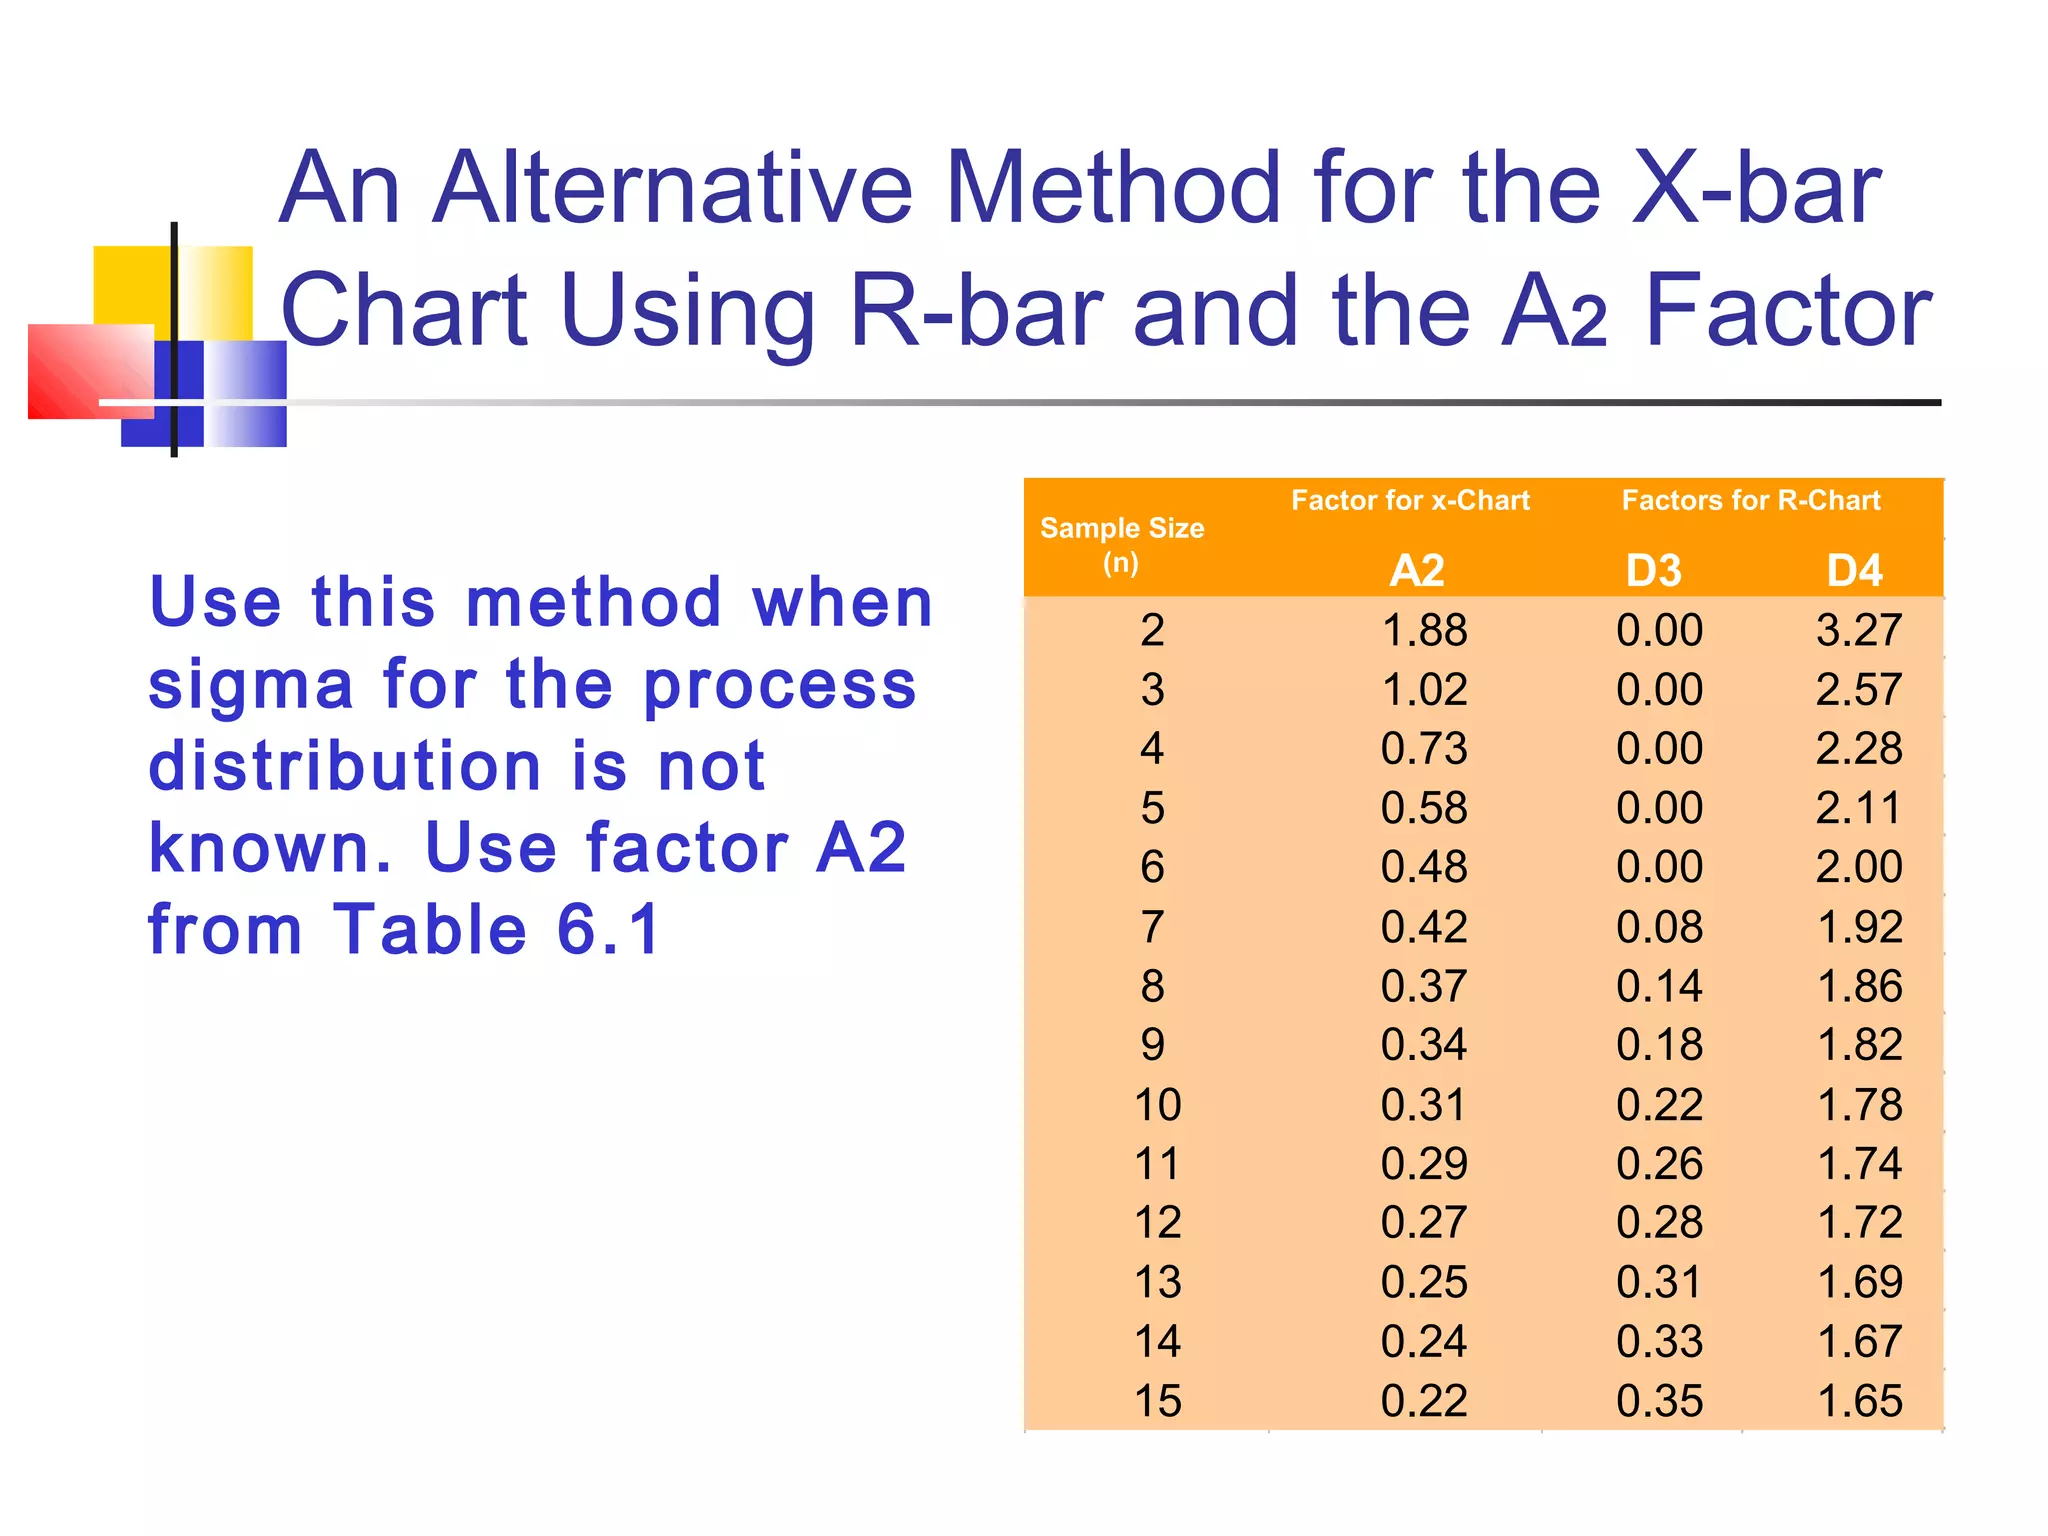
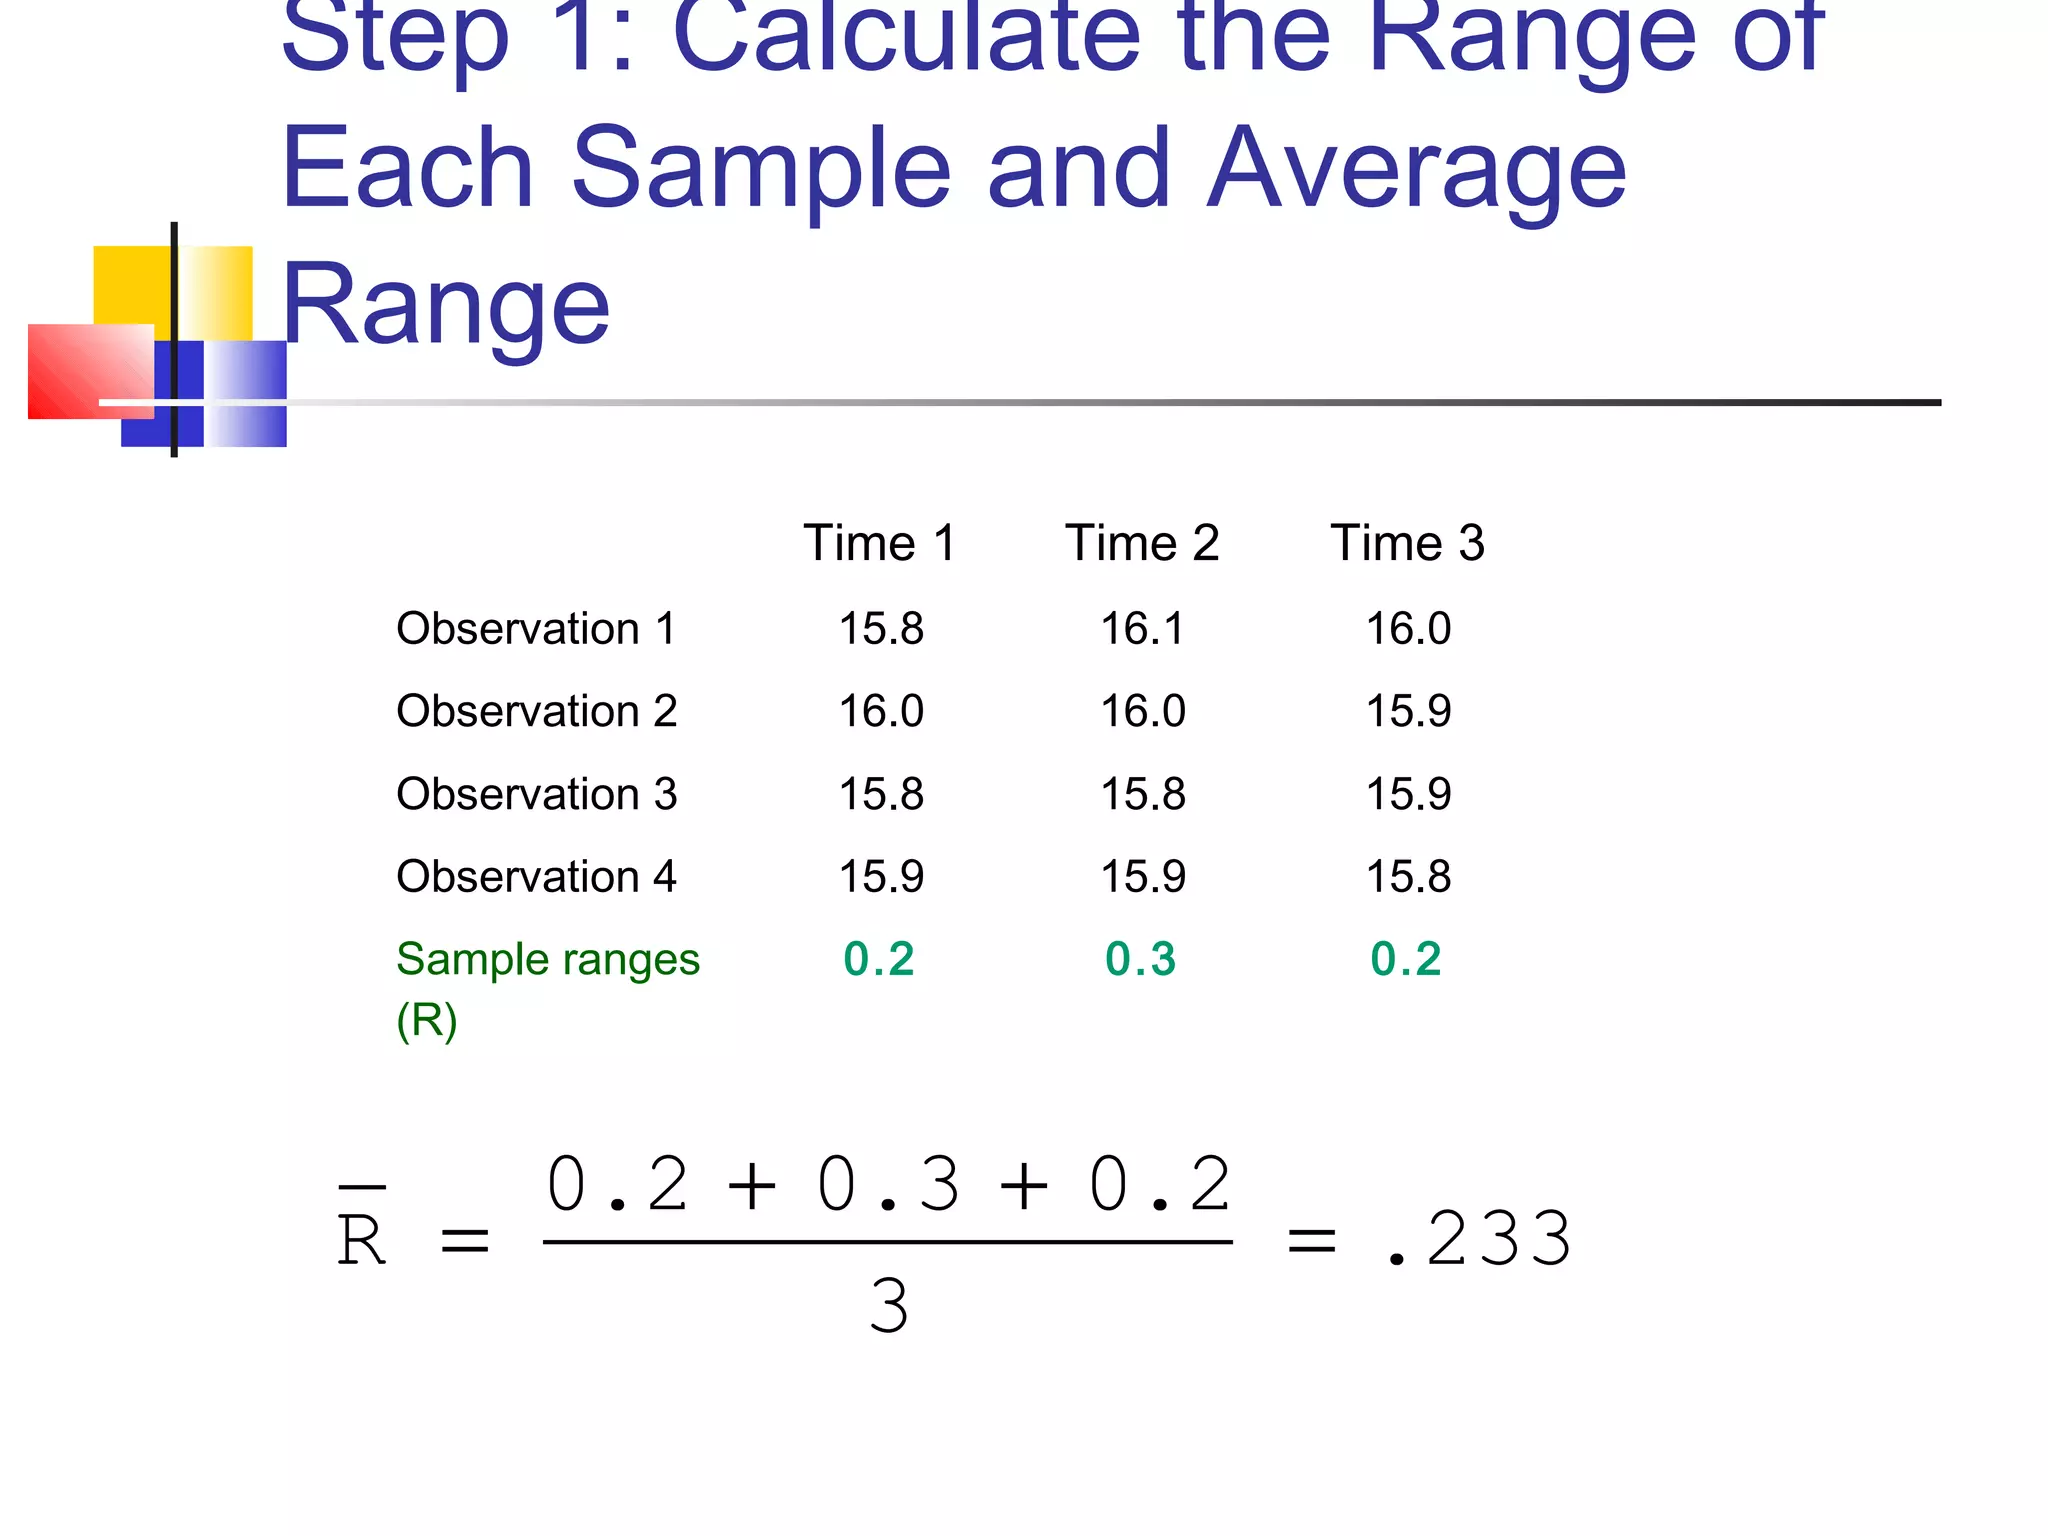
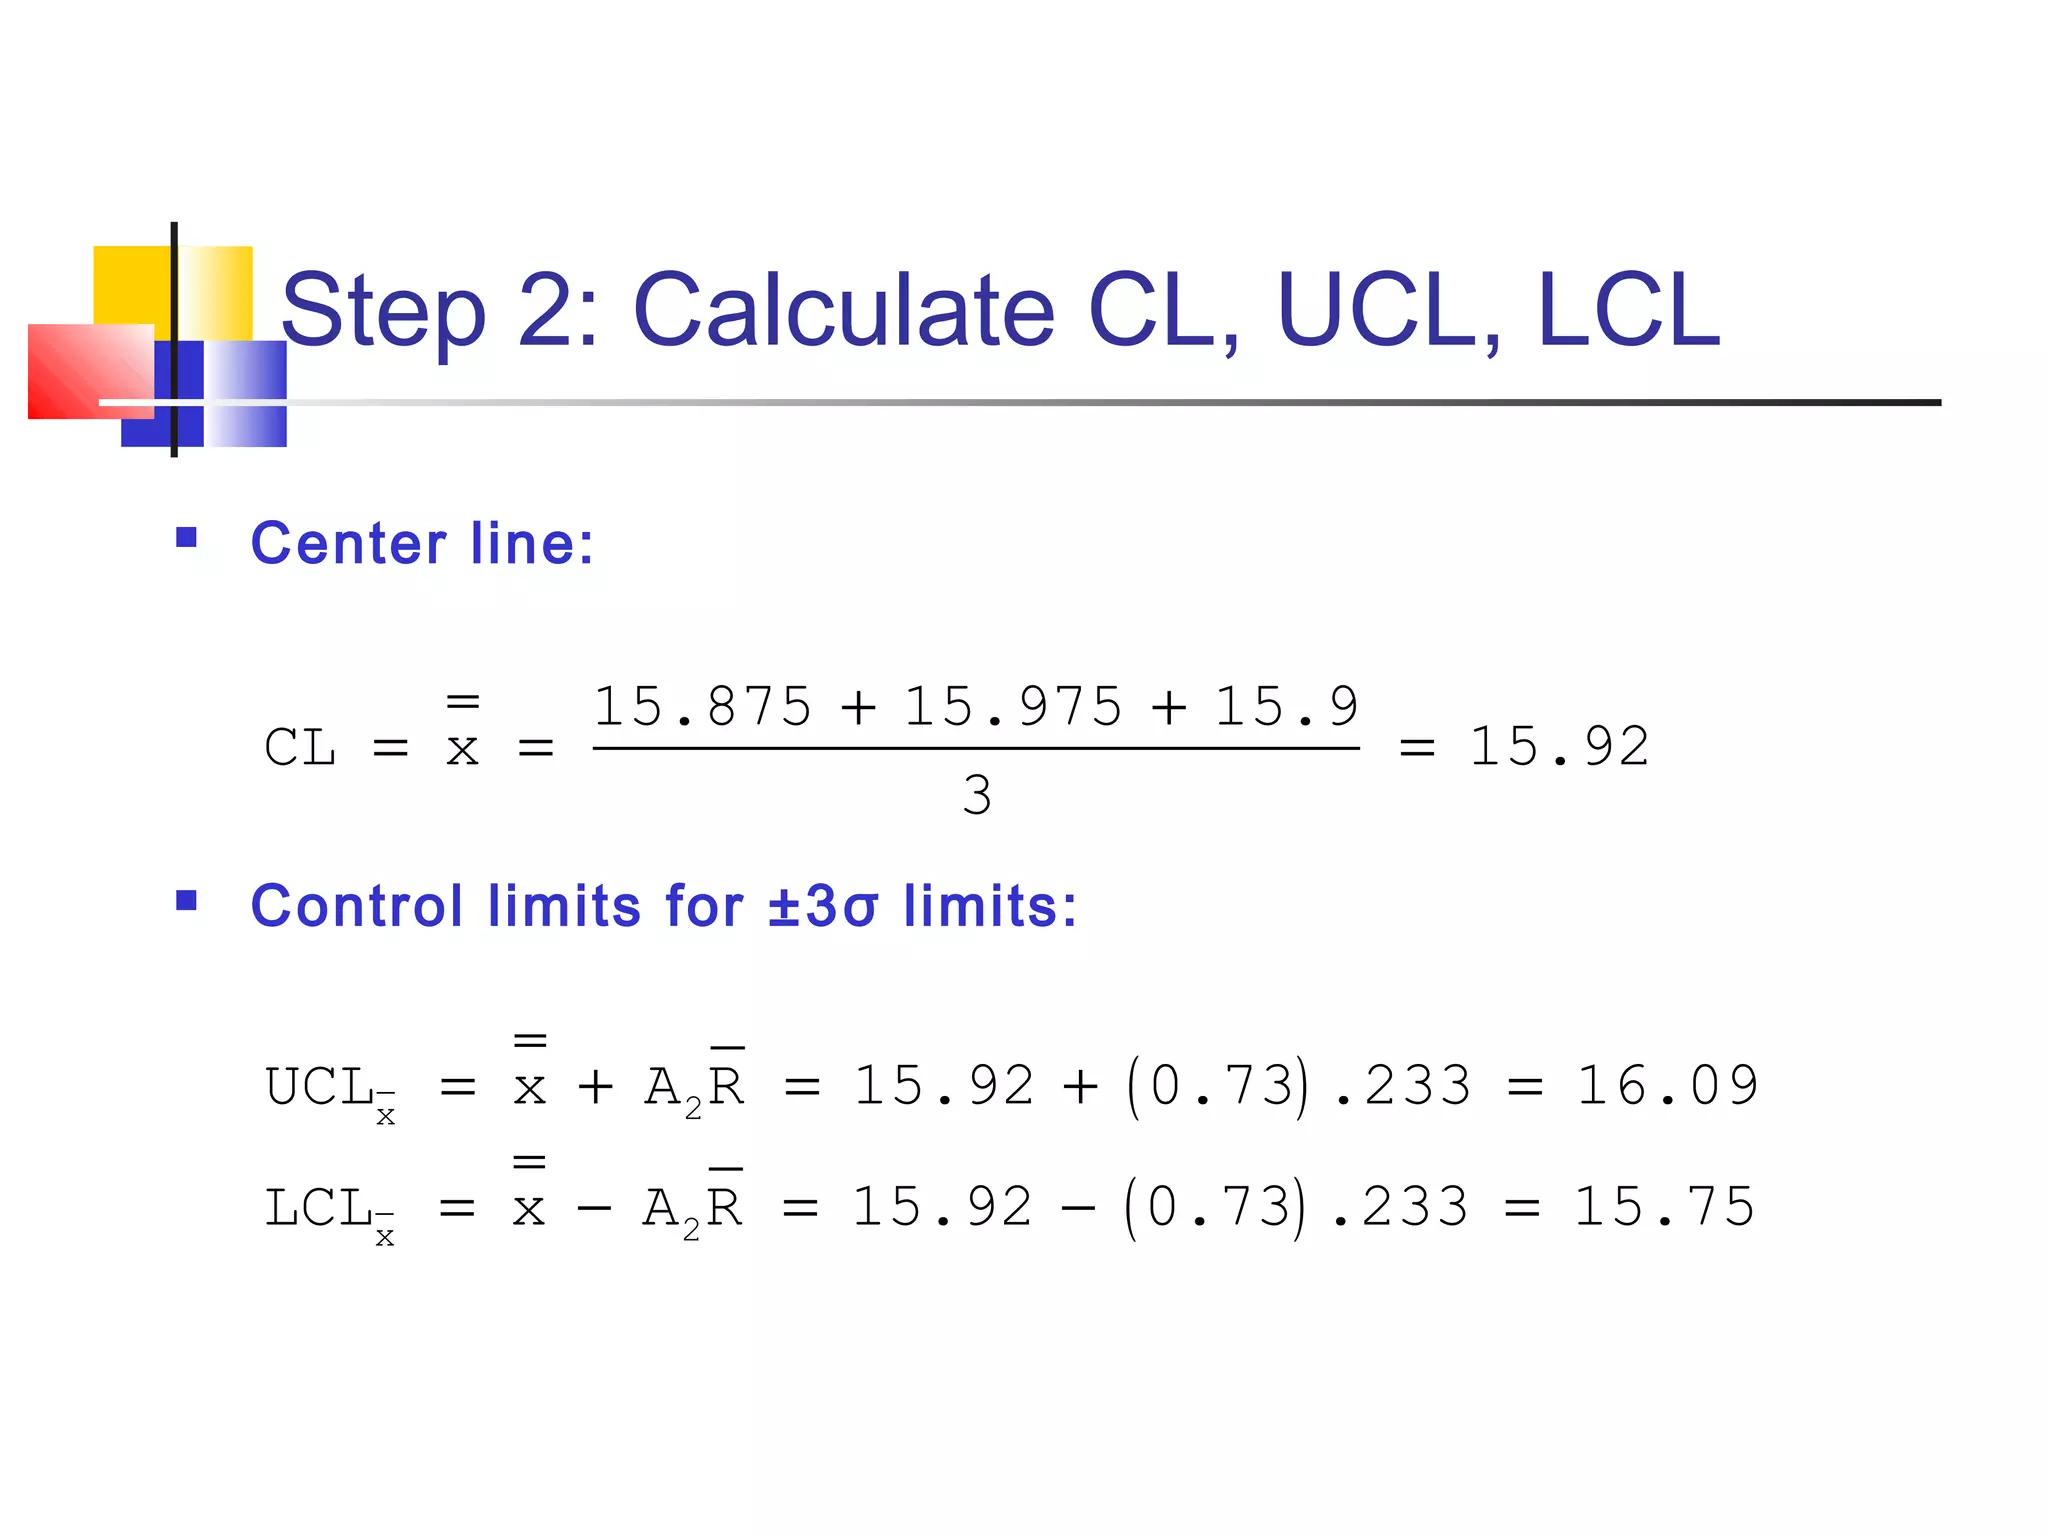
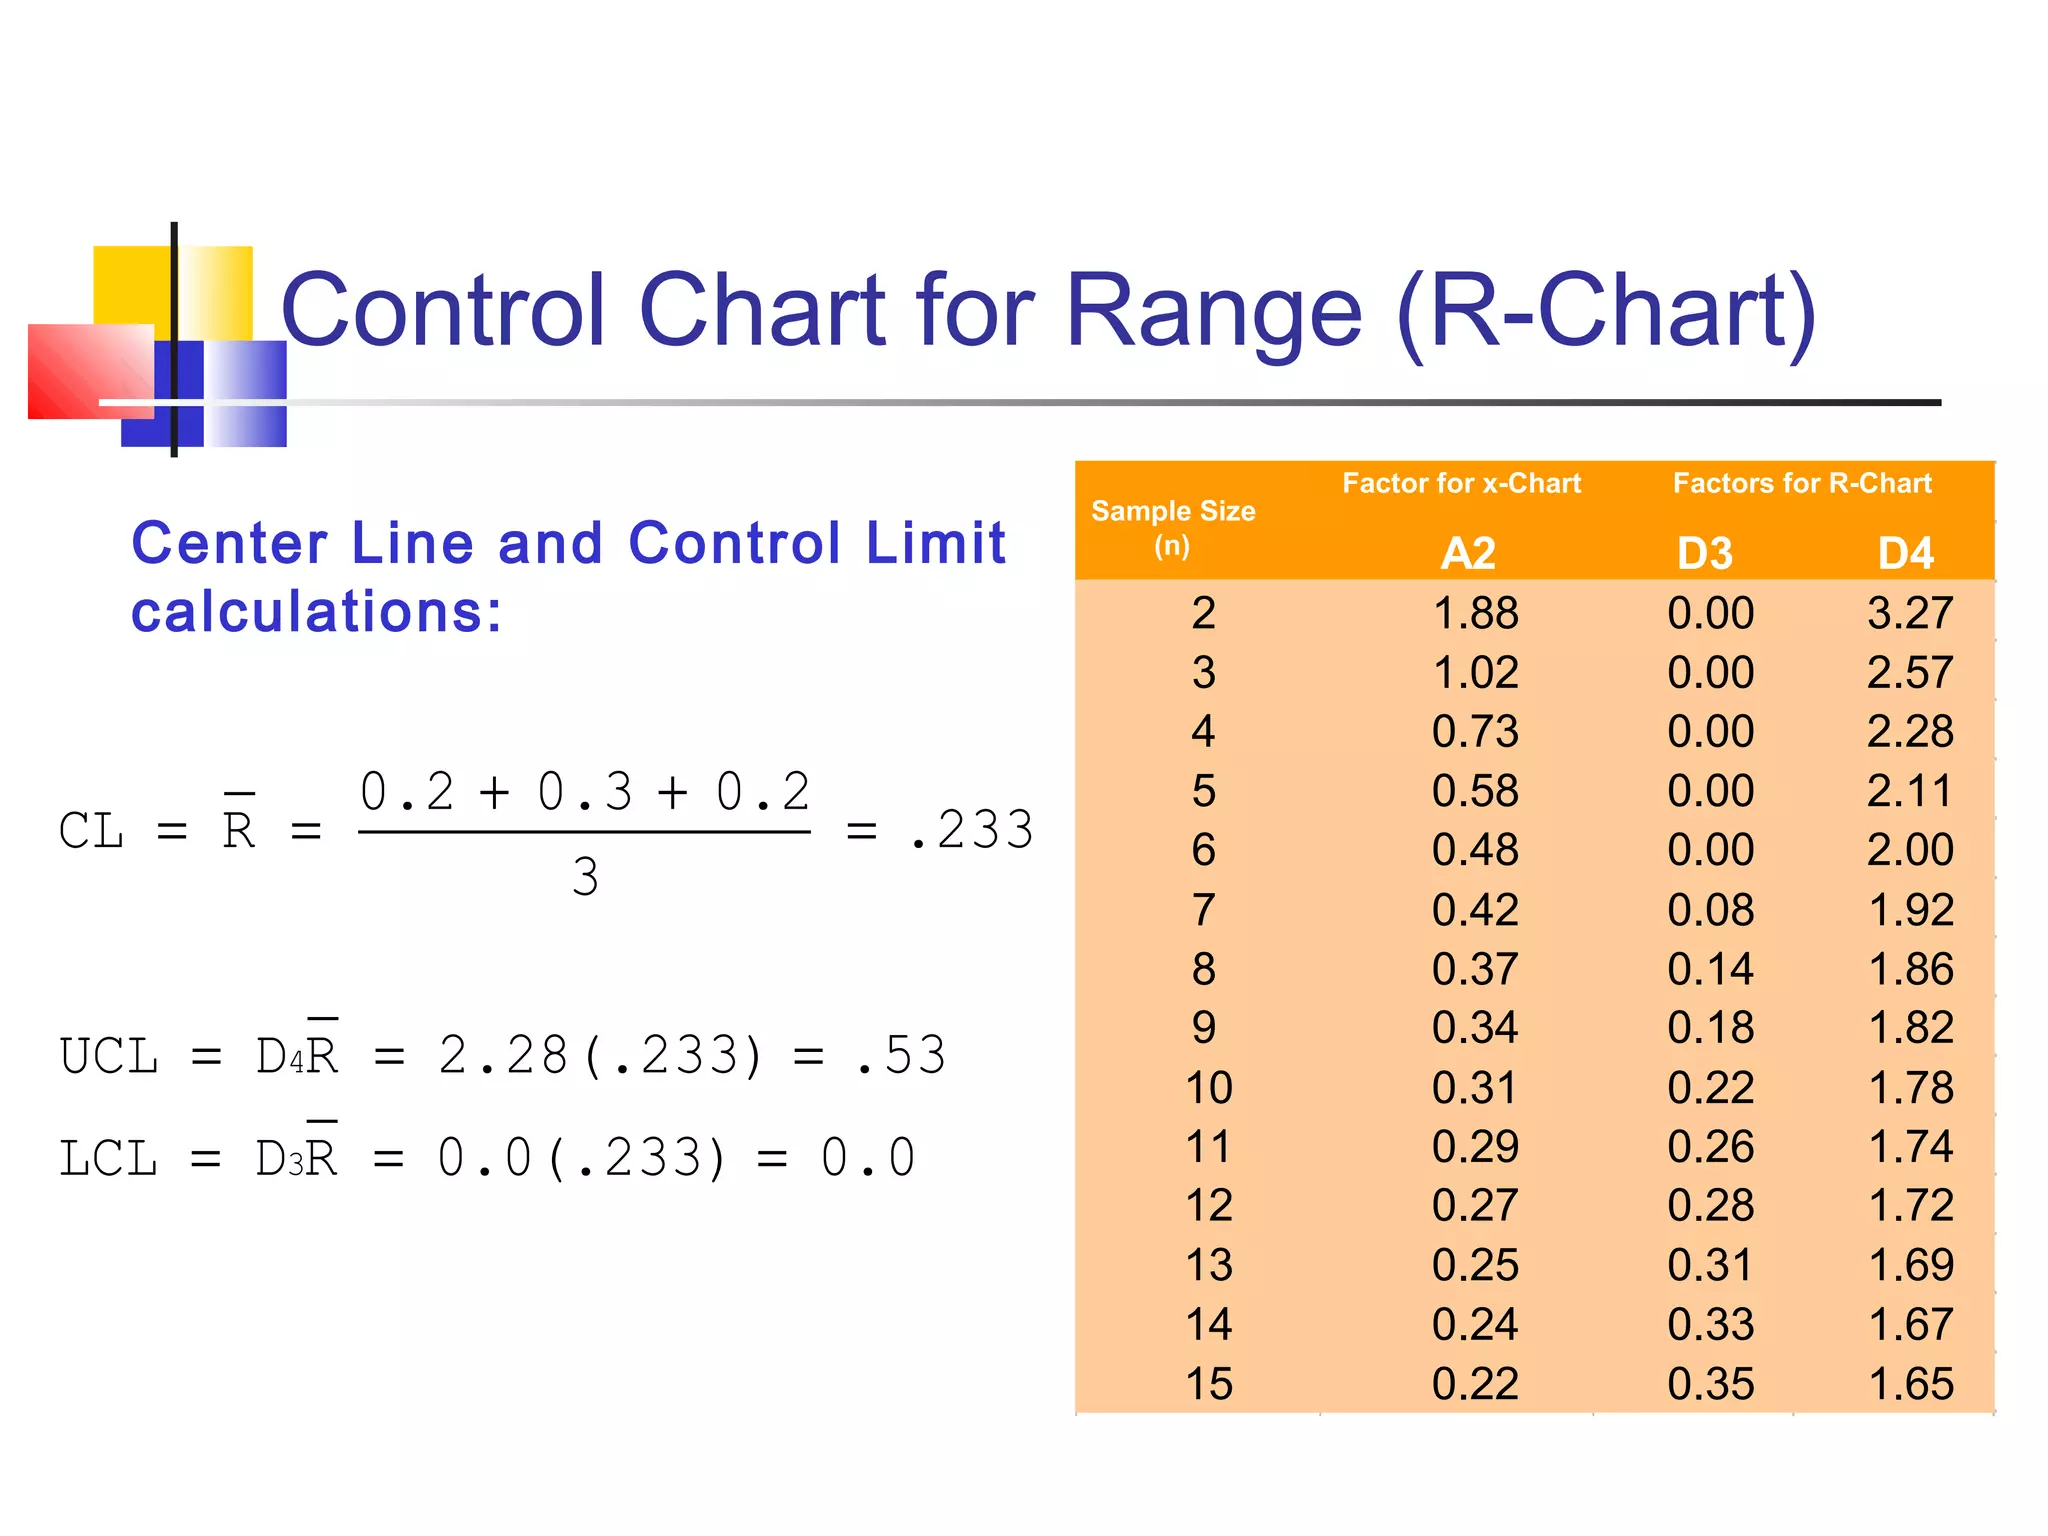
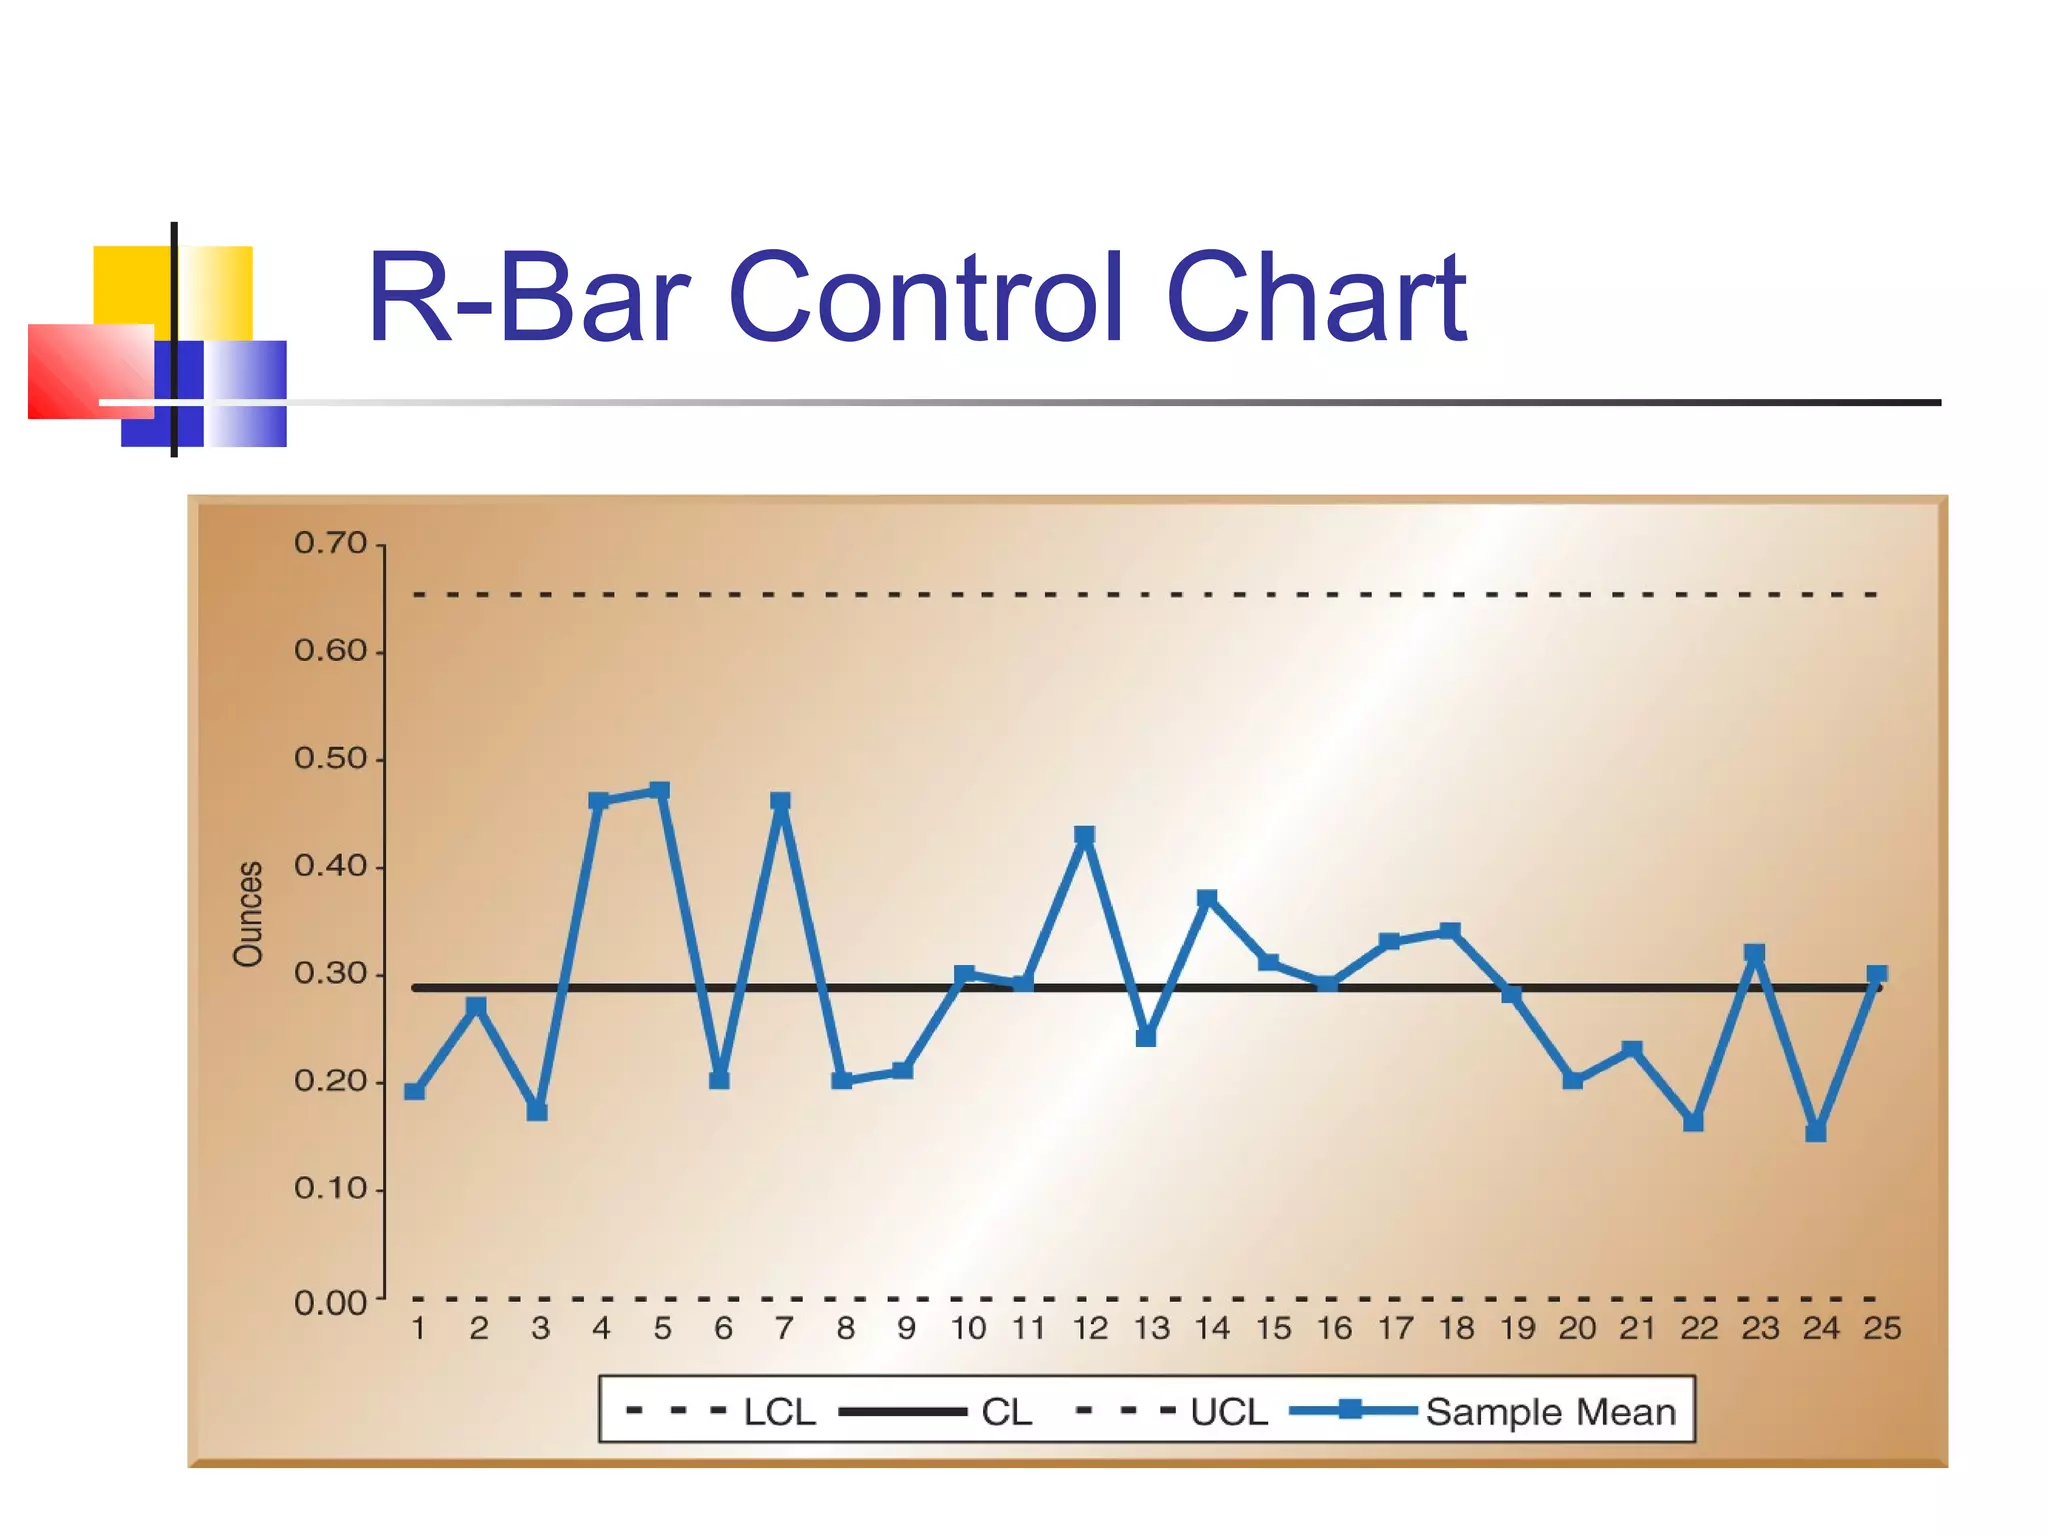

X-bar and R control charts are used to monitor the mean and variation of a process based on samples taken over time. An initial series of samples is used to estimate the mean and standard deviation of the process and establish control limits for subsequent X-bar and R charts. These control charts can then be used to monitor the process mean and variation and detect any points that are outside the control limits, indicating an out-of-control process that requires investigation. The document provides steps for constructing X-bar and R control charts using sample data and calculating control limits based on the sample mean and range.


![Electrical discharge machining [EDM]](https://cdn.slidesharecdn.com/ss_thumbnails/electricaldischargemachiningedm-170803232011-thumbnail.jpg?width=640&height=640&fit=bounds)


