
Recommended
More Related Content
What's hot
What's hot (20)
Viewers also liked
Viewers also liked (19)
Similar to Currency high lights 25.11.16
Similar to Currency high lights 25.11.16 (20)
Recently uploaded
Recently uploaded (20)
Currency high lights 25.11.16
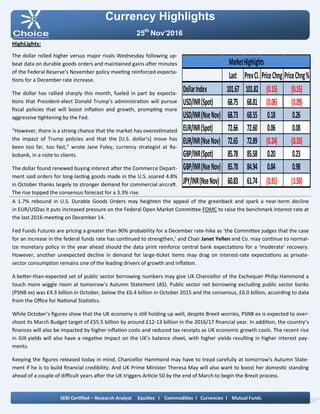
- 1. Currency Highlights 25th Nov’2016 HighLights: The dollar rolled higher versus major rivals Wednesday following up- beat data on durable goods orders and maintained gains after minutes of the Federal Reserve’s November policy meeting reinforced expecta- tions for a December rate increase. The dollar has rallied sharply this month, fueled in part by expecta- tions that President-elect Donald Trump’s administration will pursue fiscal policies that will boost inflation and growth, prompting more aggressive tightening by the Fed. “However, there is a strong chance that the market has overestimated the impact of Trump policies and that the *U.S. dollar’s+ move has been too far, too fast,” wrote Jane Foley, currency strategist at Ra- bobank, in a note to clients. The dollar found renewed buying interest after the Commerce Depart- ment said orders for long-lasting goods made in the U.S. soared 4.8% in October thanks largely to stronger demand for commercial aircraft. The rise topped the consensus forecast for a 3.3% rise. A 1.7% rebound in U.S. Durable Goods Orders may heighten the appeal of the greenback and spark a near-term decline in EUR/USDas it puts increased pressure on the Federal Open Market Committee FOMC to raise the benchmark interest rate at the last 2016-meeting on December 14. Fed Funds Futures are pricing a greater than 90% probability for a December rate-hike as ‘the Committee judges that the case for an increase in the federal funds rate has continued to strengthen,’ and Chair Janet Yellen and Co. may continue to normal- ize monetary policy in the year ahead should the data print reinforce central bank expectations for a ‘moderate’ recovery. However, another unexpected decline in demand for large-ticket items may drag on interest-rate expectations as private- sector consumption remains one of the leading drivers of growth and inflation. A better-than-expected set of public sector borrowing numbers may give UK Chancellor of the Exchequer Philip Hammond a touch more wiggle room at tomorrow’s Autumn Statement (AS). Public sector net borrowing excluding public sector banks (PSNB ex) was £4.3 billion in October, below the £6.4 billion in October 2015 and the consensus, £6.0 billion, according to data from the Office for National Statistics. While October’s figures show that the UK economy is still holding up well, despite Brexit worries, PSNB ex is expected to over- shoot its March Budget target of £55.5 billion by around £12-13 billion in the 2016/17 financial year. In addition, the country’s finances will also be impacted by higher inflation costs and reduced tax receipts as UK economic growth cools. The recent rise in Gilt yields will also have a negative impact on the UK’s balance sheet, with higher yields resulting in higher interest pay- ments. Keeping the figures released today in mind, Chancellor Hammond may have to tread carefully at tomorrow’s Autumn State- ment if he is to build financial credibility. And UK Prime Minister Theresa May will also want to boost her domestic standing ahead of a couple of difficult years after the UK triggers Article 50 by the end of March to begin the Brexit process. SEBI Certified – Research Analyst Equities I Commodities I Currencies I Mutual Funds Last PrevCl. PriceChng PriceChng% DollarIndex 101.67 101.82 (0.15) (0.15) USD/INR(Spot) 68.75 68.81 (0.06) (0.09) USD/INR(NseNov) 68.73 68.55 0.18 0.26 EUR/INR(Spot) 72.66 72.60 0.06 0.08 EUR/INR(NseNov) 72.65 72.89 (0.24) (0.33) GBP/INR(Spot) 85.78 85.58 0.20 0.23 GBP/INR(NseNov) 85.78 84.94 0.84 0.98 JPY/INR(NseNov) 60.83 61.74 (0.91) (1.50) MarketHighlights
- 2. Technical View: On daily chart, the JPYINR price has completed a “Bullish Anti-Cypher Harmonic Pattern” at 60.90 levels, the co- ordinates of which are as follows: Technical Parameter: XA of the leg from 62 to 67.80 ,AB of the leg completed at 64 (i.e.61.80%% of XA leg.) ,BC of the leg completed at 67.20 (i.e. 78.60% of AB leg.) and CD of the leg completed at 60.90 levels (i.e. 127.20% of XA and 224% Fibonacci Projection of BC leg.). On daily chart momentum indicator RSI is trading near its oversold zone at 33 levels which suggest further bull- ishness can be seen in the prices. So for trading perspective, one could use buy in the range of 60.75 with SL of 60.45 for target of 61.40 levels. Pivot levels for the Day Technical View: The pair has given breakout of its falling channel pattern at 67.10 levels on daily chart. On daily USDINR prices have shown breakout of its falling trend line at 67.20 levels. Moreover, prices have been trading above its 50 DEMA which gives the sign of bullishness in the prices. A momentum indicator RSI has traded above 50 levels, which suggest further positive momentum can be seen in the prices. In addition, momentum indicator MACD has shown pos- itive crossover on daily chart. So for trading perspective, one could buy in range 68.50 with SL of 68.10 for target of 69.20. Currency Highlights 25th Nov’2016 USDINR JPYINR SEBI Certified – Research Analyst Equities I Commodities I Currencies I Mutual Funds S3 S2 S1 Pivot R1 R2 R3 USDINR 68.19 68.45 68.58 68.71 68.84 68.97 69.23 JPYINR 59.62 60.25 60.54 60.88 61.17 61.51 62.14
- 3. Pivot levels for the Day Currency Highlights 25th Nov’2016 GBPINR EURINR Technical View: The price has shown breakdown of its falling channel a pattern at 72.60 levels on daily chart. The EURINR pair has shown horizontal trend line at 72.80 levels on daily chart. The pair has been trading below its 50 DEMA on daily chart, which suggest further weakness can be seen in the prices. On daily chart momentum oscillator RSI have been trad- ing below 60 which suggest bearishness in the prices. A momentum indicator MACD has shown negative crossover on daily chart, which add more bearishness in the prices. For now we can expect prices should move lower to- wards 71.80 levels in the coming trading session. Technical View: The pair has shown breakout of its horizontal channel pattern at 84.80 levels on daily chart. Moreover, prices have been trading above 50 DEMA, which suggest short term trend looks positive. The price has formed bullish hammer candle stick pattern on daily chart, which is bullish pattern. A momentum indicator MADC has given positive Cross over on hourly chart, which gives the sign of bullishness in the prices. The momentum indictor RSI has been trading above 60 levels on daily chart, which suggest the possibilities of bounce back in the in the prices. For now we expect prices should move higher towards 86 .10 levels coming trading sessions. SEBI Certified – Research Analyst Equities I Commodities I Currencies I Mutual Funds S3 S2 S1 Pivot R1 R2 R3 GBPINR 84.42 85.00 85.38 85.58 85.96 86.16 86.74 EURINR 71.76 72.16 72.41 72.56 72.81 72.96 73.36
- 4. Currency Highlights SEBI Certified – Research Analyst Equities I Commodities I Currencies I Mutual Funds 25th Nov’2016 Economic Indicators Date Time Data Prior Expected Impact 25.11.16 10:30 AM BOJ Core CPI y/y 0.2% 0.3% Actual > Forecast = Good for currency; JPYINR 25.11.16 03:00 PM Second Estimate GDP q/q 0.5% 0.5% Actual > Forecast = Good for currency; GBPINR 25.11.16 03:30 PM Italian Retail Sales m/m -0.1% 0.0% Actual > Forecast = Good for currency; EURINR 25.11.16 07:00 PM Goods Trade Balance -56.5B -59.2B Actual > Forecast = Good for currency; USDINR 25.11.16 08:15 PM Flash Services PMI 54.90 54.80 Actual > Forecast = Good for currency; USDINR
- 5. Currency Highlights 25th Nov’2016 SEBI Certified – Research Analyst Equities I Commodities I Currencies I Mutual Funds Amit Pathania Digitally signed by Amit Pathania DN: cn=Amit Pathania, o=Choice Equity Broking Pvt. ltd, ou=Research Department, email=amit.pathania@choiceindia.com, c=IN Date: 2016.11.25 09:01:33 +05'30'