
Recommended
More Related Content
What's hot
What's hot (20)
Viewers also liked
Viewers also liked (20)
Similar to Equity bazaar 20.09.2016
Similar to Equity bazaar 20.09.2016 (13)
Recently uploaded
Recently uploaded (20)
Equity bazaar 20.09.2016
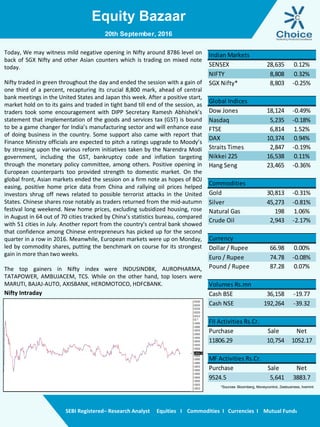
- 1. Equity Bazaar SEBI Registered– Research Analyst Equities I Commodities I Currencies I Mutual Funds Nifty Intraday Today, We may witness mild negative opening in Nifty around 8786 level on back of SGX Nifty and other Asian counters which is trading on mixed note today. Nifty traded in green throughout the day and ended the session with a gain of one third of a percent, recapturing its crucial 8,800 mark, ahead of central bank meetings in the United States and Japan this week. After a positive start, market hold on to its gains and traded in tight band till end of the session, as traders took some encouragement with DIPP Secretary Ramesh Abhishek’s statement that implementation of the goods and services tax (GST) is bound to be a game changer for India’s manufacturing sector and will enhance ease of doing business in the country. Some support also came with report that Finance Ministry officials are expected to pitch a ratings upgrade to Moody’s by stressing upon the various reform initiatives taken by the Narendra Modi government, including the GST, bankruptcy code and inflation targeting through the monetary policy committee, among others. Positive opening in European counterparts too provided strength to domestic market. On the global front, Asian markets ended the session on a firm note as hopes of BOJ easing, positive home price data from China and rallying oil prices helped investors shrug off news related to possible terrorist attacks in the United States. Chinese shares rose notably as traders returned from the mid-autumn festival long weekend. New home prices, excluding subsidized housing, rose in August in 64 out of 70 cities tracked by China’s statistics bureau, compared with 51 cities in July. Another report from the country's central bank showed that confidence among Chinese entrepreneurs has picked up for the second quarter in a row in 2016. Meanwhile, European markets were up on Monday, led by commodity shares, putting the benchmark on course for its strongest gain in more than two weeks. The top gainers in Nifty index were INDUSINDBK, AUROPHARMA, TATAPOWER, AMBUJACEM, TCS. While on the other hand, top losers were MARUTI, BAJAJ-AUTO, AXISBANK, HEROMOTOCO, HDFCBANK. 20th September, 2016 SENSEX 28,635 0.12% NIFTY 8,808 0.32% SGX Nifty* 8,803 -0.25% Global Indices Dow Jones 18,124 -0.49% Nasdaq 5,235 -0.18% FTSE 6,814 1.52% DAX 10,374 0.94% Straits Times 2,847 -0.19% Nikkei 225 16,538 0.11% Hang Seng 23,465 -0.36% Commodities Gold 30,813 -0.31% Silver 45,273 -0.81% Natural Gas 198 1.06% Crude Oil 2,943 -2.17% Currency Dollar / Rupee 66.98 0.00% Euro / Rupee 74.78 -0.08% Pound / Rupee 87.28 0.07% Volumes Rs.mn Cash BSE 36,158 -19.77 Cash NSE 192,264 -39.32 FII Activities Rs.Cr. Purchase Sale Net 11806.29 10,754 1052.17 MF Activities Rs.Cr. Purchase Sale Net 9524.5 5,641 3883.7 Indian Markets *Sources- Bloomberg, Moneycontrol, Zeebusiness, livemint
- 2. Equity Bazaar SEBI Registered– Research Analyst Equities I Commodities I Currencies I Mutual Funds Nifty Outlook Bank Nifty Outlook 20th September, 2016 L1 L2 L3 R 8830 8852 8881 S 8780 8752 8730 21 DEMA 8749 50 DEMA 8615 100 DEMA 8399 Moving Averages L1 L2 L3 R 19998 20088 20162 S 19833 19759 19668 21 DEMA 19714 50 DEMA 19160 100 DEMA 18410 Moving Averages Nifty opened on positive note and moved with strength in initial hour, but in later part of the day it has grinded in narrow range. From past couple of day index is trading with high volatility but day on day its momentum is not picking in either direction. It shows time wise correction with timid volume but based on technical evidences index still seems to be in positive momentum as it is operating above 21 day moving average and sustaining above slope of trend line. Going forward, mild resistance can be in vicinity of 8840 to 8860 range and on downside support lies at 8750 level. BankNifty opened on positive note but not able to sustain at higher level, strong selling has emerged from higher level. On weekly chart index has formed Doji candle which shows indecisiveness at higher level. Index is trading above its 21 day short term moving average but after good move mild profit taking has been observed in PSU banks and some leading private sector bank. Going forward, mild positive bias can be maintain with upside potential of 20100 and immediate support lies at 19700 level.
- 3. Equity Bazaar SEBI Registered– Research Analyst Equities I Commodities I Currencies I Mutual Funds Derivative Front: The India VIX addition by 2.47% and reached 14.94. The Nifty was up by 28.55 points or 0.33% to settle at 8,808.40. From the most active contracts, State Bank of India September 2016 futures traded at a premium of 1.30 points at 256.80 compared with spot closing of 255.50. ICICI Bank September 2016 futures traded at a premium of 0.75 points at 272.45 compared with spot closing of 271.70. Axis Bank September 2016 futures traded at a premium of 1.70 points at 596.70 compared with spot closing of 595.00. Tata Motors September 2016 futures traded at a discount of 0.20 points at 554.80 compared with spot closing of 555.00. Reliance Industries September 2016 futures traded at a premium of 1.40 points at 1084.15 compared with spot closing of 1,082.75. The Nifty PCR finally stood at 1.26 for September month contract. The top five scrips with highest PCR on OI were MRF (2.67), GODREJCP (1.36), MARUTI (1.31), GRASIM (1.25) and CENTURYTEX (1.17). 20th September, 2016 Long Built Up Symbol Close Price Chng % OI Chng % Buy Above IBREALEST 93.00 6.59 20.56 Long BU APOLLOTYRE 222.25 3.93 13.18 Long BU CEATLTD 1127.45 5.79 11.69 Long BU VOLTAS 392.4 3.21 8.69 Long BU Short Covering Symbol Close Price Chng % OI Chng % Buy Above CENTURYTEX 894.00 2.85 -8.36 909.32 TCS 2412.90 2.02 -7.81 2441.47 PETRONET 339.50 1.60 -5.86 342.63 BHARATFORG 904.25 3.19 -5.25 921.21 Short Built Up Symbol Close Price Chng % OI Chng % Sell Below CASTROLIND 420.00 -5.27 31.84 429.36 UPL 685.65 -1.37 9.40 693.56 JUBLFOOD 1009.25 -3.39 8.21 1027.11 IRB 245.8 -0.83 4.73 248.13 Long Liquidation Symbol Close Price Chng % OI Chng % Sell Below WOCKPHARMA 891.80 -2.02 -16.02 909.81 TVSMOTOR 337.70 -0.46 -4.83 342.07 HDIL 88.40 -1.06 -3.53 91.11 EICHERMOT 23138.60 -0.15 -2.27 23254.23 INFOSYS CALL RATIO SPREAD View - Moderate Bullish Max. Profit of 32.86 (Rs. 16430), Approx. Loss of 7.14 (Rs. 3570) at SL level 1120 Expiry Date - 29th September, 2016 BUY / SELL QTY STRIKE PRICE SERIES OPTION TYPE Premium BUY 500 1040 SEP CE 31.35 SELL 500 1080 SEP CE 12.10 SELL 500 1080 SEP CE 12.10
- 4. Equity Bazaar SEBI Registered– Research Analyst Equities I Commodities I Currencies I Mutual Funds 20th September, 2016 Symbols CLOSE R3 R2 R1 P S1 S2 S3 Trend Action ACC 1647 1685 1672 1659 1646 1634 1620 1594 Up Buy ADANIPORTS 275 287 282 279 274 271 266 258 Up Buy AMBUJACEM 268 276 272 270 266 264 261 255 Up Buy ASIANPAINT 1161 1184 1178 1170 1163 1155 1149 1134 Down Sell AUROPHARMA 806 830 818 812 800 794 782 764 Up Buy AXISBANK 595 616 611 603 598 590 585 572 Down Sell BAJAJ-AUTO 2945 3064 3038 2992 2966 2919 2893 2821 Down Sell BANKBARODA 166 170 169 168 167 165 164 162 Down Sell BHARTIARTL 324 330 327 326 323 322 319 315 Up Buy BHEL 147 151 150 149 148 146 145 142 Down Sell BOSCHLTD 23390 23805 23627 23509 23331 23213 23035 22739 Up Buy BPCL 586 597 592 589 584 581 577 569 Up Buy CIPLA 598 607 604 601 597 594 590 583 Up Buy COALINDIA 328 335 332 330 327 325 322 317 Up Buy DRREDDY 3153 3206 3190 3172 3156 3138 3122 3089 Down Sell EICHERMOT 23150 23655 23494 23322 23161 22989 22828 22495 Down Sell GAIL 387 399 396 392 389 385 383 376 Down Sell GRASIM 4860 4968 4936 4898 4867 4828 4797 4727 Down Sell HCLTECH 789 814 806 798 790 781 773 757 Down Sell HDFC 1395 1417 1409 1402 1394 1387 1379 1364 Up Buy HDFCBANK 1290 1313 1308 1299 1293 1284 1279 1264 Down Sell HEROMOTOCO 3556 3664 3640 3598 3575 3533 3509 3444 Down Sell HINDALCO 144 148 146 145 143 142 140 138 Up Buy HINDUNILVR 911 932 927 919 914 906 901 887 Down Sell ICICIBANK 272 278 275 274 271 269 266 261 Up Buy IDEA 85 87 86 86 85 84 84 82 Down Sell INDUSINDBK 1202 1259 1233 1217 1191 1176 1149 1107 Up Buy INFRATEL 350 359 355 353 349 346 343 336 Up Buy INFY 1061 1100 1085 1073 1057 1045 1029 1002 Up Buy ITC 260 266 264 262 260 258 256 251 Down Sell KOTAKBANK 802 823 818 810 804 797 791 778 Down Sell LT 1479 1517 1504 1491 1478 1465 1452 1426 Up Buy LUPIN 1546 1587 1573 1559 1545 1531 1517 1489 Up Buy M&M 1418 1452 1441 1429 1418 1407 1396 1373 Down Sell MARUTI 5497 5633 5601 5549 5517 5465 5433 5349 Down Sell NTPC 154 159 158 156 154 153 151 148 Down Sell ONGC 255 262 259 257 253 251 248 243 Up Buy POWERGRID 177 183 181 179 177 175 173 169 Up Buy RELIANCE 1083 1107 1098 1090 1081 1073 1064 1047 Up Buy SBIN 256 261 259 258 256 254 253 250 Down Sell SUNPHARMA 782 797 793 788 784 778 775 766 Down Sell TATAMOTORS 554 564 560 557 553 550 546 539 Up Buy TATAMTRDVR 351 362 359 355 352 348 345 338 Down Sell TATAPOWER 77 82 79 78 76 75 73 70 Up Buy TATASTEEL 362 374 369 365 360 357 352 343 Up Buy TCS 2411 2519 2473 2442 2396 2365 2319 2242 Up Buy TECHM 466 483 479 473 469 462 458 448 Down Sell ULTRACEMCO 3997 4150 4078 4037 3965 3924 3852 3739 Up Buy WIPRO 482 489 486 484 480 478 474 468 Up Buy YESBANK 1180 1235 1214 1197 1176 1159 1138 1100 Up Buy ZEEL 525 540 534 530 524 519 514 504 Up Buy
- 5. Equity Bazaar SEBI Registered– Research Analyst Equities I Commodities I Currencies I Mutual Funds Contact Us www.choicebroking.in Kkunal Parar Sr. Research Associate kkunal.parar@choiceindia.com Vikas Chaudhari Research Associate vikas.chaudhari@choiceindia.com www.choicebroking.incustomercare@choiceindia.com Disclaimer This is solely for information of clients of Choice Broking and does not construe to be an investment advice. It is also not intended as an offer or solicitation for the purchase and sale of any financial instruments. Any action taken by you on the basis of the information contained herein is your responsibility alone and Choice Broking its subsidiaries or its employees or associates will not be liable in any manner for the consequences of such action taken by you. We have exercised due diligence in checking the correctness and authenticity of the information contained in this recommendation, but Choice Broking or any of its subsidiaries or associates or employees shall not be in any way responsible for any loss or damage that may arise to any person from any inadvertent error in the information contained in this recommendation or any action taken on basis of this information. Technical analysis studies market psychology, price patterns and volume levels. It is used to forecast future price and market movements. Technical analysis is complementary to fundamental analysis and news sources. The recommendations issued herewith might be contrary to recommendations issued by Choice Broking in the company research undertaken as the recommendations stated in this report is derived purely from technical analysis. Choice Broking has based this document on information obtained from sources it believes to be reliable but which it has not independently verified; Choice Broking makes no guarantee, representation or warranty and accepts no responsibility or liability as to its accuracy or completeness. The opinions contained within the report are based upon publicly available information at the time of publication and are subject to change without notice. The information and any disclosures provided herein are in summary form and have been prepared for informational purposes. The recommendations and suggested price levels are intended purely for trading purposes. The recommendations are valid for the day of the report however trading trends and volumes might vary substantially on an intraday basis and the recommendations may be subject to change. The information and any disclosures provided herein may be considered confidential. Any use, distribution, modification, copying, forwarding or disclosure by any person is strictly prohibited. The information and any disclosures provided herein do not constitute a solicitation or offer to purchase or sell any security or other financial product or instrument. The current performance may be unaudited. Past performance does not guarantee future returns. There can be no assurance that investments will achieve any targeted rates of return, and there is no guarantee against the loss of your entire investment. POTENTIAL CONFLICT OF INTEREST DISCLOSURE (as on date of report) Disclosure of interest statement – • Analyst interest of the stock /Instrument(s): - No. • Firm interest of the stock / Instrument (s): - No. Amit Pathania Research Associate amit.pathania@choiceindia.com 20th September, 2016 Kapil Shah Research Associate kapil.shah@choiceindia.com Kapil Shah Digitally signed by Kapil Shah DN: cn=Kapil Shah, o=Choice Equity Pvt Ltd, ou=Research Team, email=kapil.shah@choiceindia.com, c=US Date: 2016.09.20 09:12:14 +05'30'