1. Weekly Review
May 22, 2010
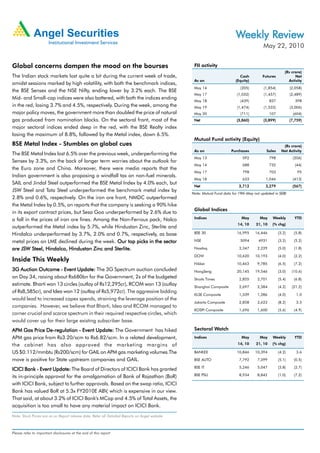
Global concerns dampen the mood on the bourses FII activity
(Rs crore)
The Indian stock markets lost quite a bit during the current week of trade, Cash Futures Net
As on (Equity) Activity
amidst sessions marked by high volatility, with both the benchmark indices,
May 14 (205) (1,854) (2,058)
the BSE Sensex and the NSE Nifty, ending lower by 3.2% each. The BSE
May 17 (1,032) (1,457) (2,489)
Mid- and Small-cap indices were also battered, with both the indices ending
May 18 (439) 837 398
in the red, losing 3.7% and 4.5%, respectively. During the week, among the May 19 (1,474) (1,533) (3,006)
major policy moves, the government more than doubled the price of natural May 20 (711) 107 (604)
gas produced from nomination blocks. On the sectoral front, most of the Net (3,860) (3,899) (7,759)
major sectoral indices ended deep in the red, with the BSE Realty index
losing the maximum of 8.8%, followed by the Metal index, down 6.5%.
Mutual Fund activity (Equity)
BSE Metal Index - Stumbles on global cues (Rs crore)
As on Purchases Sales Net Activity
The BSE Metal Index lost 6.5% over the previous week, underperforming the
May 13 592 798 (206)
Sensex by 3.3%, on the back of longer term worries about the outlook for
May 14 688 732 (44)
the Euro zone and China. Moreover, there were media reports that the
May 17 798 703 95
Indian government is also proposing a windfall tax on non-fuel minerals.
May 18 633 1,046 (413)
SAIL and Jindal Steel outperformed the BSE Metal Index by 4.0% each, but
Net 2,712 3,279 (567)
JSW Steel and Tata Steel underperformed the benchmark metal index by
Note: Mutual Fund data for 19th May not updated in SEBI
2.8% and 0.6%, respectively. On the iron ore front, NMDC outperformed
the Metal Index by 0.5%, on reports that the company is seeking a 90% hike
Global Indices
in its export contract prices, but Sesa Goa underperformed by 2.6% due to
a fall in the prices of iron ore fines. Among the Non-Ferrous pack, Nalco Indices May May Weekly YTD
14, 10 21, 10 (% chg)
outperformed the Metal index by 5.7%, while Hindustan Zinc, Sterlite and
Hindalco underperformed by 3.7%, 2.0% and 0.7%, respectively, as base BSE 30 16,995 16,446 (3.2) (5.8)
metal prices on LME declined during the week. Our top picks in the sector NSE 5094 4931 (3.2) (5.2)
are JSW Steel, Hindalco, Hindustan Zinc and Sterlite. Nasdaq 2,347 2,229 (5.0) (1.8)
DOW 10,620 10,193 (4.0) (2.2)
Inside This Weekly
Nikkei 10,463 9,785 (6.5) (7.2)
3G Auction Outcome - Event Update: The 3G Spectrum auction concluded HangSeng 20,145 19,546 (3.0) (10.6)
on Day 34, raising about Rs680bn for the Government, 2x of the budgeted Straits Times 2,855 2,701 (5.4) (6.8)
estimate. Bharti won 13 circles (outlay of Rs12,295cr), RCOM won 13 (outlay Shanghai Composite 2,697 2,584 (4.2) (21.2)
of Rs8,585cr), and Idea won 12 (outlay of Rs5,972cr). The aggressive bidding
KLSE Composite 1,339 1,286 (4.0) 1.0
would lead to increased capex spends, straining the leverage position of the
Jakarta Composite 2,858 2,623 (8.2) 3.5
companies. However, we believe that Bharti, Idea and RCOM managed to
KOSPI Composite 1,696 1,600 (5.6) (4.9)
corner crucial and scarce spectrum in their required respective circles, which
would cover up for their large existing subscriber base.
APM Gas Price De-regulation - Event Update: The Government has hiked
Price De-regulation Sectoral Watch
APM gas price from Rs3.20/scm to Rs6.82/scm. In a related development, Indices May May Weekly YTD
the cabinet has also approved the marketing margins of 14, 10 21, 10 (% chg)
US $0.112/mmbtu (Rs200/scm) for GAIL on APM gas marketing volumes.The BANKEX 10,846 10,394 (4.2) 3.6
move is positive for State upstream companies and GAIL. BSE AUTO 7,792 7,399 (5.1) (0.5)
BSE IT 5,246 5,047 (3.8) (2.7)
ICICI Bank - Event Update: The Board of Directors of ICICI Bank has granted
its in-principle approval for the amalgamation of Bank of Rajasthan (BoR) BSE PSU 8,934 8,842 (1.0) (7.2)
with ICICI Bank, subject to further approvals. Based on the swap ratio, ICICI
Bank has valued BoR at 5.3x FY2010E ABV, which is expensive in our view.
That said, at about 3.2% of ICICI Bank's MCap and 4.5% of Total Assets, the
acquisition is too small to have any material impact on ICICI Bank.
Note: Stock Prices are as on Report release date; Refer all Detailed Reports on Angel website
Please refer to important disclosures at the end of this report
2. Fundamental Focus | May 22, 2010
Focus
3G Auction Outcome
Event Update
Winner's Curse The company, however, missed out in the metro circles, as
the bidding crossed over 9-10x of the reserved price. The
The 3G Spectrum auction concluded on Day 34, raising about
average tele-density in the successfully subscribed circles stood
Rs680bn for the Government, 2x of the budgeted estimate.
at 51%, and offers enough room for growth in terms of an
Among the major bidders, Bharti won 13 circles (outlay of
untapped subscriber base.
Rs12,295cr), RCOM won 13 (outlay of Rs8,585cr), Idea won
12 (outlay of Rs5,972cr), Tata Tele won 9 (outlay of Rs5,864cr), Incidentally, Bharti and Idea had just three overlaps in terms
Vodafone won 9 (outlay of Rs11,618cr) and Aircel won 12 of successful circle wins, which make a potential case for future
(Outlay of Rs6,296cr). spectrum-sharing arrangements.
Bharti - Key Highlights Event Implications
Bharti has been declared the winner in 13 circles, including In a nutshell, we believe that the outcome is positive for RCOM
the key metro circles of Mumbai and Delhi. The total outlay and Idea, and neutral for Bharti. We believe that the aggressive
has been about Rs12.3bn, which has been the highest, though bidding would lead to increased capex spends, straining the
lower than the anticipated pan-India license valued at Rs16bn. leverage position of the companies in coming period. However,
we believe that Bharti, Idea and RCOM managed to corner
The company cornered key Metro circles, but missed on
crucial and scarce spectrum in their required respective circles.
few crucial circles such as Maharashtra and Gujarat.
Telecom operators will have to pay the spectrum payout in the
The winning circle covers about 65% of its total subscribers,
next 10 days; thus, we would see an increased interest burden
and a revenue market share of 69%
from 2QFY2010 onwards. Also, BWA auctions start on May
The 3G auction would lead to higher-than-estimated Capex;
21,2010, and with most of the telecom service providers
thus, this would increase the interest costs and may dilute the
participating in the auction (2 slots available and 11 bidders),
EPS by another 3%. However, we continue to remain positive,
the competition is likely to be fierce.
in view of its better financial placing, with a Debt-Equity of 0.1x
and net debt to EBIDTA of 0.3x. 3G Auction - Provisional Results
Players Circles won Payable
Amount Payable
RCOM - Key Highlights (Rs cr)
RCOM cornered 13 circle, with a strategic mix of Metros Bharti Airtel Delhi,Mumbai,Andhra Pradesh, 12,295.5
and C-Circles and an estimated outlay of Rs8.5bn. The company Karnataka,Tamil Nadu,UP(W),Rajasthan,
cornered many circles, despite its spare capacity, focusing on West Bengal,HP Bihar, Assam,North East,J&K
,
future opportunities. RCOM Delhi,Mumbai, Kolkata,Punjab,Rajasthan, MP, 8,585.0
The average tele-density in the successfully subscribed circles West Bengal,HP Bihar,Orissa,Assam,North East,J&K
,
stood at 61%. Estimated subscribers in GSM are about 40% of Idea Maharashtra, Gujarat, Andhra Pradesh, Kerala, 5,972.1
the total base of 102mn. On an aggregate subscriber base Punjab, Haryana, UP(E), UP(W), MP HP Bihar, J&K
, ,
(CDMA + GSM), the total revenue coverage in the winning Vodafone Delhi, Mumbai, Maharashtra, Gujarat, Tamil 11,617.9
territory stood at 41.1%. Nadu, Kolkata, Haryana, UP(E), West Bengal
Aircel Andhra Pradesh, Karnataka, Tamil Nadu, Kolkatta, 6,296.0
The incremental spend on 3G would further strain the
Kerala, Punjab,UP(E),West Bengal, Orissa, Assam,
company's balance sheet and would result in a further dilution
North East, J&K
in its profitability.
Tata Maharashtra, Gujarat, Karanataka, Kerala, Punjab, 5,864.3
Idea Cellular - Key Highlights Haryana, UP(W), Rajasthan, MP
Idea bagged 11 circles out of 22, with a strategy to support S-Tel HP Bihar, Orissa
, 337.7
the spectrum requirement in its strong territories. The total Total 50,968.4
revenue share coverage has been the highest at 81.5%. Source: DoT, Angel Research
Research Analyst - Rahul Jain/Vibha Salvi
For Private Circulation Only | Angel Broking Ltd: BSE Sebi Regn No : INB 010996539 / CDSL Regn No: IN - DP - CDSL - 234 - 2004 / PMS Regn Code: PM/INP00000154 6 Angel Securities Ltd:BSE: INB010994639/INF010994639 NSE: INB230994635/INF230994635 Membership numbers: BSE 028/NSE:09946 2
3. Fundamental Focus | May 22, 2010
Focus
APM Gas Price De-regulation
Event Update
Not a Pipe Dream Anymore overdue, this decision points towards the government's intent
to address the problems of subsidy- sharing and
The Government of India has approved a hike in the APM gas
under-recoveries. As the government is likely to consider the
price sold by ONGC and OIL from nomination blocks from
Kirit Parekh committee recommendations in the near-term, we
Rs3.20/scm to Rs6.82/scm. Prices are now at US $4.2/mmbtu
can also expect some of the recommendations to be accepted,
(pre-royalty adjusted) from US $1.9/mmbtu earlier. After the
which is likely to be positive for OMCs. Also, the improved
hike, APM prices are now in line with EGoM-determined gas
profitability of the upstream companies (ONGC, OIL and GAIL)
prices for the KG-D6. APM gas prices were last revised in 2005.
could prompt the government to change the subsidy-sharing
The move follows the Finance Ministry's suggestion of bringing
mechanism in favour of OMCs.
about pricing parity between APM and KG gas in one swift
move, rather than a phased increase in the APM gas prices as Impact Analysis
was proposed by the petroleum ministry. The prices will be
We expect ONGC to gain around Rs6,086cr on the Top-line
effective until March, 2014 (FY2014).
front and Rs4,047cr on the bottom-line front during FY2012E,
In a related development, the cabinet has also approved the thus translating into an EPS gain of Rs18.9/share. However, as
marketing margins of US $0.112/mmbtu (Rs200/scm) for GAIL we were building around a 15% increase in APM gas prices
on APM gas marketing volumes. Previous to this, GAIL did not over FY2010-12E, our Top-line and bottom-line for the company
receive any marketing margin on sales of APM gas. stands increased by Rs5,039cr and Rs3,351cr for FY2012E.
Thus, we expect an EPS accretion of Rs15.7/share on account
Impact on the Gas segment: We believe that the move is a step
of the gas price increase to Rs6.8/scm.
toward a uniform gas-pricing policy in the country, which is
likely to improve the competitiveness of imported LNG. This We expect OIL India to gain around Rs941cr on the Top-line
move could also encourage state-owned gas producers to front and Rs622cr on the bottom-line front during FY2012E,
develop marginal gas fields, which could increase domestic thus translating into an EPS gain of Rs25.9/share. Given the
gas production, and benefit the gas transportation companies fact that OIL India's net gas realisations were lower than that of
such as GAIL and GSPL, apart from the producers of the gas. ONGC's APM realisation, it stands to benefit more on account
of the increase in the gas prices to US $4.2/mmbtu.
On the negative side, City Gas Distribution Companies, IGL
and MGL, would be adversely impacted on account of the gas GAIL uses gas for its petrochemical and LPG operations;
price hike, as a large part of their supplies are at APM gas however, as it was not procuring APM gas, the company is not
prices. We believe that given the huge gross margins reported likely to be impacted by the gas price hike. Yet, we believe that
by these companies on account of the benefit of cheaper APM the levy of marketing margins on the APM gas increased GAIL's
gas in the past, it would be difficult for these companies to Top-line and profitability. According to our calculations, GAIL
maintain their margins. Moreover, given the fact that price of benefits by around Rs344cr on the Top-line front and Rs239cr
natural gas is indexed to administered retails selling price of on the bottom-line front, which translates into an EPS increase
LPG (14.2kg cylinder), price hike in the Domestic PNG segment of Rs1.9/share (FY2012E), on account of the levy of marketing
will be difficult. Currently, we await more clarity over the increase margins on the APM gas supplies.
in the prices of CNG for IGL before reviewing the stock. In case
Outlook and Valuation
of Gujarat Gas, given the fact that APM gas supplies form less
than 5.0% of its total gas sources, we do not expect the same to On account of earnings revision, we have upgraded ONGC
have any material impact on the company's financials. Target
from Neutral to Accumulate, with a Target price of
GAIL,
Rs1,233. In the case of GAIL, we have upgraded the target
Impact on the Oil marketing Segment: There is no direct
We
price by Rs27 to Rs580, and maintain a Buy on the stock. We
implication of the gas price hike on oil marketing companies.
do not have a rating on OIL India.
However, given the fact that the APM gas price hike was long
Research Analyst - Deepak Pareek/Amit Vora
For Private Circulation Only | Angel Broking Ltd: BSE Sebi Regn No : INB 010996539 / CDSL Regn No: IN - DP - CDSL - 234 - 2004 / PMS Regn Code: PM/INP00000154 6 Angel Securities Ltd:BSE: INB010994639/INF010994639 NSE: INB230994635/INF230994635 Membership numbers: BSE 028/NSE:09946 3
4. Fundamental Focus | May 22, 2010
Focus
ICICI Bank - Buy Price - Rs889
Target Price - Rs1,169
Event Update
Merger with Bank of Rajasthan branch would have to be atleast Rs2.5-3.5cr, while BOR's existing
Networth per branch is Rs1.3cr. If we add this additional capital
The Board of Directors of ICICI Bank has granted its in-principle
requirement to the acquisition price, then per branch acquisition
approval for the amalgamation of Bank of Rajasthan (BoR)
price would be about Rs8.8cr (assuming NW / branch of
with ICICI Bank, subject to further approvals. The swap ratio
Rs3.5cr). At this level, BOR's implied P/BV would work out to
has been fixed at 25:118 (25 shares of ICICI Bank for 118
about 2.5x, not taking into account the 2-3 years it may take to
shares of BoR).
scale up the productivity of these branches. Even on this basis,
As on March 31, 2009, Bank of Rajasthan had 463 branches the acquisition looks expensive relative to peers.
and 111 ATMs, total assets of Rs17,224cr, deposits of
That said, at about 3.2% of ICICI Bank's market cap and 4.5%
Rs15,187cr and advances of Rs7,781cr. It reported net profit
of Total Assets, in our view, the acquisition is too small to have
of Rs118cr in FY2009 and net loss of Rs10cr in the 9MFY2010.
any material impact on ICICI Bank. At Rs889, ICICI Bank is
In our view, the main benefit of the merger for ICICI Bank is
trading at 1.5x its FY2012E ABV (excl. subsidiaries) (without
BOR's branch network, concentrated in northern states like
factoring the acquisition into our estimates). We maintain a
Rajasthan (60% ot total branch network), Punjab, Haryana and
Target Price
Buy on the stock, with a Target Price of Rs1,169, representing
Delhi. Bank of Rajasthan was the only potential acquisition target
an upside of 31%.
amongst the old private sector banks to have such a presence,
while all its other peers have largely branch networks
concentrated in the south.
Outlook and Valuation
Based on the swap ratio, ICICI Bank has valued BoR at 5.3x
FY2010E ABV (at an 89% premium to yesterday's closing price),
which is expensive in our view, considering the poor profitability
and the recent asset-quality pressures and corporate governance
issues with the Bank of Rajasthan. Further, in such an acquisition,
there is downside risk from further NPAs from the target bank's
existing loan book.
Looking at it from a market cap per branch basis also, the
acquisition looks expensive, though less than it does in P/BV Valuations of Old private Banks
terms. As per our calculations, old private banks are trading at
Bank Market Cap. Branches MCap/Branch
an average MCap/branch of Rs5.4cr at current prices. Based
(Rs cr) (No.) (Rs cr)
on the swap ratio announced, the MCap/Branch paid for BoR
Bank of Rajasth. 3,039 463 6.6
works out to Rs6.6cr, which indicates a premium of 21% to the
City Union Bank* 1,326 202 6.6
peer average. If we compare the HDFC Bank and CBoP deal in
Dhanalaksh.Bank 944 265 3.6
FY2008, HDFC Bank had paid a consideration of Rs24.1cr per
Federal Bank 5,256 672 7.8
branch for CBoP .
Karnataka Bank 2,033 458 4.4
Keeping aside the risk of further book value erosion from fresh Karur Vysya Bank* 2,770 320 8.7
NPA accretion post-acquisition, even the existing capital Lak. Vilas Bank 775 270 2.8
adequacy of BOR is on the lower side. Moreover, in our view, South Ind.Bank 1,645 580 2.8
on a higher level of business per branch (from Rs37cr assets / Average 5.4
branch at present to about 50cr), the normalised Networth per Source: Company, Angel Research; Note: *As on March 31, 2009
Research Analyst - Vaibhav Agrawal/Amit Rane
For Private Circulation Only | Angel Broking Ltd: BSE Sebi Regn No : INB 010996539 / CDSL Regn No: IN - DP - CDSL - 234 - 2004 / PMS Regn Code: PM/INP00000154 6 Angel Securities Ltd:BSE: INB010994639/INF010994639 NSE: INB230994635/INF230994635 Membership numbers: BSE 028/NSE:09946 4
5. Fundamental Focus | May 22, 2010
Focus
Crompton Greaves - Buy Price - Rs243
Target Price - Rs307
4QFY2010 Result Update
Target Price - Rs356
Performance Highlights (Rs63cr). For FY2010, the net profit grew by 52.1% yoy to
Rs248cr (Rs163cr).
Crompton Greaves reported another strong quarterly
performance, with an impressive 39.9% yoy growth in its Outlook and Valuation
adjusted bottom-line to Rs271cr, which was better than our
Crompton Greaves is one of the leading players in the power
estimates. Although the company had a muted top-line
transmission and distribution space in the country. The company
performance, clocking a mere 1.9% yoy growth, it made up for
has a diversified business presence, with revenues accruing from
this with a wider-than-expected expansion in operating margins.
multiple streams that are spread across geographies. Besides,
PA
Strong operating performance - consolidated PAT surges by over the past few years, the company has made several strategic
~40%, beats expectations: On the consolidated level, Crompton overseas acquisitions, which, in addition to plugging in
Greaves posted a muted top-line growth of 1.9% yoy to technology gaps, have provided the necessary scale to its
Rs2,508cr (Rs2,460cr) for 4QFY2010. Although the standalone operations.
business posted a healthy top-line growth of 18.8% yoy,
During FY2010-12E, we expect the company to register a
international operations negated the effect, with a 19.0% yoy
Top-line and Bottom-line CAGR of 11.5% and 7.1%, respectively.
de-growth in its revenues (of which ~9% due to currency
At Rs243, the stock is quoting at 17.7x and 15.8x FY2011E
movement). For FY2010, the consolidated top-line grew by 4.6%
and FY2012E EPS, respectively, which we believe is attractive
yoy to Rs9,141cr (Rs8,737cr).
as compared to its peers, ABB and Areva T&D.
The consolidated EBITDA margin, however, expanded by 269bp Target Price
We maintain our Buy recommendation, with a Target Price
to 16.1% (13.4%), driven by higher operating margins for both of Rs307.
the standalone and international operations. Though the raw
material cost increased 204bp as a % of net sales, it was more
than made up for by the combination of lower other expenses
and employee costs. Notably, as the margin improvement
during the year was majorly led by operational efficiencies, the
management seemed confident of maintaining its margins at Key Financials (Consolidated)
a consolidated level for FY2011E. Y/E March (Rs cr) FY2009 FY2010E FY2011E FY2012E
Higher operating margins, coupled with a lower tax rate (due Net Sales 8,737 9,141 10,068 11,354
to the lower tax burden on international operations), led to an % chg 27.9 4.6 10.1 12.8
impressive 39.9% yoy growth in the adjusted net profit to Profit
Adj. Net Profit 560 860 882 986
Rs271cr (Rs194cr). For the full year FY2010, the consolidated
% chg 37.7 53.6 2.5 11.8
adjusted net profit grew 47.3% yoy to Rs825cr (Rs560cr).
EBITDA (%) 11.4 14.0 13.7 13.3
International business - sales under pressure, but margins
EPS (Rs) 8.7 13.4 13.7 15.4
improve by 463bp: The international business continues to face
P/E (x) 27.8 18.1 17.7 15.8
pressure, with the top-line falling sharply by 19.0% yoy to
Rs890cr (Rs1,098cr) for 4QFY2010, which was primarily driven P/BV (x) 8.6 6.3 4.9 3.9
by the 18.5% yoy de-growth in the revenues of the international RoE (%) 36.1 39.9 30.9 27.3
power systems segment. Nonetheless, the EBITDA margin for RoCE (%) 27.5 31.5 29.0 27.1
the international business witnessed an expansion of 463bp to
EV/Sales (x) 1.8 1.7 1.5 1.3
14.8% (10.2%), due to lower raw material costs along with
lower other expenses. Higher margins, coupled with a lower EV/EBITDA (x) 15.7 12.0 10.8 9.5
tax rate, resulted in a net profit growth of 27.8% yoy to Rs81cr Source: Company, Angel Research, Price as on May 18, 2010
Research Analyst - Puneet Bambha
For Private Circulation Only | Angel Broking Ltd: BSE Sebi Regn No : INB 010996539 / CDSL Regn No: IN - DP - CDSL - 234 - 2004 / PMS Regn Code: PM/INP00000154 6 Angel Securities Ltd:BSE: INB010994639/INF010994639 NSE: INB230994635/INF230994635 Membership numbers: BSE 028/NSE:09946 5
6. Fundamental Focus | May 22, 2010
Focus
Deccan Chronicle Holdings - Buy Price - Rs142
Target Price - Rs193
4QFY2010 Result Update
Target Price - Rs356
Performance Highlights Rs43 as the per share value for DCHL's IPL team. However, on
account of the uncertainty arising from the recent team auctions,
Political turmoil in AP affects sales; Top-line below our estimates:
Top
op-line
as covered in certain media reports, we have adopted a cautious
Deccan Chronicle Holdings Ltd (DCHL) reported a muted
approach, giving a 25% discount to our earlier per share price.
Top-line growth of 6.3% yoy to Rs191.7cr (Rs180.3cr),affected
Thus, we have arrived at a value of Rs32 per share for DCHL's
by the political turmoil in Andhra Pradesh (Telangana region).
IPL team.
The company reported a ~6% yoy growth in advertisement
revenue to Rs177cr (Rs166cr) and a flattish growth in circulation We value DCHL on an SOTP Basis and maintain a Buy
SOTP Buy.
revenue to Rs15cr (Rs14cr). However, Target Price
However, we have revised our Target Price downward to Rs193
(Rs216 earlier), based on: 1) Rs161 per share value for its
Gross Margin expansion continues; Earnings decline due to
Print
core Print Business (12x FY2012E Standalone Earnings), and
Tax
higher Tax rate: On the Operating front, DCHL registered a
Team
2) Rs32 per share value for its IPL Team (25% discount to the
significant Margin expansion of 1,900bp yoy, driving a 92.6%
earlier,
per share value calculated earlier, based on the US $225mn
yoy growth in EBITDA to Rs81.3cr (Rs42.2cr). The company
floor price set for the auction of new teams).
continued to benefit from benign newsprint prices and rupee
appreciation, with the raw material cost this quarter showing a Moreover, there exist upside risks to our valuation, on account
decline of 2,752bp yoy to Rs74.7cr (Rs119.9cr). However, the of the following:
staff costs and other expenditure for the company increased by
Higher Gate/Sponsorship Revenues: Addition of two new
247bp yoy and 605bp yoy (low base effect) to Rs18.1cr and
franchises would lead to an increase in the number of matches,
Rs17.6cr, respectively, limiting any further Margin expansion.
from 59 to 94 matches.
DCHL's reported weak Earnings for the quarter (on a standalone
Revision in Media Telecast Rights: After the auction, we expect
basis), which registered a decline of 20.2% yoy to Rs6.5cr
the IPL to re-work media telecast rights with Sony (to factor in
(Rs8.1cr), on account of the weak Top-line growth, a 1,883bp
the higher number of matches).
yoy jump in the Tax rate to 89.9% (71.1%), and a 32.9% yoy
increase in depreciation to Rs12.6cr (Rs9.5cr).
Key Financials (Standalone)
Outlook and Valuation
Y/E March (Rs cr) FY2009 FY2010E FY2011E FY2012E
After the 4QFY2010 results, we have revised our Top-line
Net Sales 815 892 991 1,113
estimates downward by 4-7% for FY2011E and FY2012E to
% chg 4.2 9.5 11.0 12.4
model in: 1) flattish circulation revenue, and 2) slow growth in
advertisement revenue (due to rising competition in the Chennai Profit
Net Profit (Adj) 140.1 261.1 286.1 325.4
market from TOI). % chg (48.5) 86.4 9.6 13.7
During FY2010-12E, we expect DCHL to post a CAGR of 11.7% OPM (%) 32.9 50.7 48.5 47.7
in its standalone revenues, driven largely by a 12.1% CAGR in EPS (Rs) 5.7 10.8 11.8 13.4
advertising revenues and a 6% CAGR in circulation revenues, P/E (x) 24.8 13.1 12.0 10.6
on account of a higher contribution from the Bangalore edition.
P/BV (x) 3.0 2.6 2.3 2.0
In terms of Earnings, we have factored an 11.6% CAGR during
RoE (%) 12.2 19.7 18.9 19.1
the period, driven largely by Top-line growth, as we expect
Margins to dip marginally as newsprint prices harden (we have RoCE (%) 14.9 23.7 23.5 24.2
modeled in ~10% rise in the newsprint). EV/Sales (x) 4.1 3.6 3.1 2.6
Based on the floor price of US $225mn for the recent, new EV/EBITDA (x) 12.5 7.1 6.4 5.5
team auctions (Kochi team and Pune team), we had calculated Source: Company, Angel Research, Price as on May 14, 2010
Research Analyst - Anand Shah/Chitrangda Kapur
For Private Circulation Only | Angel Broking Ltd: BSE Sebi Regn No : INB 010996539 / CDSL Regn No: IN - DP - CDSL - 234 - 2004 / PMS Regn Code: PM/INP00000154 6 Angel Securities Ltd:BSE: INB010994639/INF010994639 NSE: INB230994635/INF230994635 Membership numbers: BSE 028/NSE:09946 6
7. Fundamental Focus | May 22, 2010
Focus
Graphite India - Buy Price - Rs99
Target Price - Rs117
Target Price - Rs356
4QFY2010 Result Update
Performance Highlights Management expects the graphite electrode contracts to
remain quarterly, till there is volatility in prices. Once there is
Graphite India's (GIL) 4QFY2010 Sales growth of 66% yoy, on
stability in prices and buyers expect secular firming of prices,
a Standalone basis, came in line with our estimates. However,
the contracts are expected to return to annual basis.
FY2010 Sales (Consolidated) fell slightly more than our
expectation due to the lower-than-expected production at the Currently, expansion at the Durgapur facility is progressing
company's Nuremberg facility. Nevertheless, going forward, we slowly. However, it is expected to pick up from 1Q or 2Q of
believe that the company is well placed on account of FY2011E to get completed within the targeted time frame.
strengthening demand for graphite electrodes from the Steel
Outlook and Valuation
industry and large capacity expansion in the Durgapur plant.
We maintain our Earnings estimates for FY2011E and FY2012E. Going ahead, we expect the demand for graphite electrodes to
be strong as steel manufacturing through the EAF route picks
Muted Sales, Strong Margins: FY2010 Sales (Consolidated) up and the effect of de-stocking of inventories reverses. The
fell 10.1%, much lower than our estimates, mainly because of company's move to increase capacity at the Durgapur facility
the 50% drop in production at its German facility. Production at by 22,000MT/year as against the earlier plan to increase it by
the Indian plants fell 24% yoy. However, OPM for FY2010 10,500MT/year would provide a major boost to the company's
increased to a strong 29.4% (24.4%) owing to higher future growth prospects. Margins are expected to stay strong at
realizations. Interest cost for the year fell to Rs14.5cr (Rs35.1cr) over 24% levels during the next few years. Overall, we expect
mainly due to lower working capital requirements. GIL to register a CAGR of 19.1% in Top-line and 8.2% in Profit
Consequently, PAT for the year came in line with our estimate over FY2010-12E. At Rs99, the stock is trading at 1.2x and
at Rs235cr. 1.1x FY2011E and FY2012E P/BV, respectively. We maintain a
Key Highlights Target Price
Buy on the stock, with a Target Price of Rs117.
For 4QFY2010, the company's Sales grew at an impressive
66.5% yoy and 21.4% qoq albeit on a low base due to the
slowdown in 4QFY2009. In 4QFY2010, OPM at 29.0% fell
Key Financials (Consolidated)
from the high of 36.8% in 3QFY2010. For FY2010, Standalone
Y/E March (Rs cr) FY2009 FY2010 FY2011E FY2012E
OPM stood at the historical high of 33.5%. Globally graphite
electrode prices increased in CY2009 on higher needle coke Net Sales 1,498 1,347 1,600 1,910
prices, but other raw material and manufacturing costs fell % chg 12.6 (10.1) 18.8 19.3
during the year. Going ahead, OPMs are expected to further Profit
Net Profit 237 235 239 275
correct to more reasonable levels of around 24.0%. PAT Margin
% chg 66.4 (0.9) 1.6 15.1
for 4QFY2010 was 16.4% compared to 22.6% in 3QFY2010.
EBITDA Margin (%) 24.4 29.4 24.4 24.2
Key takeaways from Management discussion
FDEPS (Rs) 11.6 10.7 12.2 14.0
Global leaders like SGL and GrafTech have shown more P/E (x) 8.3 9.0 7.9 6.8
aggression to win orders in the last few months to ensure better
P/BV (x) 1.5 1.3 1.2 1.1
capacity utilisation. Consequently, graphite electrode prices have
declined by 8-10% over the last few months. RoE (%) 25.3 19.6 16.7 16.6
RoACE (%) 20.4 20.4 19.5 20.2
Management expects downside in pricing to be minimal,
3-4% at most, over the next couple of quarters. Post that, as EV/Sales (x) 1.1 1.2 1.3 1.0
demand for graphite electrodes increases, capacity utilisation EV/EBITDA (x) 4.6 4.1 5.3 4.2
of the global players will increase and prices would start firming Source: Company, Angel Research, Price as on May 14, 2010
up again.
Research Analyst - Jai Sharda
For Private Circulation Only | Angel Broking Ltd: BSE Sebi Regn No : INB 010996539 / CDSL Regn No: IN - DP - CDSL - 234 - 2004 / PMS Regn Code: PM/INP00000154 6 Angel Securities Ltd:BSE: INB010994639/INF010994639 NSE: INB230994635/INF230994635 Membership numbers: BSE 028/NSE:09946 7
8. Fundamental Focus | May 22, 2010
Focus
JK Lakshmi Cement - Buy Price - Rs65
Target Price - Rs86
4QFY2010 Result Update
Target Price - Rs356
Performance Highlights by FY2012E, which will be sufficient to meet close to 90% of its
power requirement on the expanded capacity of 8mtpa. The
JK Lakshmi Cement (JKLC) reported a healthy 21.1% yoy growth
company expects to sell 25MW (including the 21MW procured
in its net sales to Rs441cr during 4QFY2010, primarily on
from VS Lignite power) of surplus power from FY2011E onwards.
account of an impressive growth in the sales volume. The
company's sales volume during the quarter rose by 21% yoy to Outlook and Valuation
1.41mn tonnes, aided by a capacity increase and robust
The stock trades at a P/E of 4.1x, at an EV/EBITDA of 3.9x and
demand. However, on the operating front, the company's
at an EV/tonne of US $65/tonne, according to its FY2012E
margins declined by 756bp yoy, on account of a surge in raw
estimates. On the valuation front, we have valued JK Lakshmi
material costs (up 48.3% yoy) and other expenses (up 72.8%
Cements at an average of a Target EV/EBITDA of 4x and an
yoy). The company reported a 32.6% decline in its Bottom-line
EV/tonne of US $60/tonne, which is at a discount to the
to Rs70cr, on account of higher depreciation and interest costs.
replacement cost, to arrive at a fair value of Rs86. We maintain
Higher raw material and interest costs drag Net Profit down
Profit a Buy recommendation on the stock.
by 32.6% yoy: JKLC's operating profit declined by 8.7% yoy to
Rs102.3cr, despite a 21.1% growth in net sales to Rs441cr. The
operating profit was marred by an increase in raw material,
freight and other expenses, although the realisations remained
flat yoy. The company had also purchased high cost clinker
from external sources during the quarter. The interest and
depreciation costs rose substantially during the quarter on a
yoy basis, and stood at Rs10.7cr (net interest income of Rs2.1cr)
and Rs21.3cr (Rs14.1cr), respectively.
Operational Highlights
Key Financials
The company's per tonne cement realisation was flat yoy during
the quarter, although it was up by 3% qoq. The company's Y/E March (Rs cr) FY2009 FY2010E FY2011E FY2012E
average realisation during the quarter stood at Rs3,130/tonne. Net Sales 1,225 1,491 1,376 1,570
The company's key markets in Western and Northern India % chg 10.6 21.7 (7.7) 14.1
experienced robust demand during the quarter, which resulted Profit
Net Profit 179 241 154 192
in the prices remaining at healthy levels. The raw material costs
% chg (20.2) 35.0 (36.3) 25.1
per tonne were up by 22.5% yoy and stood at Rs659. Operating
profit per tonne stood at Rs726 during the quarter, down by OPM (%) 25.4 28.5 24.4 26.1
24.7% yoy and by 5.2% qoq. EPS (Rs) 14.6 19.7 12.5 15.7
Capacity addition on track P/E (x) 4.4 3.3 5.2 4.1
P/BV (x) 1.0 0.8 0.7 0.6
The company is in the process of expanding its cement and
power capacities. JKLC, which currently has a capacity of RoE (%) 24.2 25.7 13.9 15.4
5.4mtpa, is setting up a 2.7mtpa green-field cement plant in RoCE (%) 16.6 21.2 13.0 13.7
Chattisgarh, at a cost of Rs1,200cr. The Chattisgarh plant is EV/Sales (x) 1.0 0.8 1.0 1.0
expected to be operational by December 2012, and will take
EV/EBITDA (x) 3.7 2.9 4.1 3.9
the company's total cement capacity to 8mtpa. It is also planning
to increase its total captive power capacity from 36MW to 66MW EV/Tonnes (US $) 55 57 64 65
Source: Company, Angel Research, Price as on May 19, 2010
Research Analyst - Rupesh Sankhe/V Srinivasan
For Private Circulation Only | Angel Broking Ltd: BSE Sebi Regn No : INB 010996539 / CDSL Regn No: IN - DP - CDSL - 234 - 2004 / PMS Regn Code: PM/INP00000154 6 Angel Securities Ltd:BSE: INB010994639/INF010994639 NSE: INB230994635/INF230994635 Membership numbers: BSE 028/NSE:09946 8
9. Fundamental Focus | May 22, 2010
Focus
McNally Bharat Engineering - Buy Price - Rs312
Target Price - Rs486
Target Price - Rs356
4QFY2010 Result Update
Performance Highlights book.
McNally Bharat Engineering (MBE)'s 4QFY2010 Sales and Adj. McNally Sayaji plans to invest Rs65cr in setting up a new
PAT growth of 19% and 142%, respectively, was ahead of our facility for its product, while the Parent MBE plans to have a
estimates. MBE's strong performance was on the back of a higher capex of Rs45cr for FY2011E.
EBITDA margin and lower interest outflow. The major
A decision on the rights issue would be taken by June 2010.
improvement was on the EBITDA front, where margins expanded
by 165bp, from 5.6% (4QFY2009) to 7.3% (4QFY2010). Overall, the management has outlined a revenue target of
Interest costs for the quarter declined by 55% yoy. Overall, MBE's around Rs5,000cr by FY2013E, of which MBE standalone would
FY2010 performance was ahead of our expectations. stand at Rs4,000cr, MSE at Rs600-700cr and the CMT group
(international subsidiary) at Rs500cr.
Strong, execution-led growth: MBE's (standalone) sales for the
Strong,
quarter grew by 19%; however, its EBITDA grew by 54%, on the Outlook and Valuation
back of better execution and cost control. Overall interest costs We believe that an improving economic scenario (indicated by
for the quarter declined by 55% yoy, due to better working capital a revival in the IIP), the continuous government focus on
management and a reduction in the average cost of borrowing. infrastructure spend and a pick-up in private capex augurs well
The overall Adj. PAT for the quarter increased by 142% to Rs24cr for the companies providing EPC solutions for the core sectors
from Rs10cr (4QFY2009). For the full year FY2010, standalone of the economy. MBE's current consolidated order book stands
sales grew by 50% to Rs1,448cr (from Rs968cr in FY2009), at Rs5,110cr (2.6x FY2010 revenue). Going ahead, over
while the EBITDA margin improved by 80bp to 6.8% (from 6%). FY2010-12E, we estimate the company to register a CAGR of
Strong order inflow continues: MBE's Order inflow has been 28% and 35% in Sales and Profit, respectively. We maintain
on the rise, having increased from Rs700cr in FY2005 to Target
our Buy recommendation on the stock, with a revised Target
Rs3,334cr in FY2009, posting a CAGR of 48% over the Price of Rs486.
mentioned period. For FY2010, the company ended the year
with an order book of Rs4,550cr, while we estimate that on a
consolidated basis it stood at Rs5,150cr. The management has Key Financials (Consolidated)
further indicated that bids for order worth Rs1,300cr have been Y/E March (Rs cr) FY2009 FY2010E FY2011E FY2012E
placed and the outcome of the same is expected during the year. Net Sales 1,115 2,019 2,501 3,332
Key takeaways from the Conference call % chg 101.0 81.1 23.9 33.2
Profit
Adj Profit 39.7 65.0 93.6 118.7
The management expects the Power sector to be the key
growth driver for the company over the next few years. The key % chg 91.1 63.9 44.0 26.8
opportunity areas are in Material handling solutions (which Adj FDEPS (Rs) 12.8 20.9 27.4 34.7
include coal handling, coal washer, desalination plant and EBITDA Margin (%) 9.8 7.9 9.7 9.6
RO plant).
P/E (x) 24.5 14.9 11.4 9.0
After bagging 2 BoP-based orders (770 MW), MBE is P/BV (x) 4.7 3.6 2.7 2.1
qualified to bid for all ranges of BoP projects across the power
RoE (%) 21.7 27.2 28.0 26.1
sector. BoP projects have margins in the region of 7-8%;
RoACE (%) 29.4 27.0 31.0 30.3
however, the margin improves once a company starts executing
a higher range of projects. EV/Sales (x) 1.0 0.6 0.5 0.4
EV/EBITDA (x) 10.6 7.5 5.5 4.6
Going ahead, MBE plans to build up its skill set in Cement,
Source: Company, Angel Research, Price as on May 18, 2010
and the Oil and Gas industry, as it plans to diversify its order
Research Analyst - Sageraj Bariya
For Private Circulation Only | Angel Broking Ltd: BSE Sebi Regn No : INB 010996539 / CDSL Regn No: IN - DP - CDSL - 234 - 2004 / PMS Regn Code: PM/INP00000154 6 Angel Securities Ltd:BSE: INB010994639/INF010994639 NSE: INB230994635/INF230994635 Membership numbers: BSE 028/NSE:09946 9