Interimreport1 January–31 March2024 Elo Mutual Pension Insurance Company
Weekly Review
1. Weekly Review
August 28, 2010
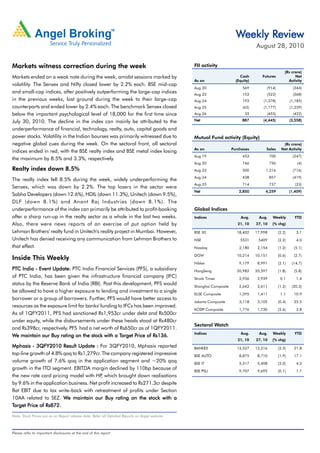
Markets witness correction during the week FII activity
(Rs crore)
Markets ended on a weak note during the week, amidst sessions marked by Cash Futures Net
As on (Equity) Activity
volatility. The Sensex and Nifty closed lower by 2.2% each. BSE mid-cap
Aug 20 569 (914) (344)
and small-cap indices, after positively outperforming the large-cap indices Aug 23 153 (522) (368)
in the previous weeks, lost ground during the week to their large-cap Aug 24 193 (1,378) (1,185)
counterparts and ended lower by 2.4% each. The benchmark Sensex closed Aug 25 (62) (1,177) (1,239)
below the important psychological level of 18,000 for the first time since Aug 26 33 (455) (422)
July 30, 2010. The decline in the index can mainly be attributed to the Net 887 (4,445) (3,558)
underperformance of financial, technology, realty, auto, capital goods and
power stocks. Volatility in the Indian bourses was primarily witnessed due to Mutual Fund activity (Equity)
negative global cues during the week. On the sectoral front, all sectoral (Rs crore)
As on Purchases Sales Net Activity
indices ended in red, with the BSE realty index and BSE metal index losing
Aug 19 453 700 (247)
the maximum by 8.5% and 3.3%, respectively.
Aug 20 746 750 (4)
Realty index down 8.5% Aug 23 500 1,216 (716)
Aug 24 438 857 (419)
The realty index fell 8.5% during the week, widely underperforming the
Aug 25 714 737 (23)
Sensex, which was down by 2.2%. The top losers in the sector were
Net 2,850 4,259 (1,409)
Sobha Developers (down 12.6%), HDIL (down 11.3%), Unitech (down 9.5%),
DLF (down 8.1%) and Anant Raj Industries (down 8.1%). The
underperformance of the index can primarily be attributed to profit-booking Global Indices
after a sharp run-up in the realty sector as a whole in the last two weeks. Indices Aug. Aug. Weekly YTD
Also, there were news reports of an exercise of put option held by 21, 10 27, 10 (% chg)
Lehman Brothers' realty fund in Unitech's reality project in Mumbai. However, BSE 30 18,402 17,998 (2.2) 3.1
Unitech has denied receiving any communication from Lehman Brothers to NSE 5531 5409 (2.2) 4.0
that effect. Nasdaq 2,180 2,154 (1.2) (5.1)
DOW 10,214 10,151 (0.6) (2.7)
Inside This Weekly
Nikkei 9,179 8,991 (2.1) (14.7)
PTC India - Event Update: PTC India Financial Services (PFS), a subsidiary
PTC HangSeng 20,982 20,597 (1.8) (5.8)
of PTC India, has been given the infrastructure financial company (IFC) Straits Times 2,936 2,939 0.1 1.4
status by the Reserve Bank of India (RBI). Post this development, PFS would Shanghai Composite 2,642 2,611 (1.2) (20.3)
be allowed to have a higher exposure to lending and investment to a single
KLSE Composite 1,395 1,411 1.1 10.9
borrower or a group of borrowers. Further, PFS would have better access to
Jakarta Composite 3,118 3,105 (0.4) 22.5
resources as the exposure limit for banks' funding to IFCs has been improved.
KOSPI Composite 1,776 1,730 (2.6) 2.8
As of 1QFY2011, PFS had sanctioned Rs1,953cr under debt and Rs500cr
under equity, while the disbursements under these heads stood at Rs480cr
Sectoral Watch
and Rs398cr, respectively. PFS had a net worth of Rs650cr as of 1QFY2011.
Indices Aug. Aug. Weekly YTD
Target Price
We maintain our Buy rating on the stock with a Target Price of Rs136.
21, 10 27, 10 (% chg)
Mphasis - 3QFY2010 Result Update : For 3QFY2010, Mphasis reported BANKEX 12,527 12,216 (2.5) 21.8
top-line growth of 4.8% qoq to Rs1,279cr. The company registered impressive BSE AUTO 8,875 8,710 (1.9) 17.1
volume growth of 7.6% qoq in the application segment and ~20% qoq BSE IT 5,517 5,408 (2.0) 4.3
growth in the ITO segment. EBITDA margin declined by 110bp because of BSE PSU 9,707 9,695 (0.1) 1.7
the new rate card pricing model with HP which brought down realisations
,
by 9.6% in the application business. Net profit increased to Rs271.3cr despite
flat EBIT due to tax write-back with retreatment of profits under Section
10AA related to SEZ. We maintain our Buy rating on the stock with a
Price
Target Price of Rs872.
Note: Stock Prices are as on Report release date; Refer all Detailed Reports on Angel website.
Please refer to important disclosures at the end of this report
2. Fundamental Focus | August 28, 2010
Focus
PTC India - Buy Price - Rs119
Target Price - Rs136
Event Update
PTC India Financial Services gets IFC status aggregating to ~Rs1,510cr to 22 power projects. During the
PTC India Financial Services (PFS), a subsidiary of PTC India, year, the company also started upfront financing for
has been given the infrastructure financial company (IFC) status carbon credits.
by the Reserve Bank of India (RBI). The RBI had earlier classified Outlook and Valuation
non-banking financial companies (NBFCs) under three
Following the commissioning of new power projects, we expect
categories, namely asset finance companies, loan companies
PTC India to register a 32.7% CAGR in its top line over
and investment companies. Recently, the RBI introduced a fourth
FY2010-12E. We estimate the company's bottom line to register
category of NBFCs, i.e. IFCs. Post this development, PFS would
a 43.1% CAGR over FY2010-12E.
be allowed to have a higher exposure to lending and investment
to a single borrower or a group of borrowers. Further, PFS would At Rs119, PTC India is trading at 23.5x FY2011E and 18.2x
have better access to resources as the exposure limit for banks' FY2012E earnings. We have arrived at an SOTP fair value of
funding to IFCs has been improved. Rs136 for PTC India, wherein we have assigned P/E of 10x
FY2012E earnings from the core trading business
About PFS: PFS is a 77.6% subsidiary of PTC India. The company
PFS:
(Rs65.2/share), while investments in PFS, Teesta Urja, Krishna
was set up in FY2008 as a special purpose investment vehicle
Godawari and Athena Energy Ventures have been valued at
primarily to make both equity and debt investments in power
P/BV of 1x FY2012E (Rs49.4/share). The cash and liquid
projects in the areas of generation, transmission and distribution.
investments in the company's books are valued at P/BV of 1x
As of 1QFY2011, PFS had sanctioned Rs1,953cr under debt
FY2012E (Rs21.1/share). Accordingly, we maintain our Buy
and Rs500cr under equity, while the disbursements under these
recommendation on the stock.
heads stood at Rs480cr and Rs398cr, respectively. PFS had a
net worth of Rs650cr as of 1QFY2011.
Implications of the development
PFS can now raise ECBs up to 50% of its net worth through
the automatic route and raise funds through tax-free
Key Financials (Standalone)
infrastructure bonds.
Y/E March (Rs cr) FY2009 FY2010 FY2011E FY2012E
Will be able to take up additional lending exposure, up to
Net Sales 6,529 7,770 10,906 13,698
5% of its owned funds, in case of a single borrower and 10%
for a group of borrowers. % chg 67.1 19.0 40.4 25.6
Profit
Net Profit 90.8 93.9 148.9 192.2
Can raise higher resources as banks have been allowed
lesser risk weightage on lending made to IFCs. Exposure of % chg 86.5 3.4 58.6 29.1
banks has recently been increased to 20% of its capital funds OPM (%) 0.4 0.8 1.3 1.3
w.r.t IFC from the earlier 15%. EPS (Rs) 4.0 3.2 5.1 6.5
Cost of borrowings will be reduced by ~50bp. P/E (x) 29.7 37.2 23.5 18.2
PFS financial performance in FY2010: PFS recorded net sales P/BV (x) 1.8 1.7 1.6 1.5
of Rs49cr in FY2010, up 372% on a yoy basis. The company's RoE (%) 6.0 5.2 7.0 8.6
EBITDA and PBDT rose by 487% and 323% to Rs43.6cr and RoCE (%) 1.3 3.2 6.0 7.3
Rs36.7cr, respectively. Growth was largely driven by higher level
EV/Sales (x) 0.3 0.3 0.2 0.2
of loan disbursement (both term loan and mezzanine/
short-term loan) to power projects and increased fee-based EV/EBITDA (x) 79.5 34.9 18.5 16.4
Source: Company, Angel Research; Price as on August 23, 2010
income. During FY2010, the company sanctioned funds
Research Analyst - Rupesh Sankhe/V Srinivasan
For Private Circulation Only | Angel Broking Ltd: BSE Sebi Regn No : INB 010996539 / CDSL Regn No: IN - DP - CDSL - 234 - 2004 / PMS Regn Code: PM/INP00000154 6 Angel Securities Ltd:BSE: INB010994639/INF010994639 NSE: INB230994635/INF230994635 Membership numbers: BSE 028/NSE:09946 2
3. Fundamental Focus | August 28, 2010
Focus
Mphasis - Buy Price - Rs623
Target Price - Rs872
3QFY2010 Result Update
Performance Highlights company's ITO business to be the major beneficiary of HP's
restructuring exercise. Further, we expect the ITO business to
Y/E March 3QFY10 2QFY10 % chg 3QFY10 % chg
(Rs cr) (qoq) (yoy)
scale up due to the acquisition of Fortify Infrastructure, growing
Net Revenue 1,279 1,221 4.8 1,106 15.7 at a scorching pace of 7% CQGR over 3QFY2010-4QFY2012E,
EBITDA Margin (%) 24.7 25.8 (1.1) 26.4 (1.7) followed by the application business, which will likely grow at a
PAT 271 267 1.5 229 18.3 5% CQGR over the same period.
Source: Company, Angel Research
Going ahead, we expect the company to achieve steady volume
Robust volume steals the show: Mphasis registered impressive growth of 4.5% CQGR, with stable pricing across its business
volume growth of 7.6% qoq in the application segment and segments. With the new rate card in place for its application
~20% qoq growth in the ITO segment (including revenue from business, gross margin will shift its orbit to the lower side, but
Fortify Infrastructure, which was acquired during the quarter). strong growth and robust profitability in the ITO segment will
During the quarter, client addition stood high at 22, spanning provide some cushion. With fixed rate card in place for the ITO
across the BFS, manufacturing and healthcare verticals. Net segment, cost pressures will play out and EBIT margin will slip.
employee addition stood at 1,156, with majority of additions PAT is expected to increase at a 12% CAGR over FY2009-12E
on the lateral side highlighting a strong demand landscape. on the back of in-the-money hedges as well as yield from a
EBITDA margin declined by 110bp because of the new rate strong cash position setting off increased tax rates from 11%
card pricing model with HP which brought down realisations
, (FY2010) to 25% (FY2012E). We value the stock at 14.3x
by 9.6% in the application business. Net profit increased to FY2012E EPS of Rs60.9 (at 32% discount to Infosys' target PE
Rs271.3cr despite flat EBIT due to tax write-back with retreatment Target
of 21x) and maintain our Buy rating on the stock with a Target
of profits under Section 10AA related to SEZ. Price of Rs872.
HP business to stabilise, as price uncertainty is now over: During
the quarter, Mphasis demonstrated strong volume growth,
primarily because of the BFS spending wave. The company's
growth has been phenomenal as it continues to enjoy the
benefits of offshoring by HP The flip side to this Master-level
. Key Financials (Consolidated)
Service Agreement is the kind of pricing cut witnessed by the Y/E Oct. (Rs cr) FY2009 FY2010E FY2011E FY2012E
company in 3QFY2010 in the application business. However, Net Sales 4,264 5,040 6,083 7,101
increased pricing in the ITO segment came in as a surprise for
% chg 30.5 18.2 20.7 16.7
the company in 3QFY2010.
Profit
Net Profit 909 1,088 1,237 1,279
The major pricing review overhang is done and dusted and,
going forward, management expects a stable pricing % chg 79.4 19.8 13.7 3.4
arrangement with HP given that the 50% of rate card pricing EBITDA Margin (%) 26.4 25.5 25.4 24.2
will remain fixed and 50% will be market driven. In case of the FDEPS (Rs) 43.4 51.8 58.9 60.9
ITO segment, which is primarily HP-driven, the rate card has
P/E (x) 14.4 12.0 10.6 10.2
proved favorable and, with the acquisition of Fortify, will help
P/BV (x) 5.6 3.8 2.8 2.2
to manage cost due to its remote infrastructure services. Thus,
we believe HP's strong parentage would continue to support RoE (%) 52.1 37.7 30.5 24.1
and provide increased business opportunities to Mphasis. RoCE (%) 58.3 56.2 49.0 43.6
Outlook and valuation EV/Sales (x) 2.8 2.2 1.7 1.3
Mphasis has been consistently outperforming its peers on the EV/EBITDA (x) 10.7 8.6 6.7 5.5
back of a strong pipeline from HP-EDS. We assume the Source: Company, Angel Research, Price as on August 26, 2010
Research Analyst - Srishti Anand/Vibha Salvi
For Private Circulation Only | Angel Broking Ltd: BSE Sebi Regn No : INB 010996539 / CDSL Regn No: IN - DP - CDSL - 234 - 2004 / PMS Regn Code: PM/INP00000154 6 Angel Securities Ltd:BSE: INB010994639/INF010994639 NSE: INB230994635/INF230994635 Membership numbers: BSE 028/NSE:09946 3
4. Technical Picks | August 28, 2010
5350 remains a make or break level?
Sensex (17998) / Nifty (5409)
In our previous Weekly report, looking at the placement of the
Exhibit 1: Sensex Weekly chart
momentum indicator and breakout from the weekly sideways Channel
consolidation pattern, we expected indices to test 18900 - 19050
/ 5700 - 5750 levels once they trade and close above
18475 / 5547 levels. The week began on a flat note, was unable
to cross 18475 / 5547 levels, and witnessed selling pressure
that dragged down the Sensex and the Nifty to close with a net
loss of 2.2% vis-à-vis the previous week.
Pattern Formation
On the Weekly chart in spite of a breakout from a
chart, Source: Falcon
five-week long consolidation, prices were unable to pierce and
sustain above the upper trendline of the Channel. Hence, now
17840 / 5350 remain crucial support levels for the markets as
any close below these levels would intensify the selling pressure
(refer Exhibit 1).
Future Outlook
After the sharp fall on the last day of the week, markets are
near crucial support levels of 18000 - 17840 / 5400 - 5350.
On the daily charts, the momentum oscillators are in the
oversold zone. Hence, a bounce from current levels cannot be
ruled out. On the upside, immediate resistance is at 18290 /
5500 levels, and any move beyond 18290 / 5500 levels would
warrant a further upside momentum to test 18900 - 19050 /
5700 - 5750 levels.
We maintain our view that traders with long positions in the
range of 5470 - 5400 levels should maintain a STRICT stop
loss at 5340 level. Any close below this level would see a
substantial fall in the markets.
For Private Circulation Only | Angel Broking Ltd: BSE Sebi Regn No : INB 010996539 / CDSL Regn No: IN - DP - CDSL - 234 - 2004 / PMS Regn Code: PM/INP00000154 6 Angel Securities Ltd:BSE: INB010994639/INF010994639 NSE: INB230994635/INF230994635 Membership numbers: BSE 028/NSE:09946 4
6. Derivatives Review | August 28, 2010
Don't expect significant downside in Market
Nifty spot has closed at 5409 this week, against a close of 5531 last week. The Put-Call Ratio has decreased from 1.65 to 1.45 levels
and the annualized Cost of Carry (CoC) is positive 1.40 The Open Interest of Nifty Futures has decreased by 17.15
1.40%. 17.15%.
Put-Call Ratio Analysis Futures Annual Volatility Analysis
The Nifty PCR has decreased from 1.65 to 1.45 levels due to The Historical Volatility of the Nifty has increased from 13.86%
expiry of Aug contracts. Week on week, substantial build up to 14.12%. IV of at the money options has increased from
was visible in the 5500 and 5600 call options and the 5600 11.50% to 17.50%. Some liquid counters where HV has
call has highest open interest. Many Put options added huge increased significantly are ISPATIND, GTOFFSHORE, BPCL,
open interest in the week gone by. After a continuous buying in TATAPOWER and HEROHONDA. Stocks where HV has
cash market segment, a small selling of Rs241cr was visible decreased are SUNPHARMA, SESAGOA, ACC, RNRL and
from FIIs' side in last week. Market is still in the broader range EDUCOMP .
of 5200 to 5600.
Open Interest Analysis Cost-of-Carry Analysis
The total Open Interest of the market is Rs1,42,825cr, as against The Nifty Sep. Future closed at a premium of 7.05 points and
Rs1,90,972cr last week, and the Stock Futures' open interest Oct. future closed at a premium of 12.35 points. Few liquid
decreased from Rs52,394cr to Rs42,437cr. New series has counters where CoC is positive are ABIRLANUVO, WELCORP ,
witnessed a strong market wide rollover of 82.73%. Banking GMRINFRA, GTLINFRA and PATELENG. Stocks where CoC is
stocks may correct due to profit booking as the rollover is negative are AMBUJACEM, RELCAPITAL, UNIONBANK, IDEA
comparatively less in this sector. Some liquid stocks where open and ACC. Few stocks which are trading at a discount due to
interest has increased significantly are GTOFFSHORE, dividend are HEROHONDA, SCI, IOC, HINDPETRO and
ABIRLANUVO, SYNDIBANK, MPHASIS and ORCHIDCHEM. ONGC.
Stocks where open interest has decreased significantly are
PETRONET, RANBAXY, AUROPHARMA, ITC and BANKINDIA.
Derivative Strategy
Scrip : RELINFRA CMP : Rs. 983.15/- Lot Size : 250 Expiry Date (F&O) :
30th Sep, 2010
View: Mildly Bullish Strategy: Long Call Ladder Expected Payoff
Buy/Sell Qty Scrip Strike Series Option Rate Closing Price
Price Expected
rofit/Loss
Profit/Loss
Price Type (Rs.)
Buy 250 RELINFRA 1000 Sep Call 33.00 Rs. 950.00 (Rs. 9.00)
Sell 250 RELINFRA 1050 Sep Call 17.00
Rs. 1000.00 (Rs. 9.00)
Sell 250 RELINFRA 1100 Sep Call 7.00
Rs. 1050.00 Rs. 41.00
LBEP: Rs. 1,009.00/-
LBEP:
HBEP: Rs. 1,141.00/-
HBEP: Rs. 1100.00 Rs. 41.00
Max. Risk: Unlimited Max. Profit: Rs. 10,250.00/-
Profit:
Rs. 1150.00 (Rs. 9.00)
If RELINFRA continues to trade above HBEP. If RELINFRA closes on or between Rs1050-1100 on expiry.
Note: Profit can be booked before expiry if Stock continuous to trade in the desired range and time value decay. Rs. 1200.00 (Rs. 59.00)
For Private Circulation Only | Angel Broking Ltd: BSE Sebi Regn No : INB 010996539 / CDSL Regn No: IN - DP - CDSL - 234 - 2004 / PMS Regn Code: PM/INP00000154 6 Angel Securities Ltd:BSE: INB010994639/INF010994639 NSE: INB230994635/INF230994635 Membership numbers: BSE 028/NSE:09946 6
7. Fund Focus
Mutual Fund Focus | August 28, 2010
Recommended Schemes in Debt Funds - Income Funds
Birla Sun Life Dynamic Bond Fund - Ret - Growth
Scheme Objective Top 5 Holdings as on 31st July 2010
To generate optimal returns with high liquidity through active Company Name Nature Rating % of
management of the portfolio by investing in high quality Debt and Net Assets
Money Market instruments. IDBI Money A1+ 11.53
Tata Capital ABS AA+ (SO) 6.27
Scheme Snapshot
Tata Sons Debenture AAA 5.31
Inception: 30th Sept 2004 Power Fin. Corp. FRB AAA 4.86
Type: Open Ended Scheme LIC Hsg. Fin. Debenture AAA 4.77
Corpus: 8412.57 crores (31st July 2010)
Fund Manager: Mr. Maneesh Dangi Top 5 Sectors as on 31st July 2010
Benchmark Index: Crisil Composite Bond Fund Index Sector Name % of Net Assets
Minimum Investment: Rs. 5000 Banks 34.14
Entry / Exit Load: NIL / Max 0.5%
Load: NBFC 18.83
Latest NAV: 15.80 (25th August 2010)
NAV HFC 12.13
Week
52 Week High: 15.80 (25th August 2010) Diversified 6.83
52 Week Low: 14.88 (26th August 2009)
Week Low: FI 6.07
Asset Allocation (% of Net Asset)
% Investments in Securities as on 31st July 2010
Debt Exposure: 55.13%
Cash & Equivalent Exposure: 44.87% 4.48
9.70 13.27
Key Ratios* 4.08
6.27
Expense Ratio: 1% 4.12
Standard Deviation: 0.03 6.56
Beta: 0.70 30.56
20.96
Sharpe: 1.90
Jensen: 4.06
Avg. Maturity: 347 days
Avg. A1+ AA+ (SO) AAA P1+ PR1+ AA+ Cash AAA(SO) Others
Modified Duration: 274 days
*3 Years Daily rolling return (CAGR); Returns < 1 year Absolute & > =1 year CAGR
basis; Returns & Ratios as on 26th August 2010. ** SIP Investment of Rs. 1000 p.m. Performance Analysis (% Returns)
Fund Analysis 12
9.99
9.5
The scheme has 55% Debt exposure & holds 45% Cash exposure. 10
8.54
8.04
Banks, NBFC and HFC are largest Sector Allocation. The scheme 8
6.19
7.81
6.42
has invested in Diversified Fixed Income Instruments about 21% in 6 5.5 5.53
5.88
Bonds, 34% in Debentures and 45% in Money Market Instruments. 4
Portfolio predominantly comprises of short-term instruments. Its 2
portfolio is constructed to earn credit spreads. The scheme has 0
outperformed its Benchmark since Inception. 1 year 2 years 3 years 5 years Since Inception
Birla Sun Life Dynamic Bond Fund Ret - Growth
- Crisil Composite Bond Fund Index
Fund USPs:
USPs: *Note: Returns are as on 26th August on CAGR basis
High risk adjusted returns which are indicated from a positive
Sharpe Ratio. Investment Analysis** (as on 26th August 2010)
High Credit Quality of Papers which take care of Credit Risk. Company Name Total SIP Lump sum
Average Maturity & Expense Ratio is one of the Lowest among Amount Invested Present Value Present Value
Value Value
these categories of Funds. 1 year 12,000 12,297 12,661
Positive Jensen ratio indicates fine selection of securities by fund 2 years 24,000 25,645 28,519
manager. 3 years 36,000 40,738 47,595
Invested in Diversified Fixed Income Instruments which takes
Ideal for Investors
care of Liquidity.
Investors seeking returns linked to fixed income markets, without
Stability to the portfolio by investing in fixed income instruments.
taking significant price risk.
Offers protection of capital and steady returns. Investment Horizon: Long Term
Risk Appetite: Low
Disclaimer: Angel Capital & Debt Market Ltd is not responsible for any error or inaccuracy or any losses suffered on account of information contained in this report. Mutual Fund investments are subjected to
market risk. Read the Scheme information document carefully before investing.
For Private Circulation Only | Angel Broking Ltd: BSE Sebi Regn No : INB 010996539 / CDSL Regn No: IN - DP - CDSL - 234 - 2004 / PMS Regn Code: PM/INP00000154 6 Angel Securities Ltd:BSE: INB010994639/INF010994639 NSE: INB230994635/INF230994635 Membership numbers: BSE 028/NSE:09946 7
8. Fund Focus
Mutual Fund Focus | August 28, 2010
ICICI Prudential Income Fund - Growth
Scheme Objective Top 5 Holdings as on 31st July 2010
To generate income through investments in a range of debt and Company Name Nature Rating % of
money market instruments of various maturities with a view to Net Assets
maximizing income while maintaining the optimum balance of yield, Indian Oil Corp. Bond AA+ 17.89
safety and liquidity. IDBI Ltd. CD A1+ 9.62
Scheme Snapshot Oriental Bank of Commerce CD P1+ 8.96
LIC Hsg. Fin. Bond AAA 8.94
Inception: 19th June 1998
National Hsg. Bank Bond AAA 8.9
Type: Open Ended Scheme
Corpus: 640.73 crores (31st July 2010) Top 5 Sectors as on 31st July 2010
Fund Manager: Mr. Kuldeepsinh Jagtap Sector Name % of Net Assets
Benchmark Index: Crisil Composite Bond Fund Index Banks 30.53
Minimum Investment: Rs. 5000 Oil & Gas 17.89
Entry / Exit Load: NIL
Load: HFC 17.08
Latest NAV: 30.35 (25th August 2010)
NAV FI 12.19
52 Week High: 30.41 (26th July 2010)
Week Sovereign 7.26
52 Week Low: 29.25 (1st Sept. 2009)
Week Low:
% Investments in Securities as on 31st July 2010
Asset Allocation (% of Net Asset)
Debt Exposure: 68.52% 7.26
14.44
Cash & Equivalent Exposure: 31.48% 16.01
Key Ratios* 1.03
21.92
Expense Ratio: 2.06%
Standard Deviation: 0.07
Beta: 2.58 39.34
Sharpe: 0.85
A1+ AA+ AAA Cash P1+ Sovereign
Jensen: 3.25
Avg. Maturity: 2.24 years
Avg.
Performance Analysis (% Returns)
Modified Duration: 1.73 years
*3 Years Daily rolling return (CAGR); Returns < 1 year Absolute & > =1 year CAGR
basis; Returns & Ratios as on 26th August 2010. ** SIP Investment of Rs. 1000 p.m.
Fund Analysis
The scheme has 69% Debt exposure & holds 31% Cash exposure.
Banking, Oil & Gas, HFC and FIs are largest Sector Allocation.
The scheme has invested in Diversified Fixed Income Instruments,
about 61% in Bonds, 30% in CD/FD and 1% in Money Market
Instruments. Portfolio predominantly comprises of short-term
ICICI Prudential Income Fund ‐Growth Crisil Composite Bond Fund Index
instruments. Its portfolio is constructed to earn credit spreads. The
*Note: Returns are as on 26th August, 2010 are on CAGR basis
scheme has outperformed its Benchmark since Inception.
Fund USPs:
USPs: Investment Analysis** (as on 26th August 2010)
Company Name Total SIP Lump sum
High risk adjusted returns which are indicated from a positive
Amount Invested Present Value Present Value
Value Value
Sharpe Ratio.
2 years 24,000 25,280 29,668
High Credit Quality of Papers which take care of Credit Risk.
3 years 36,000 40,805 48,493
Fine selection of securities shown by positive Jensen ratio.
4 years 48,000 57,641 69,015
Invested in Diversified Fixed Income Instruments which takes
care of Liquidity. Ideal for Investors
Stability to the portfolio by investing in fixed income instruments. Investors seeking returns linked to fixed income markets, without
Offers protection of capital and steady returns. taking significant price risk.
Investment Horizon: Long Term
Risk Appetite: Low
Disclaimer: Angel Capital & Debt Market Ltd is not responsible for any error or inaccuracy or any losses suffered on account of information contained in this report. Mutual Fund investments are subjected to
market risk. Read the Scheme information document carefully before investing.
For Private Circulation Only | Angel Broking Ltd: BSE Sebi Regn No : INB 010996539 / CDSL Regn No: IN - DP - CDSL - 234 - 2004 / PMS Regn Code: PM/INP00000154 6 Angel Securities Ltd:BSE: INB010994639/INF010994639 NSE: INB230994635/INF230994635 Membership numbers: BSE 028/NSE:09946 8
9. Currency Corner | August 28, 2010
Currencies Weekly Performance Snapshot
The US dollar index (DX) declined slightly in the last week to Exhibit 2: Spot Rupee Weekly Price Chart
close at 82.92 against a basket of currencies. Slight revival in
the financial markets after better-than-expected US GDP figures
reduced demand for the DX. However, the currency touched a
high of 83.56 in the mid-week after poor economic data from
the US that led to jitters in the equities segment. Existing homes
sales in the US declined to 3.83 million in July, the lowest level
in last 15 years. In the previous month, existing home sales
had recorded sales of 5.26 million. Markets had expected sales
of around 4.6 million in July. Moreover, core durable goods
orders for US declined by 3.8% in July from the previous increase Source: Telequote
of 0.2% in June. New home sales in the US dropped
Fundamental and Technical Outlook
unexpectedly by 12% from June to 276,000 in July, the lowest
level on record. Poor economic data is indicating that the Federal Poor economic updates from the US are reiterating concerns
Reserve may need to initiate further steps to stall the faltering that the economic recovery in the world's largest economy could
economy. falter. Investors are currently concerned over a double-dip
recession. The US job market is also weak currently. The US is
Exhibit 1: Currencies Performance expected to announce data on unemployment rate in this week
Currency 28-Aug 21-Aug Chg % Chg and it is expected to rise to 9.6%. This data could lead to further
DX 82.92 83.06 (0.14) (0.2) concerns over job scenario in the US. We expect the Indian
Euro 1.2733 1.2705 0.0028 0.2 Rupee to depreciate in the coming week as uncertainty over the
INR 46.89 46.67 0.22 0.5 global economic scenario prevails. The major central banks of
JPY 85.22 85.61 (0.39) (0.5) the world comprising of the Federal Reserve, the ECB, and the
GBP 1.5535 1.5531 0.0004 0.0 Bank of England are keeping interest rates low to support their
Source: Telequote individual economies. Low interest rates and poor economic
data from the US is affecting market sentiments. Month-end
Japanese Yen touches a 15-year high
dollar demand by importers will also exert pressure on the Indian
The JPY touched a fresh 15-year high of 83.57 against the Rupee.
greenback in the last week. However, the Yen managed to pare
some gains after Japan's finance minister Yoshihiko Noda said Exhibit 3: Technical Levels
that appropriate action would be taken whenever necessary to Currency Support Resistance Trend
avoid sharp appreciation in the Yen. However, clear indications DX 82.00 84.00 Sideways
of the timing of intervention still remain undisclosed. A stronger Euro 1.2500 1.2300 Down
Yen is detrimental for the export-oriented Japanese economy INR 46.36 47.35 Up
and hence investors expect that the growth in the country would JPY 82.72 87.00 Down
further slow down in the coming quarters. Japan's GDP grew GBP 1.5260 1.5760 Down
Source: Telequote
by 0.1% in the second quarter (0.4% in annualized terms).
Indian Rupee depreciates slightly last week
The INR depreciated in the last week as poor sentiments in the
equities segment raised concerns over capital outflows from
the country. Moreover, month-end dollar demand by importers
also weighed on the currency. FII inflows in August 2010 totaled
Rs 11,291 crore (till 25 August 2010). FII inflows in July 2010
totaled Rs 17,657.60 crore. For the calendar year 2010 FII
inflows totaled Rs 58985.30 crore (till 25 August 2010).
Research Associate (Commodity) - Naser Parkar
For Private Circulation Only | Angel Broking Ltd: BSE Sebi Regn No : INB 010996539 / CDSL Regn No: IN - DP - CDSL - 234 - 2004 / PMS Regn Code: PM/INP00000154 6 Angel Securities Ltd:BSE: INB010994639/INF010994639 NSE: INB230994635/INF230994635 Membership numbers: BSE 028/NSE:09946 9