1. Derivative Report
India Research
April 13, 2010
Comments
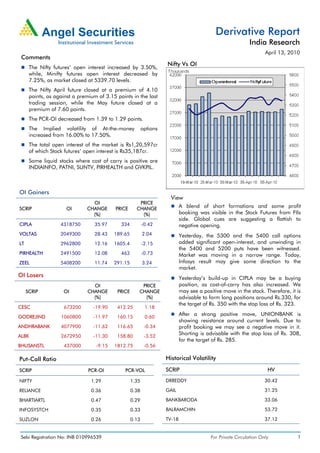
Nifty Vs OI
The Nifty futures’ open interest increased by 3.50%,
while, Minifty futures open interest decreased by
7.25%, as market closed at 5339.70 levels.
The Nifty April future closed at a premium of 4.10
points, as against a premium of 3.15 points in the last
trading session, while the May future closed at a
premium of 7.60 points.
The PCR-OI decreased from 1.39 to 1.29 points.
The Implied volatility of At-the-money options
increased from 16.00% to 17.50%.
The total open interest of the market is Rs1,20,597cr
of which Stock futures’ open interest is Rs35,187cr.
Some liquid stocks where cost of carry is positive are
INDIAINFO, PATNI, SUNTV, PIRHEALTH and GVKPIL.
OI Gainers
View
OI PRICE
SCRIP OI CHANGE PRICE CHANGE A blend of short formations and some profit
(%) (%) booking was visible in the Stock Futures from FIIs
side. Global cues are suggesting a flattish to
CIPLA 4318750 35.97 334 -0.42 negative opening.
VOLTAS 2049300 28.43 189.65 2.04 Yesterday, the 5300 and the 5400 call options
LT 2962800 12.16 1605.4 -2.15 added significant open-interest, and unwinding in
the 5400 and 5200 puts have been witnessed.
PIRHEALTH 2491500 12.08 463 -0.73 Market was moving in a narrow range. Today,
ZEEL 5408200 11.74 291.15 3.24 Infosys result may give some direction to the
market.
OI Losers Yesterday’s build-up in CIPLA may be a buying
OI PRICE position, as cost-of-carry has also increased. We
SCRIP OI CHANGE PRICE CHANGE may see a positive move in the stock. Therefore, it is
(%) (%) advisable to form long positions around Rs.330, for
the target of Rs. 350 with the stop loss of Rs. 323.
CESC 673200 -19.90 412.25 1.18
GODREJIND 1060800 -11.97 160.15 0.60
After a strong positive move, UNIONBANK is
showing resistance around current levels. Due to
ANDHRABANK 4077900 -11.62 116.65 -0.34 profit booking we may see a negative move in it.
ALBK 2672950 -11.30 158.80 -3.52
Shorting is advisable with the stop loss of Rs. 308,
for the target of Rs. 285.
BHUSANSTL 437000 -9.15 1812.75 -0.56
Put-Call Ratio Historical Volatility
SCRIP PCR-OI PCR-VOL SCRIP HV
NIFTY 1.29 1.35 DRREDDY 30.42
RELIANCE 0.36 0.38 GAIL 31.25
BHARTIARTL 0.47 0.29 BANKBARODA 33.06
INFOSYSTCH 0.35 0.33 BALRAMCHIN 53.72
SUZLON 0.26 0.13 TV-18 37.12
Sebi Registration No: INB 010996539 For Private Circulation Only 1
2. Derivative Report | India Research
FII Statistics for 12-April-2010 Turnover on 12-April-2010
Open Interest
No. of Turnover Change
Detail Buy Sell Net Instrument
Contracts (Rs. in cr.) (%)
Contracts Value Change
(Rs. in cr.) (%)
INDEX Index Futures 433844 11211.90 -8.20
984.83 972.07 12.76 518955 14050.05 2.20
FUTURES
INDEX Stock Futures 366307 13670.45 -12.74
2179.86 2350.21 (170.35) 1440793 38494.57 0.29
OPTIONS
STOCK Index Options 1437655 38523.27 2.46
1064.15 1414.83 (350.68) 884202 29611.35 0.30
FUTURES
STOCK Stock Options 70669 2881.97 -14.96
96.75 94.72 2.03 25377 820.75 2.85
OPTIONS
TOTAL 4325.60 4831.83 (506.23) 2869327 82976.71 0.65 Total 2308475 66287.59 -3.74
Nifty Spot = 5339.70 Lot Size = 50
Bull-Call Spreads Bear-Put Spreads
Action Strike Price Risk Reward BEP Action Strike Price Risk Reward BEP
Buy 5400 51.65 Buy 5300 66.75
32.30 67.70 5432.30 26.60 73.40 5273.40
Sell 5500 19.35 Sell 5200 40.15
Buy 5400 51.65 Buy 5300 66.75
45.95 154.05 5445.95 43.90 156.10 5256.10
Sell 5600 5.70 Sell 5100 22.85
Buy 5500 19.35 Buy 5200 40.15
13.65 86.35 5513.65 17.30 82.70 5182.70
Sell 5600 5.70 Sell 5100 22.85
Note: Above mentioned Bullish or Bearish Spreads in Nifty (April Series) are given as an information and not as a recommendation
Nifty Put-Call Analysis
For Private Circulation Only Sebi Registration No: INB 010996539 2
3. Derivative Report | India Research
Strategy Date Scrip Strategy Status
29-March-2010 SUZLON Long Call Continue
29-March-2010 IDBI Long Call Profit Booked on 06-Apr-2010
05-April-2010 RNRL Long Call Continue
05-April-2010 HUL Long Put Profit Booked on 08-Apr-2010
12-April-2010 JPASSOCIAT Ratio Call Spread Continue
DISCLAIMER:
This document is not for public distribution and has been furnished to you solely for your information and must not be reproduced or redistributed to any other person.
Persons into whose possession this document may come are required to observe these restrictions.
Opinion expressed is our current opinion as of the date appearing on this material only. While we endeavor to update on a reasonable basis the information discussed in
this material, there may be regulatory, compliance, or other reasons that prevent us from doing so. Prospective investors and others are cautioned that any forward-
looking statements are not predictions and may be subject to change without notice. Our proprietary trading and investment businesses may make investment decisions
that are inconsistent with the recommendations expressed herein.
The information in this document has been printed on the basis of publicly available information, internal data and other reliable sources believed to be true and are for
general guidance only. While every effort is made to ensure the accuracy and completeness of information contained, the company takes no guarantee and assumes no
liability for any errors or omissions of the information. No one can use the information as the basis for any claim, demand or cause of action.
Recipients of this material should rely on their own investigations and take their own professional advice. Each recipient of this document should make such investigations
as it deems necessary to arrive at an independent evaluation of an investment in the securities of companies referred to in this document (including the merits and risks
involved), and should consult their own advisors to determine the merits and risks of such an investment. Price and value of the investments referred to in this material may
go up or down. Past performance is not a guide for future performance.
Certain transactions - futures, options and other derivatives as well as non-investment grade securities - involve substantial risks and are not suitable for all investors.
Reports based on technical analysis centers on studying charts of a stock's price movement and trading volume, as opposed to focusing on a company's fundamentals and
as such, may not match with a report on a company's fundamentals.
We do not undertake to advise you as to any change of our views expressed in this document. While we would endeavor to update the information herein on a reasonable
basis, Angel Broking, its subsidiaries and associated companies, their directors and employees are under no obligation to update or keep the information current. Also
there may be regulatory, compliance, or other reasons that may prevent Angel Broking and affiliates from doing so. Prospective investors and others are cautioned that
any forward-looking statements are not predictions and may be subject to change without notice.
Angel Broking Limited and affiliates, including the analyst who has issued this report, may, on the date of this report, and from time to time, have long or short positions
in, and buy or sell the securities of the companies mentioned herein or engage in any other transaction involving such securities and earn brokerage or compensation or
act as advisor or have other potential conflict of interest with respect to company/ies mentioned herein or inconsistent with any recommendation and related information
and opinions.
Angel Broking Limited and affiliates may seek to provide or have engaged in providing corporate finance, investment banking or other advisory services in a merger or
specific transaction to the companies referred to in this report, as on the date of this report or in the past.
Sebi Registration No.: INB 010996539
Derivative Research Team derivatives.desk@angeltrade.com
For Private Circulation Only Sebi Registration No: INB 010996539 3