Model Call Girl in Tilak Nagar Delhi reach out to us at 🔝9953056974🔝
Rollover Report jun july 2010- (2)
1. Rollover Report
India Research
Jun 25, 2010
Rollover in Nifty(70.28%) has been high both in terms of percentage and absolute open interest.
Observation throughout the series indicates that FII’s have covered their short positions in index when
nifty started bouncing from 4800 levels and above 5100 they have formed fresh long positions. On the
other hand domestic participants have been skeptical on the market and were net short. Nifty and
Minifty(70.83%) rollovers suggest that its status quo in terms of positions as we start July series. This
indicates that we need not worry about significant rise in open interest and also we are witnessing
substantial inflows in cash market from strong hands despite slight corrections in market. But
assessment of options suggests, 5400-5500 may act as stiff resistance zone for the market and we
would recommend to short around those levels. Time wise this is long expiry and implied volatility is on
the lower side so avoid writing options.
Indices Change NIFTY & PCR Graph
Price
Change 3 month
INDEX Price (%) Rollover avg.
NIFTY 5320.60 6.35 70.28 69.32
BANKNIFTY 9673.60 4.48 74.12 71.86
MINIFTY 5320.60 6.35 70.83 64.21
NFTYMCAP50 2760.50 6.97 - 16.68
CNXIT 6014.60 5.27 71.28 54.70
Monthly Gainers Monthly Losers
Price Ol Price Ol
Change Open Change Change Open Change
Scrip Price (%) Interest (%) Scrip Price (%) Interest (%)
RCOM 188.05 35.09 25348600 (0.83) PATNI 506.95 (7.26) 2100800 64.50
RELMEDIA 213.30 30.38 2524400 0.11 MPHASIS 564.45 (5.76) 2600600 10.08
BGRENERGY 719.20 25.61 466100 632.86 PETRONET 77.50 (4.50) 5451600 26.45
BRFL 255.20 24.73 6982200 61.43 GRASIM 1798.75 (3.93) 252125 127.65
ORCHIDCHEM 164.85 24.09 4122400 (21.13) BPCL 550.75 (3.84) 2582600 17.27
Note: Stocks which have more than 1000 contract in Futures OI. Note: Stocks which have more than 1000 contract in Futures OI.
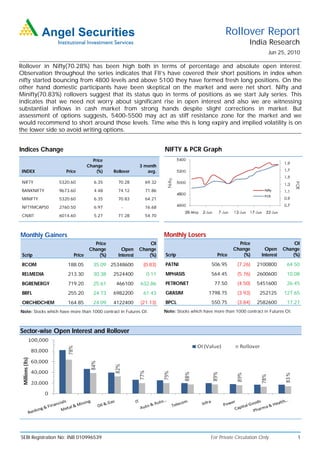
Sector-wise Open Interest and Rollover
SEBI Registration No: INB 010996539 For Private Circulation Only 1
2. Derivative Report | India Research
Banking and Financials
BANKNIFTY (74.12%) has seen significant rise in
Millions (Rs) 0 28000 56000 84000 open interest with strong rollovers. These are
mainly long positions. It has strong resistance
76% around 9700-9800 levels. Be cautious above these
ICICIBANK Rollover levels.
76% OI (Value) Heavy weights of the sector SBIN (75.56%) and
SBIN ICICIBANK (76.21%) are also near their strong
resistance of 2400 and 920 respectively. Avoid
74% longs in them.
HDFCBANK
Midcap banks like UNIONBANK (59.52%),
HDFC 72% ANDHRABANK (64.86%), BANKINDIA (68.56%)
and ORIENTBANK (68.87%) have witness less
78% rollovers in percentage but have added substantial
SECTOR
OI on month-on-month basis.
Metal and Mining
Millions (Rs) 0 20000 40000 European troubles had led to correction in metal
space and most of the counters have shed open
89% interest.
TATASTEEL Rollover
80% OI (Value) TATASTEEL (89.39%) has witnessed highest
SESAGOA rollover in this space and we believe its more of
short positions from strong hands. Sell on rise;
JSWSTEEL 83%
520 is a strong resistance.
87%
STER HINDALCO (75.23%) has lowest rollovers and
have reduced substantial OI. 135-160 is the zone
84%
SECTOR in which stock may trade for this month.
Oil and Gas
Millions (Rs) 0 20000 40000 GAIL (62.28%) has seen lowest rollover and
reduced significant OI which were long positions
82% Rollover according to us. We suggest move out of longs
RELIANCE
and aggressive traders may short this counter;
OI (Value)
89% stock may drift down to 445-450 levels.
CAIRN
65% ONGC (64.50%) too has seen less rollover. 1220
ONGC is strong resistance for the counter and
1100-1120 is strong support.
ABAN 83%
PETRONET (80.71%) added significant OI and
82%
SECTOR rollovers too are on higher side. These are mainly
shorts. Stock is good buy around 72 levels.
For Private Circulation Only SEBI Registration No: INB 010996539 2
3. Derivative Report | India Research
Auto and Auto Ancillary
Millions (Rs)
0 10000 20000 30000 APOLLOTYRE (88.37%) has strong support
around 64-65. Counter has added significant OI
81% Rollover which believe are longs and also rollover figure is
TATAMOTORS
decent. Buy near support zone.
OI (Value)
79%
MARUTI
Rise in MARUTI (79.13%) was more due to short
81% covering. We don’t see upside above 1420-1450
M&M levels.
HEROHONDA 76% BHARATFORG (91.95%) has shown highest
rollover. Stock is at it strong resistance of 295-
79% 300. Square-off longs in it.
SECTOR
Information Technology
Millions (Rs) 0 10000 20000 30000
64% INFOSYSTCH (64.25%) has witness less rolls and
INFOSYSTCH Rollover has shed OI. 2800-2850 is strong resistance zone.
OI (Value) Square off longs in it.
81%
TCS
Midcap IT counters like POLARIS (81.50%), ROLTA
89% (56.95%) and MPHASIS (74.41%) have added OI
HCLTECH month-on-month and have underperform.
EDUCOMP 84% TECHM (78.14%) have rallied mainly due to short
covering.
77%
SECTOR
Telecom
Millions (Rs) 0 6000 12000 18000 24000
RCOM (85.76%) has strong resistance around
87% Rollover 195-200 range. Avoid fresh longs. Buy 190 puts
BHARTIARTL to trade with negative bias; 173-175 quite likely.
OI (Value)
86% Counters like GTL (98.05%), MTNL (91.33%),
RCOM
IDEA (89.78%) and TTML (89.55%) have shown
98% high rollovers.
GTL
BHARTIARTL (86.61%) has strong support around
GTLINFRA 80% 255. Square off short positions near support and
form some fresh longs.
88%
SECTOR
For Private Circulation Only SEBI Registration No: INB 010996539 3
10. Derivative Report | India Research
DISCLAIMER:
This document is not for public distribution and has been furnished to you solely for your information and must not be reproduced or redistributed to any other person.
Persons into whose possession this document may come are required to observe these restrictions.
Opinion expressed is our current opinion as of the date appearing on this material only. While we endeavor to update on a reasonable basis the information discussed in
this material, there may be regulatory, compliance, or other reasons that prevent us from doing so. Prospective investors and others are cautioned that any forward-
looking statements are not predictions and may be subject to change without notice. Our proprietary trading and investment businesses may make investment decisions
that are inconsistent with the recommendations expressed herein.
The information in this document has been printed on the basis of publicly available information, internal data and other reliable sources believed to be true and are for
general guidance only. While every effort is made to ensure the accuracy and completeness of information contained, the company takes no guarantee and assumes no
liability for any errors or omissions of the information. No one can use the information as the basis for any claim, demand or cause of action.
Recipients of this material should rely on their own investigations and take their own professional advice. Each recipient of this document should make such investigations
as it deems necessary to arrive at an independent evaluation of an investment in the securities of companies referred to in this document (including the merits and risks
involved), and should consult their own advisors to determine the merits and risks of such an investment. Price and value of the investments referred to in this material may
go up or down. Past performance is not a guide for future performance.
Certain transactions - futures, options and other derivatives as well as non-investment grade securities - involve substantial risks and are not suitable for all investors.
Reports based on technical analysis centers on studying charts of a stock's price movement and trading volume, as opposed to focusing on a company's fundamentals and
as such, may not match with a report on a company's fundamentals.
We do not undertake to advise you as to any change of our views expressed in this document. While we would endeavor to update the information herein on a reasonable
basis, Angel Broking, its subsidiaries and associated companies, their directors and employees are under no obligation to update or keep the information current. Also
there may be regulatory, compliance, or other reasons that may prevent Angel Broking and affiliates from doing so. Prospective investors and others are cautioned that
any forward-looking statements are not predictions and may be subject to change without notice.
Angel Broking Limited and affiliates, including the analyst who has issued this report, may, on the date of this report, and from time to time, have long or short positions
in, and buy or sell the securities of the companies mentioned herein or engage in any other transaction involving such securities and earn brokerage or compensation or
act as advisor or have other potential conflict of interest with respect to company/ies mentioned herein or inconsistent with any recommendation and related information
and opinions.
Angel Broking Limited and affiliates may seek to provide or have engaged in providing corporate finance, investment banking or other advisory services in a merger or
specific transaction to the companies referred to in this report, as on the date of this report or in the past.
Sebi Registration No.: INB 010996539
Derivative Research Team derivatives.desk@angeltrade.com
For Private Circulation Only SEBI Registration No: INB 010996539 10