NO1 WorldWide Genuine vashikaran specialist Vashikaran baba near Lahore Vashi...
Derivatives Report - July 2, 2010
1. Derivative Report
India Research
July 02, 2010
Comments
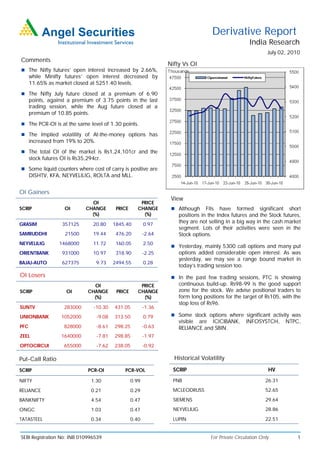
Nifty Vs OI
The Nifty futures’ open interest increased by 2.66%,
while Minifty futures’ open interest decreased by
11.65% as market closed at 5251.40 levels.
The Nifty July future closed at a premium of 6.90
points, against a premium of 3.75 points in the last
trading session, while the Aug future closed at a
premium of 10.85 points.
The PCR-OI is at the same level of 1.30 points.
The Implied volatility of At-the-money options has
increased from 19% to 20%.
The total OI of the market is Rs1,24,101cr and the
stock futures OI is Rs35,294cr.
Some liquid counters where cost of carry is positive are
DISHTV, KFA, NEYVELILIG, ROLTA and MLL.
OI Gainers
View
OI PRICE
SCRIP OI CHANGE PRICE CHANGE Although FIIs have formed significant short
(%) (%) positions in the Index futures and the Stock futures,
GRASIM 357125 20.80 1845.40 0.97
they are not selling in a big way in the cash market
segment. Lots of their activities were seen in the
SAMRUDDHI 21500 19.44 476.20 -2.64 Stock options.
NEYVELILIG 1468000 11.72 160.05 2.50
Yesterday, mainly 5300 call options and many put
ORIENTBANK 931000 10.97 318.90 -2.25 options added considerable open interest. As was
yesterday, we may see a range bound market in
BAJAJ-AUTO 627375 9.73 2494.55 0.28
today’s trading session too.
OI Losers In the past few trading sessions, PTC is showing
OI PRICE continuous build-up. Rs98-99 is the good support
SCRIP OI CHANGE PRICE CHANGE zone for the stock. We advise positional traders to
(%) (%) form long positions for the target of Rs105, with the
stop loss of Rs96.
SUNTV 283000 -10.30 431.05 -1.36
UNIONBANK 1052000 -9.08 313.50 0.79 Some stock options where significant activity was
visible are ICICIBANK, INFOSYSTCH, NTPC,
PFC 828000 -8.61 298.25 -0.63 RELIANCE and SBIN.
ZEEL 1640000 -7.81 298.85 -1.97
OPTOCIRCUI 655000 -7.62 238.05 -0.92
Put-Call Ratio Historical Volatility
SCRIP PCR-OI PCR-VOL SCRIP HV
NIFTY 1.30 0.99 PNB 26.31
RELIANCE 0.21 0.29 MCLEODRUSS 52.65
BANKNIFTY 4.54 0.47 SIEMENS 29.64
ONGC 1.03 0.47 NEYVELILIG 28.86
TATASTEEL 0.34 0.40 LUPIN 22.51
SEBI Registration No: INB 010996539 For Private Circulation Only 1
2. Derivative Report | India Research
FII Statistics for 01-July-2010 Turnover on 01-July-2010
Open Interest
No. of Turnover Change
Detail Buy Sell Net Instrument
Contracts (Rs. in cr.) (%)
Contracts Value Change
(Rs. in cr.) (%)
INDEX Index Futures 678245 16484.79 -0.35
1042.57 2628.51 (1,585.94) 710222 18542.73 4.97
FUTURES
INDEX Stock Futures 551354 15950.48 -13.08
5405.62 4715.27 690.35 1693860 44432.63 2.82
OPTIONS
STOCK Index Options 1540311 40714.58 -4.23
781.15 1325.17 (544.03) 1098750 28612.99 1.44
FUTURES
STOCK Stock Options 98077 2886.94 -4.39
314.68 88.12 226.57 41415 1152.91 39.10
OPTIONS
TOTAL 7544.02 8757.07 (1,213.05) 3544247 92741.25 3.12 Total 2867987 76036.79 -5.46
Nifty Spot = 5251.40 Lot Size = 50
Bull-Call Spreads Bear-Put Spreads
Action Strike Price Risk Reward BEP Action Strike Price Risk Reward BEP
Buy 5300 89.90 Buy 5200 94.00
43.90 56.10 5343.90 28.55 71.45 5171.45
Sell 5400 46.00 Sell 5100 65.45
Buy 5300 89.90 Buy 5200 94.00
71.15 128.85 5371.15 50.35 149.65 5149.65
Sell 5500 18.75 Sell 5000 43.65
Buy 5400 46.00 Buy 5100 65.45
27.25 72.75 5427.25 21.80 78.20 5078.20
Sell 5500 18.75 Sell 5000 43.65
Note: Above mentioned Bullish or Bearish Spreads in Nifty (July Series) are given as an information and not as a recommendation
Nifty Put-Call Analysis
For Private Circulation Only SEBI Registration No: INB 010996539 2
3. Derivative Report | India Research
Strategy Date Scrip Strategy Status
28-June-2010 Reliance Long Put Continue
DISCLAIMER:
This document is not for public distribution and has been furnished to you solely for your information and must not be reproduced or redistributed to any other person.
Persons into whose possession this document may come are required to observe these restrictions.
Opinion expressed is our current opinion as of the date appearing on this material only. While we endeavor to update on a reasonable basis the information discussed in
this material, there may be regulatory, compliance, or other reasons that prevent us from doing so. Prospective investors and others are cautioned that any forward-
looking statements are not predictions and may be subject to change without notice. Our proprietary trading and investment businesses may make investment decisions
that are inconsistent with the recommendations expressed herein.
The information in this document has been printed on the basis of publicly available information, internal data and other reliable sources believed to be true and are for
general guidance only. While every effort is made to ensure the accuracy and completeness of information contained, the company takes no guarantee and assumes no
liability for any errors or omissions of the information. No one can use the information as the basis for any claim, demand or cause of action.
Recipients of this material should rely on their own investigations and take their own professional advice. Each recipient of this document should make such investigations
as it deems necessary to arrive at an independent evaluation of an investment in the securities of companies referred to in this document (including the merits and risks
involved), and should consult their own advisors to determine the merits and risks of such an investment. Price and value of the investments referred to in this material may
go up or down. Past performance is not a guide for future performance.
Certain transactions - futures, options and other derivatives as well as non-investment grade securities - involve substantial risks and are not suitable for all investors.
Reports based on technical analysis centers on studying charts of a stock's price movement and trading volume, as opposed to focusing on a company's fundamentals and
as such, may not match with a report on a company's fundamentals.
We do not undertake to advise you as to any change of our views expressed in this document. While we would endeavor to update the information herein on a reasonable
basis, Angel Broking, its subsidiaries and associated companies, their directors and employees are under no obligation to update or keep the information current. Also
there may be regulatory, compliance, or other reasons that may prevent Angel Broking and affiliates from doing so. Prospective investors and others are cautioned that
any forward-looking statements are not predictions and may be subject to change without notice.
Angel Broking Limited and affiliates, including the analyst who has issued this report, may, on the date of this report, and from time to time, have long or short positions
in, and buy or sell the securities of the companies mentioned herein or engage in any other transaction involving such securities and earn brokerage or compensation or
act as advisor or have other potential conflict of interest with respect to company/ies mentioned herein or inconsistent with any recommendation and related information
and opinions.
Angel Broking Limited and affiliates may seek to provide or have engaged in providing corporate finance, investment banking or other advisory services in a merger or
specific transaction to the companies referred to in this report, as on the date of this report or in the past.
Sebi Registration No.: INB 010996539
Derivative Research Team derivatives.desk@angeltrade.com
For Private Circulation Only SEBI Registration No: INB 010996539 3